F5
Paper F5
-Performance
Management
PERFORMANCE MANAGEMENT
British Library Cataloguing-in-Publication Data
A catalogue record for this book is available from the British Library
Published by InterActive World Wide Limited Westgate House, 8-9 Holborn
London EC1N 2LL
www.iaww.com
www.studyinteractive.org
ISBN 978-1-907217-04-3
First Edition 2009 Printed in Romania
© 2009 InterActive World Wide Limited.
London School of Business & Finance and the LSBF logo are trademarks or registered trademarks of London School of Business & Finance (UK) Limited in the UK and in other countries and are used under license. All used brand names or typeface names are trademarks or registered trademarks of their respective holders.
All our rights reserved. No part of this publication may be reproduced, stored in a retrieval system, or transmitted, in any form or by any means, electronic, mechanical, photocopying, recording or otherwise, without the prior written permission of InterActive World Wide.
FOREWORD
3
Thank you for choosing to study with the London School of Business and Finance (LSBF).
A dynamic, quality-oriented and innovative educational institution, the London School of Business and Finance offers specialised programmes, designed with students and employers in mind. We are always at the frontline driving the latest professional developments and trends.
LSBF attracts the highest quality candidates from over 140 countries worldwide. We work in partnership with leading accountancy firms, banks and best-practice organisations – enabling thousands of students to realise their full potential in accountancy, finance and the business world.
With an international perspective, LSBF has developed a rich portfolio of professional qualifications and executive education programmes. To complement our face-to-face and cutting-edge online learning products, LSBF is now pleased to offer tailored study materials to support students in their preparation for exams.
The exam focused content in this manual will provide you with a comprehensive and up-to-date understanding of the ACCA syllabus. We have an award-winning team of tutors, who are highly experienced in helping students through their professional exams and have received consistently excellent feedback.
I hope that you will find this manual helpful and wish you the best of luck in your studies.
Aaron Etingen
PERFORMANCE MANAGEMENT
CONTENTS
5
Contents
Foreword
3
Contents
5
About ACCA Paper F5 - Performance Management
7
Syllabus and Study Guide
11
Pilot Paper
25
Formulae Sheet
43
PERFORMANCE MANAGEMENT
F5
About ACCA
PERFORMANCE MANAGEMENT
9
Aim of the Paper
The aim of the paper is to introduce knowledge and understanding of management accounting.The paper develops knowledge and understanding of how to prepare and calculate costing information for use within a business.
Outline of the Syllabus
Explain the nature of cost and management accounting Explain the purpose of cost and management accounting
Identify and describe costs by classification, behaviour and purpose Explain and apply cost accounting techniques
Prepare and coordinate budgets for feedback and control
Use management accounting techniques to make and support decision making
Format of the Exam Paper
The syllabus is assessed by a two hour computer-based examination. The examination consists of a mixture of 2 mark and 1 mark questions. There will be 40 compulsory 2 mark questions
There will be 10 compulsory 1 mark questions
Getting the most from your studies
Manage your time effectively. If you have a busy work schedule use your study planner to catch up. Do not allow yourself to fall behind.
Make sure that you can apply all the numbers to the formulae and can perform the calculations accurately Practice as many questions as you can. You should aim to have attempted every question in the revision kit at least twice before the exam.
PERFORMANCE MANAGEMENT
PERFORMANCE MANAGEMENT
SYLLABUS AND STUDY GUIDE
13
Performance Management (F5)
This syllabus and study guide is designed to help with planning study and to provide detailed information on what could be assessed in any examination session.
The Structure of the Syllabus and Study Guide
RELATIONAL DIAGRAM OF PAPER WITH OTHER PAPERS
This diagram shows direct and indirect links between this paper and other papers preceding or following it. Some papers are directly underpinned by other papers such as Advanced Performance Management by Performance Management. These links are shown as solid line arrows. Other papers only have indirect relationships with each other such as links existing between the accounting and auditing papers. The links between these are shown as dotted line arrows.This diagram indicates where you are expected to have underpinning knowledge and where it would be useful to review previous learning before undertaking study. OVERALL AIM OF THE SYLLABUS
This explains briefly the overall objective of the paper and indicates in the broadest sense the capabilities to be developed within the paper.
MAIN CAPABILITIES
This paper’s aim is broken down into several main capabilities which divide the syllabus and study guide into discrete sections.
RELATIONAL DIAGRAM OF THE MAIN CAPABILITIES
This diagram illustrates the flows and links between the main capabilities (sections) of the syllabus and should be used as an aid to planning teaching and learning in a structured way.
SYLLABUS RATIONALE
This is a narrative explaining how the syllabus is structured and how the main capabilities are linked. The rationale also explains in further detail what the examination intends to assess and why.
DETAILED SYLLABUS
This shows the breakdown of the main capabilities (sections) of the syllabus into subject areas. This is the blueprint for the detailed study guide.
APPROACH TO EXAMINING THE SYLLABUS
This section briefly explains the structure of the examination and how it is assessed. STUDY GUIDE
PERFORMANCE MANAGEMENT
Intellectual Levels
The syllabus is designed to progressively broaden and deepen the knowledge, skills and professional values demonstrated by the student on their way through the qualification.
The specific capabilities within the detailed syllabuses and study guides are assessed at one of three intellectual or cognitive levels:
Level 1: Knowledge and comprehension Level 2:Application and analysis Level 3: Synthesis and evaluation
Very broadly, these intellectual levels relate to the three cognitive levels at which the Knowledge module, the Skills module and the Professional level are assessed.
Each subject area in the detailed study guide included in this document is given a 1, 2, or 3 superscript, denoting intellectual level, marked at the end of each relevant line. This gives an indication of the intellectual depth at which an area could be assessed within the examination. However, while level 1 broadly equates with the Knowledge module, level 2 equates to the Skills module and level 3 to the Professional level, some lower level skills can continue to be assessed as the student progresses through each module and level. This reflects that at each stage of study there will be a requirement to broaden, as well as deepen capabilities. It is also possible that occasionally some higher level capabilities may be assessed at lower levels.
Learning Hours
The ACCA qualification does not prescribe or recommend any particular number of learning hours for examinations because study and learning patterns and styles vary greatly between people and organisations. This also recognises the wide diversity of personal, professional and educational circumstances in which ACCA students find themselves.
Each syllabus contains between 23 and 35 main subject area headings depending on the nature of the subject and how these areas have been broken down.
Guide to Exam Structure
The structure of examinations varies within and between modules and levels.
The Fundamentals level examinations contain 100% compulsory questions to encourage candidates to study across the breadth of each syllabus.
The Knowledge module is assessed by equivalent two-hour paper based and computer based examinations. The Skills module examinations are all paper based three-hour papers. The structure of papers varies from ten questions in theCorporate and Business Law(F4) paper to four 25 mark questions inFinancial Management(F9).
Individual questions within all Skills module papers will attract between 10 and 30 marks.
The Professional level papers are all three-hour paper based examinations, all containing two sections. Section A is compulsory, but there will be some choice offered in Section B.
For all three hour examination papers,ACCA has introduced 15 minutes reading and planning time.
This additional time is allowed at the beginning of each three-hour examination to allow candidates to read the questions and to begin planning their answers before they start writing in their answer books. This time should be used to ensure that all the information and exam requirements are properly read and understood.
During reading and planning time candidates may only annotate their question paper. They may not write anything in their answer booklets until told to do so by the invigilator.
The Essentials module papers all have a Section A containing a major case study question with all requirements totalling 50 marks relating to this case. Section B gives students a choice of two from three 25 mark questions.
SYLLABUS AND STUDY GUIDE
Section A of each of the Options papers contains 50-70 compulsory marks from two questions, each attracting between 25 and 40 marks. Section B will offer a choice of two from three questions totalling 30-50 marks, with each question attracting between 15 and 25 marks.
The pass mark for all ACCA Qualification examination papers is 50%.
Guide to Examination Assessment
ACCA reserves the right to examine anything contained within the study guide at any examination session. This includes knowledge, techniques, principles, theories, and concepts as specified.
For the financial accounting, audit and assurance, law and tax papers except where indicated otherwise, ACCA will publishexaminable documentsonce a year to indicate exactly what regulations and legislation could
potentially be assessed within identified examination sessions.
For paper based examinations regulationissuedor legislationpassedon or before 30th September annually, will be assessed from June 1st of the following year to May 31st of the year after. Therefore, paper based
examinations in June 2009, December 2009 (and March 2010 where applicable) will be assessed on regulations issued and legislation passed on or before 30 September 2008.
Regulation issued or legislation passed in accordance with the above dates may be examinable even if the effectivedate is in the future.
The term issued or passed relates to when regulation or legislation has been formally approved.
The term effective relates to when regulation or legislation must be applied to an entity transactions and business practices.
The study guide offers more detailed guidance on the depth and level at which the examinable documents will be examined. The study guide should therefore be read in conjunction with the examinable documents list.
Relational Diagram of Paper with Other Papers
Aim
To develop knowledge and skills in the application of management accounting techniques to quantitative and qualitative information for planning, decision-making, performance evaluation, and control
15
APM (P5)
PM (F5)
PERFORMANCE MANAGEMENT
Main Capabilities
On successful completion of this paper candidates should be able to: A Explain, apply, and evaluate cost accounting techniques
B Select and appropriately apply decision-making techniques to evaluate business choices and promote efficient and effective use of scarce business resources, appreciating the risks and uncertainty inherent in business and controlling those risks
C Apply budgeting techniques and evaluate alternative methods of budgeting, planning and control
D Use standard costing systems to measure and control business performance and to identify remedial action E Assess the performance of a business from both a financial and non-financial viewpoint, appreciating the
problems of controlling divisionalised businesses and the importance of allowing for external aspects.
Relational Diagram of Main Capabilities
Rationale
The syllabus for Paper F5, Performance Management, builds on the knowledge gained in Paper F2, Management Accounting. It also prepares candidates for more specialist capabilities which are covered in P5 Advanced Performance Management.
The syllabus begins by introducing more specialised management accounting topics. There is some knowledge assumed from Paper F2 – primarily overhead treatments. The objective here is to ensure candidates have a broader background in management accounting techniques.
The syllabus then considers decision-making. Candidates need to appreciate the problems surrounding scarce resource, pricing and make-or-buy decisions, and how this relates to the assessment of performance. Risk and uncertainty are a factor of real-life decisions and candidates need to understand risk and be able to apply some basic methods to help resolve the risks inherent in decision-making.
Budgeting is an important aspect of many accountants’ lives. The syllabus explores different budgeting techniques and the problems inherent in them. The behavioural aspects of budgeting are important for accountants to understand, and the syllabus includes consideration of the way individuals react to a budget.
Performance measurement and control (E) Specialist cost and
management accounting techniques (A)
Decision-making techniques (B)
Budgeting (C)
Standard costing and variance analysis (D)
SYLLABUS AND STUDY GUIDE
Standard costing and variances are then built on. All the variances examined in Paper F2 are examinable here. The new topics are mix and yield variances, and planning and operational variances. Again, the link is made to performance management. It is important for accountants to be able to interpret the numbers that they calculate and ask what they mean in the context of performance.
The syllabus concludes with performance measurement and control. This is a major area of the syllabus. Accountants need to understand how a business should be managed and controlled. They should appreciate the importance of both financial and non-financial performance measures in management. Accountants should also appreciate the difficulties in assessing performance in divisionalised businesses and the problems caused by failing to consider external influences on performance. This section leads directly to Paper P5.
Detailed Syllabus
A SPECIALIST COST AND MANAGEMENT ACCOUNTING TECHNIQUES 1. Activity-based costing
2. Target costing 3. Life-cycle costing 4. Back-flush accounting 5. Throughput accounting
B DECISION-MAKING TECHNIQUES
1. Multi-limiting factors and the use of linear programming and shadow pricing 2. Pricing decisions
3. Make-or-buy and other short-term decisions 4. Dealing with risk and uncertainty in decision- making
C BUDGETING
1. Objectives 2. Budgetary systems 3. Types of budget
4. Quantitative analysis in budgeting 5. Behavioural aspects of budgeting
D STANDARD COSTING AND VARIANCES ANALYSIS 1. Budgeting and standard costing
2. Basic variances and operating statements 3. Material mix and yield variances
4. Planning and operational variances 5. Behavioural aspects of standard costing
E PERFORMANCE MEASUREMENT AND CONTROL 1. The scope of performance measurement
2. Divisional performance and transfer pricing
3. Performance analysis in not-for-profit organisations and the public sector 4. External considerations and behavioural aspects
PERFORMANCE MANAGEMENT
Approach to Examining the Syllabus
Paper F5,Performance Management, seeks to examine candidates’ understanding of how to manage the performance of a business.
The paper builds on the knowledge acquired in Paper F2,Management Accounting, and prepares those candidates who choose to study Paper P5,Advanced Performance Management, at the Professional level
The syllabus is assessed by a three-hour paper-based examination.
The examination will contain five compulsory 20-mark questions. There will be calculation and discursive elements to the paper with the balance being broadly in line with the pilot paper. The pilot paper contains questions from four of the five syllabus sections. Generally, the paper will seek to draw questions from as many of the syllabus sections as possible.
SYLLABUS AND STUDY GUIDE
STUDY GUIDE
A
Specialist Cost and Management Accounting Techniques
1. ACTIVITY BASED COSTING
a) Identify appropriate cost drivers under ABC. [1] b) Calculate costs per driver and per unit using ABC. [2]
c) Compare ABC and traditional methods of overhead absorption based on production units, labour hours or machine hours. [2]
d) Explain the implications of switching to ABC for pricing, sales strategy, performance management and decision-making. [2]
2. TARGET COSTING
a) Derive a target cost in manufacturing and service industries. [2] b) Explain the difficulties of using target costing in service industries. [2]
c) Explain the implications of using target costing on pricing, cost control and performance management. [2] d) Suggest how a target cost gap might be closed. [2]
3. LIFE-CYCLE COSTING
a) Identify the costs involved at different stages of the life-cycle.[2]
b) Explain the implications of lifecycle costing on pricing, performance management and decision-making.[2]
4. BACK-FLUSH ACCOUNTING
a) Describe the process of back-flush accounting and contrast with traditional process accounting. [2] b) Explain the implications of back-flush accounting on performance management and the control of a
manufacturing process. [2]
c) Identify the benefits of introducing back- flush accounting. [2]
d) Evaluate the decision to switch to back-flush accounting from traditional process control. [3]
5. THROUGHPUT ACCOUNTING
a) Calculate and interpret a throughput accounting ratio (TPAR). [2] b) Suggest how a TPAR could be improved. [2]
c) Apply throughput accounting to a multi-product decision-making problem. [2]
B
Decision-Making Techniques
1. MULTI-LIMITING FACTORS AND THE USE OF LINEAR PROGRAMMING AND SHADOW PRICING a) Select an appropriate technique in a scarce resource situation. [2]
b) Formulate and solve a multiple scarce resource problem both graphically and using simultaneous equations as appropriate. [2]
c) Explain and calculate shadow prices (dual prices) and discuss their implications on decision-making and performance management. [2]
d) Calculate slack and explain the implications of the existence of slack for decision-making and performance management. [2]
(Excluding simplex and sensitivity to changes in objective functions)
PERFORMANCE MANAGEMENT
2. PRICING DECISIONS
a) Explain the factors that influence the pricing of a product or service. [2] b) Explain the price elasticity of demand. [1]
c) Derive and manipulate a straight line demand equation. Derive an equation for the total cost function (including volume-based discounts). [2]
d) Evaluate a decision to increase production and sales levels, considering incremental costs, incremental revenues and other factors. [2]
e) Explain different price strategies, including: [2] i) All forms of cost-plus
ii) Skimming iii) Penetration
iv) Complementary product v) Product-line
vi) Volume discounting vii) Discrimination viii) Relevant cost
f) Calculate a price from a given strategy using cost-plus and relevant cost. [2]
3. MAKE-OR-BUY AND OTHER SHORT-TERM DECISIONS
a) Explain the issues surrounding make vs. buy and outsourcing decisions. [2] b) Calculate and compare “make” costs with “buy-in” costs. [2]
c) Compare in-house costs and outsource costs of completing tasks and consider other issues surrounding this decision. [2]
d) Apply relevant costing principles in situations involving shut down, one-off contracts and the further processing of joint products. [2]
4. DEALING WITH RISK AND UNCERTAINTY IN DECISION-MAKING
a) Suggest research techniques to reduce uncertainty e.g. Focus groups, market research .[2] b) Explain the use of simulation, expected values and sensitivity. [1]
c) Apply expected values and sensitivity to decision-making problems. [2]
d) Apply the techniques of maximax, maximin, and minimax regret to decision-making problems including the production of profit tables. [2]
(Excluding decision trees and the value of perfect information)
C
Budgeting
1. OBJECTIVES
a) Outline the objectives of a budgetary control system. [2]
b) Explain how corporate and divisional objectives may differ and can be reconciled. [2] c) Identify and resolve conflicting objectives and explain implications. [2]
SYLLABUS AND STUDY GUIDE
2. BUDGETARY SYSTEMS
a) Explain how budgetary systems fit within the performance hierarchy. [2]
b) Select and explain appropriate budgetary systems for an organisation, including top-down, bottom-up, rolling, zero-base, activity- base, incremental and feed-forward control. [2]
c) Describe the information used in budget systems and the sources of the information needed. [2] d) Explain the difficulties of changing a budgetary system. [2]
e) Explain how budget systems can deal with uncertainty in the environment. [2]
3. TYPES OF BUDGET
a) Indicate the usefulness and problems with different budget types (zero-base, activity- based, incremental, master, functional and flexible). [2]
b) Explain the difficulties of changing the type of budget used. [2]
4. QUANTITATIVE ANALYSIS IN BUDGETING
a) Analyse fixed and variable cost elements from total cost data using high/low and regression methods. [2] b) Explain the use of forecasting techniques, including time series, simple average growth models and estimates
based on judgement and experience. Predict a future value from provided time series analysis data using both additive and proportional data. [2]
c) Estimate the learning effect and apply the learning curve to a budgetary problem, including calculations on steady states [2]
d) Discuss the reservations with the learning curve. [2]
e) Apply expected values and explain the problems and benefits. [2]
f) Explain the benefits and dangers inherent in using spreadsheets in budgeting. [1]
5. BEHAVIOURAL ASPECTS OF BUDGETING a) Identify the factors which influence behaviour. [2]
b) Discuss the issues surrounding setting the difficulty level for a budget. [2]
c) Explain the benefits and difficulties of the participation of employees in the negotiation of targets. [2]
D
Standard Costing and Variances Analysis
1. BUDGETING AND STANDARD COSTING a) Explain the use of standard costs. [2]
b) Outline the methods used to derive standard costs and discuss the different types of cost possible. [2] c) Explain the importance of flexing budgets in performance management. [2]
d) Prepare budgets and standards that allow for waste and idle time. [2]
e) Explain and apply the principle of controllability in the performance management system. [2] f) Prepare a flexed budget and comment on its usefulness. [2]
2. BASIC VARIANCES AND OPERATING STATEMENTS
a) Calculate, identify the cause of and interpret basic variances: [1] i) Sales price and volume
ii) Materials total, price and usage iii) Labour total, rate and efficiency
PERFORMANCE MANAGEMENT
iv) Variable overhead total, expenditure and efficiency
v) Fixed overhead total, expenditure and, where appropriate, volume, capacity and efficiency.
b) Explain the effect on labour variances where the learning curve has been used in the budget process. [2] c) Produce full operating statements in both a marginal cost and full absorption costing environment, reconciling
actual profit to budgeted profit. [2]
d) Calculate the effect of idle time and waste on variances including where idle time has been budgeted for. [2] e) Explain the possible causes of idle time and waste and suggest methods of control. [2]
f) Calculate, using a simple situation,ABC-based variances. [3]
g) Explain the different methods available for deciding whether or not too investigate a variance cause. [2]
3. MATERIAL MIX AND YIELD VARIANCES
a) Calculate, identify the cause of, and explain mix and yield variances. [2]
b) Explain the wider issues involved in changing mix e.g. cost, quality and performance measurement issues. [2] c) Identify and explain the interrelationship between price, mix and yield. [2]
d) Suggest and justify alternative methods of controlling production processes. [2]
4. PLANNING AND OPERATIONAL VARIANCES a) Calculate a revised budget. [2]
b) Identify and explain those factors that could and could not be allowed to revise an original budget. [2] c) Calculate planning and operational variances for sales, including market size and market share materials and
labour. [2]
d) Explain and the manipulation issues in revising budgets. [2]
5. BEHAVIOURAL ASPECTS OF STANDARD COSTING
a) Describe the dysfunctional nature of some variances in the modern environment of JIT and TQM. [2] b) Discuss the behavioural problems resulting from using standard costs in rapidly changing environments. [2] c) Discuss the effect that variances have on staff motivation and action. [2]
E
Performance Measurement and Control
1. THE SCOPE OF PERFORMANCE MEASUREMENT
a) Describe, calculate and interpret financial performance indicators (FPIs) for profitability, liquidity and risk in both manufacturing and service businesses. Suggest methods to improve these measures. [2]
b) Describe, calculate and interpret non-financial performance indicators (NFPIs) and suggest method to improve the performance indicated. [2]
c) Explain the causes and problems created by short-termism and financial manipulation of results and suggest methods to encourage a long term view. [2]
d) Explain and interpret the Balanced Scorecard, and the Building Block model proposed by Fitzgerald and Moon. [2]
e) Discuss the difficulties of target setting in qualitative areas. [2]
2. DIVISIONAL PERFORMANCE AND TRANSFER PRICING
a) Explain the basis for setting a transfer price using variable cost, full cost and the principles behind allowing for intermediate markets. [2]
b) Explain how transfer prices can distort the performance assessment of divisions and decisions made. [2]
SYLLABUS AND STUDY GUIDE
c) Explain the meaning of, and calculate, Return on Investment (ROI) and Residual Income (RI), and discuss their shortcomings. [2]
d) Compare divisional performance and recognise the problems of doing so. [2]
3. PERFORMANCE ANALYSIS IN NOT FOR PROFIT ORGANISATIONS AND THE PUBLIC SECTOR a) Comment on the problems of having non- quantifiable objectives in performance management. [2] b) Explain how performance could be measured in this sector. [2]
c) Comment on the problems of having multiple objectives in this sector. [2] d) Outline Value for Money (VFM) as a public sector objective. [1]
4. EXTERNAL CONSIDERATIONS AND BEHAVIOURAL ASPECTS
a) Explain the need to allow for external considerations in performance management, including stakeholders, market conditions and allowance for competitors. [2]
b) Suggest ways in which external considerations could be allowed for in performance management. [2] c) Interpret performance in the light of external considerations. [2]
d) Identify and explain the behaviour aspects of performance management. [2]
Reading List
Additional reading:
C. Drury, 2004.Management and Cost Accounting(6th edition),Thomson. ISBN 1861525362
C.T. Horngren,A. Bhimani, S.M Datar and G. Foster, 2005.Management and Cost Accounting(3rd Edition), FT Prentice-Hall. ISBN
C. Emmanuel, D Otley,Accounting for Management Control, Chapman and Hall, ISBN 186152218
Wider reading, including relevant articles in ACCA’sStudent Accountant, and other management accounting journals is encouraged.
PERFORMANCE MANAGEMENT
PERFORMANCE MANAGEMENT
Please note that the Pilot Paper is the original ACCA document and is
for guidance only. It has not been updated for any subsequent changes
in laws and regulations, so some technical details may have changed
since the original pilot paper was issued. For up-to-date exam questions
and answers, please see the relevant Revision Kit.
Fundamentals Pilot Paper – Skills module
The Association of Chartered Certified Accountants
Performance
Management
Time allowed
Reading and planning: 15 minutes
Writing: 3 hours
ALL FOUR questions are compulsory and MUST be attempted.
Do NOT open this paper until instructed by the supervisor.
During reading and planning time only the question paper may be annotated. You must NOT write in your answer booklet until instructed by the supervisor.
This question paper must not be removed from the examination hall.
Pa
pe
r
F5
PERFORMANCE MANAGEMENT
PILOT PAPER
29 Answer ALL FOUR questions
1 Triple Limited makes three types of gold watch – the Diva (D), the Classic (C) and the Poser (P). A traditional product costing system is used at present; although an activity based costing (ABC) system is being considered. Details of the three products for a typical period are:
Hours per unit Materials Production
Labour hours Machine hours Cost per unit ($) Units
Product D ½ 1½ 20 1,750
Product C 1½ 1 12 1,250
Product P 1 3 25 7,000
Direct labour costs $6 per hour and production overheads are absorbed on a machine hour basis. The overhead absorption rate for the period is $28 per machine hour.
Required:
(a) Calculate the cost per unit for each product using traditional methods, absorbing
overheads on the basis of machine hours. (3 marks)
Total production overheads are $654,500 and further analysis shows that the total production overheads can be divided as follows:
%
Costs relating to set-ups 35 Costs relating to machinery 20 Costs relating to materials handling 15 Costs relating to inspection 30 Total production overhead 100
The following total activity volumes are associated with each product line for the period as a whole:
Number of Number of movements Number of
Set ups of materials inspections
Product D 175 112 1,150
Product C 115 121 1,180
Product P 480 187 1,670
670 120 1,000
Required:
(b) Calculate the cost per unit for each product using ABC principles (work to two decimal
places). (12 marks)
(c) Explain why costs per unit calculated under ABC are often very different to costs per unit calculated under more traditional methods. Use the information from Triple Limited
to illustrate. (4 marks)
PERFORMANCE MANAGEMENT
2 Simply Soup Limited manufactures and sells soups in a JIT environment. Soup is made in a manufacturing process by mixing liquidised vegetables, melted butter and stock (stock in this context is a liquid used in making soups). They operate a standard costing and variances system to control its manufacturing processes. At the beginning of the current financial year they employed a new production manager to oversee the manufacturing process and to work alongside the purchasing manager. The production manager will be rewarded by a salary and a bonus based on the directly attributable variances involved in the manufacturing process
After three months of work there is doubt about the performance of the new production manager. On the one hand, the cost variances look on the whole favourable, but the sales director has indicated that sales are significantly down and the overall profitability is decreasing.
The table below shows the variance analysis results for the first three months of the manager’s work.
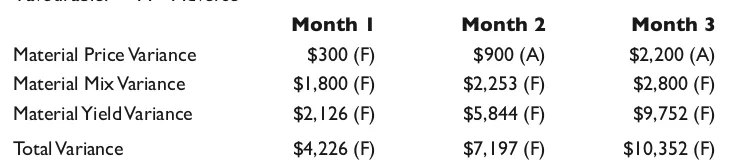
Table 1
F = Favourable. A = Adverse
Month 1 Month 2 Month 3
Material Price Variance $300 (F) $900 (A) $2,200 (A) Material Mix Variance $1,800 (F) $2,253 (F) $2,800 (F) Material Yield Variance $2,126 (F) $5,844 (F) $9,752 (F) Total Variance $4,226 (F) $7,197 (F) $10,352 (F)
The actual level of activity was broadly the same in each month and the standard monthly material total cost was approximately $145,000.
The standard cost card is as follows for the period under review
$
0.90 litres of liquidised vegetables @ $0.80/ltr = 0.72 0.05 litres of melted butter @$4/ltr 0.20 1.10 litres of stock @ $0.50/ltr 0.55 Total cost to produce 1 litre of soup 1.47
Required:
(a) Using the information in table 1:
(i) Explain the meaning of each type of variances above (price, mix and yield but excluding the total variance) and briefly discuss to what extent each type of
variance is controllable by the production manager. (6 marks)
(ii) Evaluate the performance of the production manager considering both the cost variance results above and the sales director’s comments. (6 marks) (iii) Outline two suggestions how the performance management system might be
changed to better reflect the performance of the production manager. (4 marks)
(b) The board has asked that the variances be calculated for Month 4. In Month 4 the production department data is as follows:
Actual results for Month 4
Liquidised vegetables: Bought 82,000 litres costing $69,700 Melted butter: Bought 4,900 litres costing $21,070 Stock: Bought 122,000 litres costing $58,560 Actual production was 112,000 litres of soup
Required:
Calculate the material price, mix and yield variances for Month 4. You are not required to comment on the performance that the calculations imply. Round variances to the
nearest $. (9 marks)
(25 marks)
PILOT PAPER
3 BFG Limited is investigating the financial viability of a new product the S-pro. The S-pro is a short-life product for which a market has been identified at an agreed design specification. The product will only have a life of 12 months.
The following estimated information is available in respect of S-pro:
1. Sales should be 120,000 in the year in batches of 100 units. An average selling price of $1,050 per batch of 100 units is expected. All sales are for cash.
2. An 80% learning curve will apply for the first 700 batches after which a steady state production time will apply, with the labour time per batch after the first 700 batches being equal to the time for the 700th batch. The cost of the first batch was measured at $2,500. This was for 500 hours at $5 per hour.
3. Variable overhead is estimated at $2 per labour hour.
4. Direct material will be $500 per batch of S-pro for the first 200 batches produced. The second 200 batches will cost 90% of the cost per batch of the first 200 batches. All batches from then on will cost 90% of the batch cost for each of the second 200 batches. All purchases are made for cash
5. S-pro will require additional space to be rented.These directly attributable fixed costs will be $15,000 per month.
A target net cash flow of $130,000 is required in order for this project to be acceptable.
Note: The learning curve formula is given on the formulae sheet. At the learning rate of 0.8 (80%), the learning factor (b) is equal to -0.3219.
Required:
(a) Prepare detailed calculations to show whether product S-pro will provide the target net
cash flow. (12 marks)
(b) Calculate what length of time then second batch will take if the actual rate of learning is: (i) 80%;
(ii) 90%.
Explain which rate shows the faster learning. (5 marks)
(c) Suggest specific actions that BFG could take to improve the net cash flow calculated
above. (8 marks)
(25 marks)
PERFORMANCE MANAGEMENT
4 The following information relates to Preston Financial Services, an accounting practice. The business specialises in providing accounting and taxation work for dentists and doctors. In the main the clients are wealthy, self-employed and have an average age of 52.
The business was founded by and is wholly owned by Richard Preston, a dominant and aggressive sole practitioner. He feels that promotion of new products to his clients would be likely to upset the conservative nature of his dentists and doctors and, as a result, the business has been managed with similar products year on year. You have been provided with financial information relating to the practice in appendix 1. In appendix 2, you have been provided with non-financial information which is based on the balanced scorecard format.
Appendix 1: Financial information
Current year Previous year
Turnover ($’000) 945 900
Net profit ($’000) 187 180
Average cash balances ($’000) 21 20
Average debtor/trade receivables days (industry average 30 days) 18 days 22 days
Inflation rate (%) 3 3
Appendix 2: Balanced Scorecard (extract) Internal Business Processes
Current year Previous year
Error rates in jobs done 16% 10%
Average job completion time 7 weeks 10 weeks
Customer Knowledge
Current year Previous year
Number of customers 1220 1500
Average fee levels ($) 775 600
Market Share 14% 20%
Learning and Growth
Current year Previous year
Percentage of revenue from non-core work 4% 5%
Industry average of the proportion of revenue from
non-core work in accounting practices 30% 25%
Employee retention rate. 60% 80%
Notes
1. Error rates measure the number of jobs with mistakes made by staff as a proportion of the number of clients serviced
2. Core work is defined as being accountancy and taxation. Non-core work is defined primarily as pension advice and business consultancy. Non core work is traditionally high margin work
Required:
(a) Using the information in appendix 1 only, comment on the financial performance of the business (briefly consider growth, profitability, liquidity and credit management).
(8 marks)
(b) Explain why non financial information, such as the type shown in appendix 2, is likely to give a better indication of the likely future success of the business than the financial
information given in appendix 1. (5 marks)
(c) Using the data given in appendix 2 comment on the performance of the business. Include comments on internal business processes, customer knowledge and learning/ growth, separately, and provide a concluding comment on the overall performance of
the business. (12 marks)
(25 marks)
End of Question Paper
PILOT PAPER
1 TRIPLE Limited
(a) Traditional cost per unit
D C P
$ $ $
Material 20 12 25
Labour ($6/hour) 3 9 6
Direct costs 23 21 31
Production overhead
($28/machine hour) 42 28 84
Total production cost /unit 65 49 115 (b) ABC cost per unit
Examiners note: Each step required has been given its own sub-heading to make the procedure clear. The basic principle is to find an overhead cost per unit of activity for each element of overhead cost. In some cases it might then be possible to find an overhead cost per unit directly; here it is probably easier to split overheads between each product type first and then find a cost per unit as shown.
(i) Total overheads These were given at $654,500
(ii) Total machine hours (needed as the driver for machining overhead)
Product Hours/unit Production units Total hours
D 1½ 1,750 21,125
C 1 1,250 21,250
P 3 7,000 21,000
Total machine hours 23,375
(iii) Analysis of total overheads and cost per unit of activity
Type of overhead Driver % Total Level of Cost/
overhead activity driver
$ activity
Set-ups Number of set ups 35 229,075 670 341.90
Machining Machine hours 20 130,900 23,375 5.60
Materials handling Material movements 15 98,175 120 818.13 Inspection Number of inspections 30 196,350 1,000 196.35
100 654,500
33
PERFORMANCE MANAGEMENT
(iv) Total overheads by product and per unit
Product D Product C Product P Total
Overhead Activity $ Cost Activity $ Cost Activity $ Cost Activity $ Cost
Set-ups 75 25,643 115 39,319 480 164,113 670 229,075
Machining 1,125 6,300 1,250 7,000 21,000 117,600 23,375 130,900 Material Handling 12 9,817 21 17,181 87 71,177 120 98, 175 Inspection 150 29,453 180 35,343 670 131,554 1,000 196,350
Total overhead cost 77,213 98,843 484,444 654,500
Units produced 750 1,250 7,000
Costs per unit $94.95 $79.07 $69.21
(v) Cost per unit
D C P
$ $ $
Direct costs (from (a)) 23.00 21.00 31.00 Overheads (from (iv)) 94.95 79.07 69.21 117.95 100.07 100.21
(c) Comment
The overhead costs per unit are summarised below together with volume of production.
Product D C P
Volume 750 1,250 7,000
Conventional overheads $42 $28 $84
ABC overheads $95 $79 $69
The result of the change to Activity Based Costing is clear, the overhead cost of D and C have risen whilst that of P has fallen.
This is in line with the comments of many who feel that ABC provides a fairer unit cost better reflecting the effort required to make different products. This is illustrated here with product P which may take longer to make than D or C, but once production has started the process is simple to administer. This may be due to having much longer production lines.
Products D and C are relatively minor volume products but still require a fair amount of administrative time by the production department; ie they involve a fair amount of ‘hassle’. This is explained by the following table of ‘activities per 1,000 units produced’.
Set-ups Materials Inspections movements
D 100 16 200
C 92 17 144
P 69 12 96
This table highlights the problem.
– Product P has fewer set-ups, material movements and inspections per 1,000 units than or C – As a consequence product P’s overhead cost per unit for these three elements has fallen
– The machining overhead cost per unit for P is still two or three times greater than for products D or C, but because this overhead only accounts for 20% of the total overhead this has a small effect on total cost. – The overall result is P’s fall in production overhead cost per unit and the rise in those figures for D and C
PILOT PAPER
(d) Pricing and Profitability
Switching to ABC can, as in this case, substantially change the costs per unit calculations. Consequently if an organisation’s selling prices are determined by a version of cost-plus pricing then the selling prices would alter. In this case the selling price of D and C would rise significantly, and the selling price of P would fall. This, at first glance may be appealing however:
– Will the markets for D and C tolerate a price rise? There could be competition to consider. Will customers be willing to pay more for a product simply because Triple Ltd has changed its cost allocation methods? – Product P is a high volume product. Reducing its selling price will have a dramatic effect on revenue and
contribution.
One would have to question whether such a reduction would be compensated for by increased volumes. Alternatively, one could take the view that prices are determined by the market and therefore if Triple Ltd switches to ABC, it is not the price that would change but the profit or margin per unit that would change. This can change attitudes within the business. Previously high margin products (under a traditional overhead absorption system) would be shown as less profitable. Salesmen (possibly profit motivated) can begin to push the sales of different products seeking higher personal rewards. (Assuming commission based on profits per unit sold)
It must always be remembered that if overheads are essentially fixed then they should be ignored in business decision making.
Switching to ABC can change reported profits per unit but it is contribution per unit that is perhaps more im-portant.
2 (a) SIMPLY SOUP Limited
(i) Meaning and Controllability of the variances
Material Price Variance
Indicates whether Simply Soup has paid more (adverse) or less (favourable) for its input materials than the standard prices set for the period. For example, if a new supplier had to be found and the price paid was more than the standard price then Simply Soup would incur an extra cost. This extra cost is the price variance.
Price variances are controllable to the extent that Simply Soup can choose its suppliers. On the other hand, vegetables are a seasonal and weather dependent crop and therefore factors outside Simply Soups control can influence prices in the market. The key issue is that the production manager will not control the price paid that is the job of the Purchasing Manager.
Material Mix Variance
Considers the cost of a change in the mix of the ingredients to make soup. For example adding less butter (which is expensive) and more stock (which is cheaper) will be a cheaper mix than the standard mix. A cheaper mix will result in a favourable variance.
The recipe determines the mix. The recipe is entirely under the control of the production manager.
Material Yield Variance
This shows the productivity of the manufacturing process. If the process produces more soup than expected then the yield will be good (favourable). At the moment 2.05 litres of input produces 1 litre of soup, if 2.05 litres of input produces more than 1 litre of soup then the yield is favourable. Greater yield than expected can be a result of operational efficiency or a change in mix.
The production manager controls the operational process so should be able to control the yield. Poor quality ingredients can damage yield but the production manager should be in control of quality and reject dubious ingredients. The production manager is also responsible for things like spillage. Higher spillage can also reduce yield.
PERFORMANCE MANAGEMENT
(ii) Production manager’s performance
Cost Efficiency
The production manager has produced significant favourable cost variances. The total favourable variance has risen from $4,226 to $10,352 in the first three months. This last figure represents approximately 7.1% of the standard monthly spend.
The prices for materials have been rising but are probably outside the control of the production manager. The rising prices may have put pressure on the production manager to cheapen the mix.
The mix has become cheaper. This could be seen as a cost efficient step. However, Simply Soup must question the quality implications of this (see later).
The yield results are the most significant. The manager is getting far more out of the process than is usual. The new mix is clearly far more productive than before. This could easily be seen as an indicator of good performance as long as the quality is maintained.
Quality
The concern is that the production manager has sacrificed quality for lower cost and greater quantity. The sales director has indicated that sales are falling, perhaps an indication that the customers are unhappy with the product when compared to competitor offers. The greater yield and cheaper mix may well have produced a tasteless soup.
Overall
Overall there has to be concern about the production manager’s performance. Cost control and efficiency are important but not at the expense of customer satisfaction and quality. We do not have figures for the extent to which sales have been damaged and small reductions may be acceptable.
(iii) Changes to the performance management system
The performance management system needs to take account of the quality of the soup being produced and the overall impact a decision has on the business.
Quality targets need to be agreed with the manager. These are difficult to quantify but not impossible. For example soup consistency (thickness) is measurable. Regular tasting will indicate a fall in quality; tasters could give the soup a mark out of 10 on taste, colour, smell etc.
The production manager should not be rewarded for producing lots of cheap soup that cannot be sold. The performance management system should reflect the overall effect that decisions have. If the production manager’s actions have reduced sales then sales volume variances should be allocated to the production manager as part of the performance assessment.
(b) Variance calculations
Material Price Variance
Mixed Vegetables: – 0.80 x 82,000 = $4,100 (A)
Butter: – 4 x 4,900 = $1,470 (A)
Stock: – 0.50 x 122,000 = $2,440 (F) $69,700 82,000 $21,070 4,900 $58,560 122,000
PILOT PAPER
Material Mix Variance
Mixed Vegetables: (82,000 – 91,712.2*) x 0.80 = $7,770 (F) Butter: (4,900 – 5,095.1) x 4 = $780 (F) Stock: (122,000 – 112,092.7) x 0.50 = $4,954 (A)
Total Mix Variance = $3,596 (F)
Note: it is only the total mix variance that is a valid variance here Total input volume = (82,000 + 4,900 + 122,000) = 208,900 * Standard mix for mixed vegetables is = $91,712.2
Note: alternate approaches are acceptable.
Material Yield Variance
[112,000 – 101,902.4] x 1.47 = $14,843(F)
The standard inputs add up to 2.05 units (0.9+0.5+1.1). This produces 1ltr of soup. The actual inputs were 208,900 litres and therefore the standard expected output should be
1
208,900 = 101,902.4 litres 2.05
3 BFG Limited
(a) Sales 120,000 units
Sales Revenue $1,260,000 Costs:
Direct materials (W1) $514,000 Direct Labour (W2) $315,423 Variable overhead $126,169
Rent $180,000
Net cash flow $124,408
Target cash flow $130,000 The target cash flow will not be achieved Workings:
(1) Direct material: Batches
$ First 200 @ $500 100,000 Second 200 @$450 90,000 Remaining 800 @$405 324,000
Total 514,000
(2) Direct labour
For first seven hundred batches y = axb
y = 2,500 x 700– 0.3219
y = $303.461045
Total cost for first 700 batches = $303.461045 x 700 = $212,423
All batches after the first 700 will have the same cost as the 700th batch. To calculate the cost of the 700th batch we need to take the cost of 699 batches from the cost of 700 batches.
PERFORMANCE MANAGEMENT
For 699 batches y = a x b
y = 2,500 x 699– 0.3219
y = $303.600726
Total cost for first 699 batches = $303.600726 x 699 = $212,217 Cost of 700th batch is $212,423 - $212,217 = $206
Total cost for the 12 months of production $212,423 + ($206 x 500) = $315,423
(3) Variable overhead is $2 per hour or 40% of direct labour
(b) To calculate the learning factor BFG will have had to measure the time taken to make the first batch (500 hours) and then the time taken to make the second batch. The learning rate measures the relationship between the average time taken between two points as production doubles. The easiest way to measure the learning rate is when the production doubles between the first and second batches.
At 80%
Time for first batch 500
Average time for two batches @80% 500 x 0.8 = 400 Total time for two batches 2 x 400 = 800 Time for second batch 800 – 500 = 300 At 90%
Time for first batch 500
Average time for two batches @90% 500 x 0.9 = 450 Total time for two batches 2 x 450 = 900 Time for second batch 900 – 500 = 400
The 80% learning rate reduces the time taken for the two successive batches above by a greater amount (or faster). Hence the 80% learning rate is the faster learning.
(c) Possible actions to improve the net cash flows are:
– Increase the price charged. The question states that an agreed specification has been reached, however further research may reveal that a higher price could be tolerated by the market. Equally a form of price skimming may be possible to improve short term net cash flow.
– Reduce the labour cost per batch by removing unnecessary operations or processes. It may be possible to simplify the design without damaging the ability to achieve the price stated.
– Improve the learning rate. This may involve improving the training or the quality of people involved in the production process. This does takes time and costs money in the short run.
– Consider substitute materials (without damaging the product specification). Also look for new suppliers to reduce the input cost.
– Consider ways to reduce the level of variable overhead incurred by the product.
– Investigate whether the production of product X could take place in existing space and hence avoid the extra rent charge. Re-negotiate the rent charge with the landlord.
PILOT PAPER
4 Preston Financial Services
(a) Financial analysis
There are various financial observations that can be made from the data.
– Turnover is up 5% – this is not very high but is at least higher than the rate of inflation indicating real growth. This is encouraging and a sign of a growing business.
– The main weakness identified in the financial results is that the net profit margin has fallen from 20% to 19.8% suggesting that cost control may be getting worse or fee levels are being competed away. – Profit is up 3.9%. In absolute terms profits are impressive given that Richard Preston is the sole partner
owning 100% of the business.
– Average cash balances are up 5% – indicating improved liquidity. Positive cash balances are always welcome in a business.
– Average debtors days are down by 3 days – indicating improved efficiency in chasing up outstanding debts. It is noticeable that Preston’s days are lower than the industry average indicating strong working capital management. The only possible concern may be that Richard is being particularly aggressive in chasing up outstanding debts.
Overall, with a possible concern about margins and low growth, the business looks in good shape and would appear to have a healthy future.
(b) Financial performance indicators will generally only give a measure of the past success of a business. There is no guarantee that a good past financial performance will lead to a good future financial performance. Clients may leave and costs may escalate turning past profits to losses in what can be a very short time period.
Non financial measures are often termed “indicators of future performance”. Good results in these measures can lead to a good financial performance. For example if a business delivers good quality to its customers then this could lead to more custom at higher prices in the future.
Specifically the information is appendix 2 relates to the non financial measures within the balanced scorecard. Internal business processes are a measure of internal efficiency. Interestingly these measures can indicate current cost efficiency as much as any future result.
Customer knowledge measure how well the business is dealing with its external customers. A good performance here is very likely to lead to more custom in the future.
Innovation and learning measures that way the business develops. New products would be reflected here along with indicators of staff retention. Again this is much more focused on the future than the present. Measuring performance by way of non-financial means is much more likely to give an indication of the future success of a business.
(c) The extra non-financial information gives much greater insight into key operational issues within the business and paints a bleaker picture for the future.
Internal business processes
Error rates
Error rates for jobs done are up from 10% to 16%, probably a result of reducing turnaround times to improve delivery on time percentages. This is critical as users expect the accounts to be correct. Errors could lead to problems for clients with the Inland Revenue, bankers, etc. What is worse, Richard could be sued if clients lose out because of such errors. One could say that errors are unlikely to be revealed to clients. Businesses rarely advertise mistakes that have been made. They should of course put mistakes right immediately.
PERFORMANCE MANAGEMENT
Customer Knowledge
Client retention
The number of clients has fallen dramatically – this is alarming and indicates a high level of customer dissatisfaction. In an accountancy practice one would normally expect a high level of repeat work – for example, tax computations will need to be done every year. Clearly existing clients are not happy with the service provided.
Average fees
It would appear that the increase in revenue is thus due to a large increase in average fees rather than extra clients – average fee is up from $600 to $775, an increase of 29%! This could explain the loss of clients in itself, however there could be other reasons.
Market share
The result of the above two factors is a fall in market share from 20% to 14%. Looking at revenue figures one can estimate the size of the market as having grown from $4.5m to $6.75m, an increase of 50%. Compared to this, Preston’s figures are particularly worrying. The firm should be doing much better and looks to being left behind by competitors.
Learning and Growth
Non-core services
The main weakness of the firm seems to be is its lack of non-core services offered. The industry average revenue from non-core work has increased from 25% to 30% but Richard’s figures have dropped from 5% to 4%. It would appear that most clients are looking for their accountants to provide a wider range of products but Richard is ignoring this trend.
Employee retention
Employee turnover is up indicating that the staff are dissatisfied. Continuity of staff at a client is important to ensure a quality product. Conservative clients may resent revealing personal financial details to a variety of different people each year. Staff turnover is possibly a result of extra pressure to complete jobs more quickly without the satisfaction of a job well done. Also staff may realise that the lack of range of services offered by the firm will limit their own experience and career paths.
Conclusion
In conclusion, the financial results do not show the full picture. The firm has fundamental weaknesses that need to be addressed if it is to grow into the future. At present it is being left behind by a changing industry and changing competition. It is vital that Richard reassesses his attitude and ensures that the firm has a better fit with its business environment.
In particular he should seek to develop complementary services and reduce errors on existing work.
PILOT PAPER
1 (a) For each product 1 mark
Total 3 marks
(b) Total machine hours 2 mark
Cost per driver calculation 3 marks
Overheads split by product table 4 marks
Cost per unit calculation 3 marks
Total 12 marks
(c) Explanation 4 marks
(d) Comment on pricing, markets, customers and profitability 6 marks
Total 25 marks
2 (a) For each variance
Explanation of meaning of variance 1 mark
Brief discussion of controllability 1 mark 6 marks (b) Comment on cost variance
Price:
Outside Production Managers Control 1 mark
Rising prices pressures 1 mark
Mix
Cheaper mix and comment 1 mark
Yield
High yield results and comment 1 mark
Quality
Comment on quality implications 1 mark
Overall summary 1 mark 6 marks
(c) Improvements to performance measurement system
For each sensible suggestion 2 marks 4 marks
(d) Variance calculations
Price: 1 mark for each ingredient 3 marks
Mix: 3 marks
Yield: 3 marks
Method marks should be awarded as appropriate 9 marks
Total 25 marks
41
PERFORMANCE MANAGEMENT
3 (a) Sales 1 marks
Direct material 2 marks
Direct labour first seven months 3 marks
last five months 3 marks
Variable overhead 1 marks
Rent 1 marks
Decision 1 marks
Total for part (a) 12 marks
(b) Second batch times 80% 2 marks
90% 2 marks
Comment on faster learning 1 marks
Total for part (b) 5 marks
(c) Actions to improve net cash flow
(2 marks per explained idea) 8 marks
Total for part (c)
Total 25 marks
4 (a) Financial commentary
Turnover growth 2 marks
Profitability 2 marks
Cash position 2 marks
Debtor management 2 marks
Total 8 marks
(b) Future performance
General explanation with example 2 marks
Comment on each area 3 marks
Total 5 marks
(c) Assessment of future prospects. Internal business processes
Error rates 3 marks
Not revealed to clients 1 marks
Customer Knowledge
Retention 1 marks
Fee levels 2 marks
Market share/size 1 marks
Learning and growth
Lack of product range 2 marks
Employee retention 2 marks
Total 12 marks
Total 25 marks
F5
Formulae
PERFORMANCE MANAGEMENT
FORMULAE SHEET
45 Learning curve
Y = axb
Where y = average cost per batch a = cost of first batch
x = total number of batches produced b = learning factor (log LR/log 2) LR = the learning rate as a decimal
Regression analysis
y = a+bx
b =
a = –
r =
Demand curve
P = a – bQ
b =
a = price when Q = 0 nΣxy –ΣxΣy
nΣx2-(Σx)2
Σy
n bΣx
n
nΣxy –ΣxΣy
√
nΣx2– (Σx)2)(nΣy2– (Σy)2)PERFORMANCE MANAGEMENT
1
Session 1
Parts 1 and 2
PERFORMANCE MANAGEMENT
SESSION 1 PARTS 1 AND 2 - ACTIVITY BASED COSTING (ABC)
49
1
Context
We have developed an understanding of the traditional techniques of absorption costing and marginal costing in our F2 studies. We will now develop these costing techniques to consider different industries and situations to which different costing techniques can be applied. This session will address the concept of Activity Based Costing (ABC).
ABC is a refined version of absorption costing, and attempts to find a more accurate method whereby overhead cost can be charged into cost units.
Traditional absorption costing techniques allocate and apportion overheads to large ‘cost centres’ (usually a department or machine) and then absorb these overheads en masse into cost units, usually at a pre-deter-mined hourly rate.
ABC focuses on how overheads can be more reasonably charged to cost units in a manner which reflects the cost units ‘usage’ of the specific overhead. This may lead to a business having multiple absorption rates using ABC, however these rates are likely to lead to a more accurate product costing.
Exam hints
It is important to be able to calculate how to absorb overheads using both traditional absorption techniques and ABC. However the examiner expects you to be able to understand and interpret your results and also the drawbacks of the techniques. This written understanding will inevitably have to be applied to the scenario in the question.
Key learning points
• Absorption costing apportions overheads between cost centres (commonly departments); • ABC allocates costs more accurately between cost pools reflecting different activities;
• Traditional absorption costing calculates a ‘blanket’ absorption rate for each cost centre, commonly:
• ABC calculates a rate per cost driver for each separate activity of: Total Cost Centre Overhead Cost Centre Direct Labour Hours
PERFORMANCE MANAGEMENT
SESSION 1 PARTS 1 AND 2 - ACTIVITY BASED COSTING (ABC)
51
1
Absorption Costing - revisited
In order to full understand Activity Based Costing (ABC), we need to remind ourselves about the principles of traditional absorption costing first of all.
ABSORPTION COSTING
We aim, when using absorption costing, to calculate a full cost per unit of production. Overhead costs are
indirectcosts which can not clearly be charged to individual units of production (for example factory rent and rates). Direct expenses such as materials or productive labour can clearly be ‘attached’ to each unit of production. For overheads we have to adopt a process to estimate an amount of overhead that w can charge to each cost unit.
Overheads were identified in total and then usually apportioned or shared between cost centres (usually departments such as assembly or finishing). For example factory rent and rates could be shared between cost centres on the basis of floor area (square metres).
Once accumulated in a cost centre the overheads could then be absorbed into cost units on an hourly basis – often either labour hours (if the cost centre is labour intensive) or machine hours (if the cost centre is capital or machine intensive).
Overhead Absorption Rate (OAR) =
The absorption costing per unit can then used to:
• Assess the costs incurred per unit for performance assessment (e.g. variance analysis); • Value inventory stock for financial accounting purposes;
• Calculate sales prices based on a cost-plus basis. PROBLEMS ASSOCIATED WITH ABSORPTION COSTING
There are problems for modern manufacturing businesses in using absorption costing methods. • Increased product complexity.
Modern manufacturers tend to produce a wide range of products at quite different volumes. There is a high risk that some products may be charged too much overhead and others too little. This in turn could lead to inappropriate pricing of products if the business pursues a cost plus pricing methodology.
• Increasing capital intensity of modern manufacturing techniques
Many modern manufacturers are highly machine intensive. This means that what little direct labour that is involved in the manufacture of units of production is a very small proportion of the overall costs involved. This can lead to extremely high absorption rates that bear little resemblance to the underlying overhead and how it is incurred.
Overhead Costs in Total
Apportionment of Overhead Absorption of Overhead- at a Rate per Hour Cost Centre
(Usually a Department) Cost Units
For example
Armstrong manufactures small hand held hammers and 12 metre containers used in the transportation of goods by road, rail and sea. It operates a highly mechanised production system. Overheads are calculated on a direct labour hour basis.
The following information is available for the manufacture of these products over a period.
Hand held hammers Containers
Direct material/unit $5 $300
Direct Labour/unit:
0.5 hours @ $20/hour: $10
2 hours @ $20/hour: $40
Prime cost/unit $15 $340
Budgeted Production (units) 20,000 1,000
Total Factory overhead $960,000
Required:
Calculate the amount of overhead to be absorbed into each product.
The business calculates sales price on a full cost plus 40% basis. Calculate the sales price of each product.
Solution
OAR = =$80/hour
The standard cost card for each product becomes:
Hand held hammers Containers
Direct material/unit $5 $300
Direct Labour/unit:
0.5 hours @ $20/hour: $10
2 hours @ $20/hour: $40
Prime cost/unit $15 $340
Overhead per unit:
0.5 hours x $80/hour $40
2 hours x $80/hour $160
Total Absorption Cost/unit $55 $500
The sales price of each product becomes:
Hand held hammers Containers
Absorption cost/unit $55 $500
+ 40% profit margin $22 $200
Sales Price $77 $700
PERFORMANCE MANAGEMENT
$960,000
(20,000 x 0.5 hours) + (1,000 x 2 hours)
SESSION 1 PARTS 1 AND 2 - ACTIVITY BASED COSTING (ABC)
53
1
It would appear very unreasonable indeed to expect to get such a high sales price for hand held hammers. The overhead of $40 charged to the product is some 73% of the overall product cost ($55).
Similarly it is likely that if the containers are sold for $700, this will be significantly below the market price. It also appears strange that for such a large and bulky product, only 32% of the product’s cost is made up of overhead. Each container appears relatively ‘cheap’ to make in overhead terms because of the relatively small amount of direct labour required to make it. The bulk of the productive input to make the container is machine overhead, yet the labour rate absorption rate does not recognise this.
Activity Based Costing (ABC)
ABC tackles the problems of absorption costing by adopting a much more accurate way of charging overhead to cost units.
In essence the business carefully considers what the primaryactivitiesare of the business. In making units of
production what does the business actually do to be able to make those units?
For example a business that bakes pizzas to then package them, freezes them and subsequently distributes them to supermarkets may undertake the following activities:
• Setting up ovens in order to bake