Download
PDF Copy DownloadBrochure SupplierView
Pro le (/Suppliers.aspx?SupplierID=2308)
Request Quote
Sponsored by PerkinElmer Inc. (/suppliers.aspx?SupplierID=2308) Jun 17 2016
Band Gap Measurements on Titanium Dioxide Powder Using
UV/Vis/NIR Spectroscopy
Table of Contents
IntroductionExperiment
Results and Discussion Calculations
Conclusion
Introduction
Measuring the band gap of materials is vital in the nanomaterial, semiconductor, and solar industries. This article illustrates how the band gap of a material can be established from its UV absorption spectrum (/ads/abmc.aspx?b=8324).
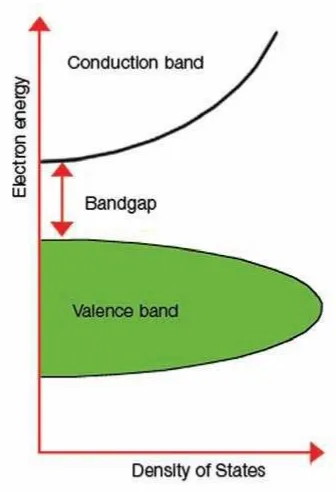
The term “band gap” (https://www.azonano.com/ads/abmc.aspx?b=8324) represents the energy variation between the bottom of the conduction band to the top of the valence band; electrons are capable of jumping from one band to another. For an electron to jump from a valence band to a conduction band, it needs a band gap energy - a speci c minimum quantity of energy for the transition.
Figure 1 illustrates an image of the band gap.
Figure 1. Explanation of band gap.
The measurement of the band gap is vital in the nanomaterial (/ads/abmc.aspx?b=8324) and semiconductor sectors. The insulators’ band gap energy is large (>4 eV); however, it is lower for semiconductors (<3 eV). A semiconductor’s band gap properties can be controlled with the aid of various semiconductor alloys such as InGaAs, GaAlAs, and InAlAs.
solar radiation that reaches the Earth’s surface. The solar cell absorbs these higher energies, but the di erence in energy is transformed into heat and not into functional electrical energy.
As a result, unless the band gap (/ads/abmc.aspx?b=8324) is regulated, the solar cell’s e ciency will be weak. One way to increase the solar cell e ciency is to use layers of varied materials with diverse band gap properties.
In the nanomaterial and semiconductor industries, titanium dioxide (TiO , usually referred to as titania) is added as a component to coatings. TiO (https://www.azonano.com/ads/abmc.aspx?b=8324) is believed to support the internal trapping of light by redirecting or scattering the light re ected from the metallic electrode in to the active layer, and to enhance the transport of charge carriers via the active layer.
Experiment
Many research studies on nanomaterials have been conducted using just a small quantity of the sample. Therefore, sampling becomes a major area of concern in this kind of analysis. A LAMBDA™ 1050 UV/Vis/NIR spectrometer
(https://www.azonano.com/ads/abmc.aspx?b=8324) in conjunction with 150 mm integrating sphere (PerkinElmer, Shelton, CT USA) was used to perform the analysis (Figure 2).
Figure 2. LAMBDA 1050 UV/Vis/NIR System with Integrating Sphere.
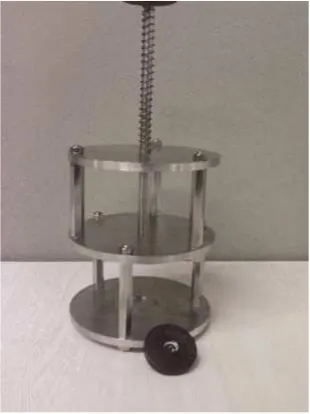
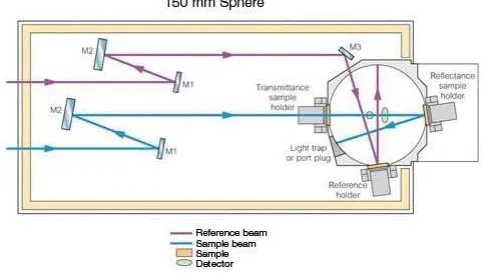
This holder (Prama Industries, Mumbai, India – Figure 3) containing a powder (https://www.azonano.com/ads/abmc.aspx?b=8324) sample is xed to the external port of the integrating sphere. A powder (https://www.azonano.com/ads/abmc.aspx?b=8324) sample press of low volume was utilized. Figure 4 shows the optical diagram of the integrating sphere, and Figure 5 shows 4 shows the UV WinLab™ software setup.
Figure 3. Powder sample press with sample holder.
2
Figure 4. 150-mm Integrating Sphere Optical diagram.
Figure 5. UV WinLab™ software setup.
The sample was run utilizing the parameters listed in Table 1.
Table 1. Instrumental parameters
Wavelength Range 250-800 nm
SBW 2 nm
Data Interval 1 nm
To reduce the specular re ection part, which can cause noise or fringes at the furthest end of the range, the entrance port of the integrating sphere was kept open.
The spectra were recorded in wavelength vs. absorbance and wavelength modes vs. % re ectance.
The bene t of utilizing a LAMBDA 1050 (https://www.azonano.com/ads/abmc.aspx?b=8324) was to have a second sample compartment where the integrating sphere could be placed without hindering the main sample compartment.
Results and Discussion
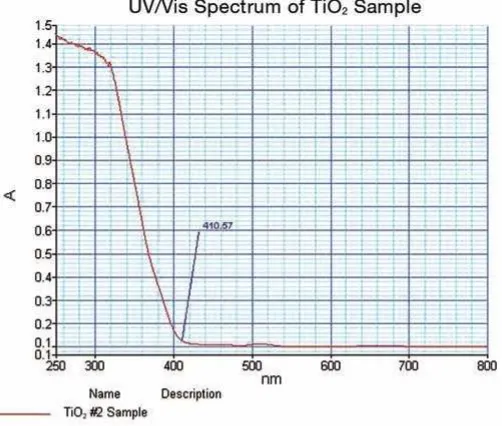
Figure 6. TiO UV/Vis spectrum obtained in this work.
The spectral data thus obtained illustrated the strong cut o at 410.57 nm; where the value of absorbance is minimum. The data is con rmed in the % re ectance mode.
Calculations
Conclusion
Band gap energy values for many powder (https://www.azonano.com/ads/abmc.aspx?b=8324) nanomaterials can be measured using similar type of experimental conditions and accessories. With this, it also becomes possible to determine the quality of TiO . (https://www.azonano.com/ads/abmc.aspx?b=8324) Several other semiconductor nanomaterials can also be subjected to the experiment, where the example spectra from literature are shown in Figure 7.
Figure 7. UV/Vis Absorption measurements for TiO -(X) ZnFe O nanocomposites, where X = Di erent molar concentration of ZnFe O . X = 0.01 (dark green), 0.05 (light green), 0.1 (chocolate), 0.15 (pink), 0.20 (orange). TiO Hydrolysis (blue), Pure TiO (violet).
The key bene ts of utilizing the speci cally designed small powder sample holder are: 2
2
2 2 4 2 4
Download
PDF Copy DownloadBrochure SupplierView
Pro le (/Suppliers.aspx?SupplierID=2308)
Request Quote
The sample quantity needed is 20-30 times less than the traditional powder sample holder Smaller quantity powder samples can be tested directly
Due to a uniquely designed hand press, powder becomes caked in the cup rmly and does not slip in to the sphere Cost-e ective sampling device with a diameter of 1 cm and a depth of 1.5 cm deep.
The press provides a uniform surface to the sample to perform re ectance experiments
Reduces the specular part of the re ection since the sample is being exposed directly to the beam
(https://www.azonano.com/ads/abmc.aspx?b=8324)
This information has been sourced, reviewed and adapted from materials provided by PerkinElmer Inc.
For more information on this source, please visit PerkinElmer Inc. (https://www.azonano.com/ads/abmc.aspx?b=8324)
Ask A Question
Do you have a question you'd like to ask regarding this article? Leave your feedback
Public Question Private Question to Supplier
Submit Login
Latest
interviews equipmentFeatured Trending stories
A Graphene FET (GFET) Ready for Immediate Functionalization (/article.aspx?ArticleID=4853) Richard White
(/article.aspx?ArticleID=4853)
How Piezo Controller Design In uences Thermal Stability (/article.aspx?ArticleID=4762) Brian O'Connor
(/article.aspx?ArticleID=4762)
Novel Nanomaterials for Improved Food Safety (/article.aspx?ArticleID=4752) Prof. Antje J. Baeumner
(/article.aspx?ArticleID=4752)
Other Sites from AZoNetwork
AZoM (https://www.azom.com/)
Become a Member (/azopro le/) Newsletters (/newsletters/) Contact (/contact.aspx) Help/FAQs (/faqs.aspx) Advertise (/advertise) Terms & Conditions (/terms) Privacy & Cookie Policy (/privacy) Update Your Privacy Preferences Sitemap (/sitemap.axd)
Become a Member (/azopro le/) Search...
By continuing to browse or by clicking "Accept All Cookies," you agree to the storing of rst and third-party cookies on your device to enhance site navigation, analyze site usage, and assist in our marketing e orts. Find out more (/privacy#cookies).
Cookie Settings Accept All Cookies