Hydration Status and Liver Function of Young Men
Before and After Ramadan Fasting
Nur Susan Iriyanti Ibrahim1*, Hardinsyah1, Budi Setiawan1
1Department of Community Nutrition, Faculty of Human Ecology, Bogor Agricultural University, Bogor 16680, Indonesia
ABSTRACT
The objective of this study was to identify and analyse the hydration status and liver function of young men before and during Ramadanfasting (RF). The study design was a prospective cohort into 1st period (one week before fasting) and 2nd period (the last ten days of fasting). The subjects were 18 healthy young men (19-30 years old). Data on dietary intake were collected using food record 3x24h, body composition were collected using bioelectrical impedance analyser (BIA), hydration status, and liver function data were measured trough urine and blood sample. This study showed significant differences in body weight, fat body mass, body mass index (BMI), body water, intake of energy, protein, fat, carbohydrate, and water, hydration status (serum osmolality and urine density), and liver function (SGOT and SGPT levels) before and during RF (p<0.05). There were significant correlation between fasting status and SGPT levels (p<0.05). The study concluded that Ramadan fasting has a positive effect to control body weight and improve liver function measured by SGOT and SGPT levels.
Keywords: hydration status, liver function, Ramadan fasting, young men
*Corresponding Author: Tel:+6281289491768, email: [email protected]
ISSN 1978-1059 EISSN 2407-0920
INTRODUCTION
More than 60% of the human body con-sists of water (Buyckx 2007). Water is an essen-tial nutrients which has an important function for physiological and biochemical metabolism. Water function as a transport substance, meta-bolic heat absorbent, blood volume circulation maintainer, and as a detoxification agent to re -move metabolic toxin in the body. Trial in animal studies have shown that the hydration status in the cell have a pivotal role in cell functions, hor-mones, oxidative stress, and nutrition which then can affect the metabolism and gen expressions. Long-term dehydration without proper treatment may trigger metabolism malfunctions manifest in the body biomarkers (Firmansyah 2015).
Water intake is influenced by many factors such as age, genetics, gender, thirst mechanism, water availability, and sociocultural as well as religious factors (Contento 2011). Ramadan is a holy month in which Muslims have to restrict eating and drinking during the fasting period from dawn to dusk (Alinezhad & Salehi 2016).
Mohamed et al. (2013) stated that Rama-dan fasting (RF) may modifies diet in many ways such as trough changes in the feeding frequency, selection of food type, food preparation, and eat-ing habits. There is a higher risk for dehydration for Muslims who conducted this RF due to the restriction for consumption of all types of foods and beverages (fluid) for about 12 hours (Trepa -nowski & Bloomer 2010).
The Indonesian Regional Hydration Re-search Study (THIRST) shows that even in
nor-mal conditions (not fasting), 44.5% of Indone-sian adult subjects (25-55 years old) from two different ecological region (highlands and low-lands) already suffered from mild dehydration (Gustam et al. 2012). Recent study on hydration status during RF conducted by Hardinsyah et al.
(2017b) has shown that the subjects only drank 2042.90±452.61 ml/day of total water, or 91% of their water requirement. This study also found that in late afternoon near the time of iftar, the body actually has the highest water requirement (Hardinsyah et al. 2017b).
34 J. Gizi Pangan,Volume 13, Number 1, March 2018 and liver function, and of hydration status to liver
function.
METHODS
Design, location, and time
The study design was a prospective, divi-ded into two periods, 1st period was one week be-fore RF and 2nd period was the last 10 days of RF. This study was conducted in Bogor Agricultural University (BAU) from May to July 2016. This study was a joint research of “Water Intake and Hydration Status of Adults Before and During Ramadan Fasting” chaired by Prof. Dr. Ir. Har-dinsyah, MS.
Materials and tools
Subjects chosen for the study were young male adult because they were more likely to fin -ish the RF (28-30 days) without any missed time due to menstruation women. They were young student of BAU. The inclusion criteria for this study were male, 19-30 years old, BMI 18.5-27 kg/m2, in healthy condition, non-smoker, willing to be a subject and fully participate in this study and willing to approve the informed consent. The exclusion criteria were subjects with a certain health conditions which can impede the commit-ment to finish the full RF.
Data collection
The primary data collected at each periods of the study were 1) dietary intake, collected using food record 3x24 hours; 2) nutrition status, mea-sured using CAMRY EB9003 for body weight and stature meter for body height, and bioelectri-cal impedance analyser (BIA) for body composi-tion; 3) hydration status, measured using serum osmolality and urine specific gravity (USG); 4) liver function, measured using level of SGOT, SGPT, albumin serum, and bilirubin urine. The ethical clearance letter for the study is issued by the Faculty of Medicine University of Indonesia (number of 440/UN2.F1/ETIK/2016).
Body weight and height measured twice or more until the measurement was consistent. While measurement of other data was only car-ried in once. Body height was measured only in 1st periods of this study with the assumption that no significant changes in height occurred between the 1st and 2nd period. The types of liver function biomarkers used in this study were 1) transport function of the organic substance test and drug metabolism using the bilirubin urine test, 2) cell or liver tissue damage test using SGOT (an en-zyme that found more in mitochondria and cyto-plasm) and SGPT levels test (an enzyme that only found in cytoplasm), and 3) biosynthesis function test using albumin serum test. Urine sample was collected in the day time (12.00-13.00) and in the afternoon (16.00-17.00). It was collected using
sealed glass bottle about 25-30 ml and then was analysed in BAU urine analysis laboratory using urine chemistry analyser (DUS R-300).
Blood sample was collected in the morning (08.00-10.00) at the 1st periods of this study and after iftar with drinking water at the 2nd periods of this study. Blood was drawn by trained medical personnel, about 5 ml using syringe then blood centrifuged to separate the plasma and serum.
Serum sample was put into the micro tube and cooler box with maximum temperature of 7oC, then it analysed at Amerind Bio-Clinic (ABC) Jakarta laboratory and laboratory clinic of PKU Muhammadiyah Bogor. Sample was ana-lysed using osmometer automatic to measure se-rum osmolality data. While Photometric UV-test was done for measuring the SGOT, SGPT, and albumin serum level.
Data Analysis
Data were processed using Microsoft Excel 2010 and analysed using SPSS 16.0 version. Dif-ference test between variables before and during RF was conducted using paired t-test and Wil-coxon. Regression test was done using multiple linear regression.
RESULTS AND DISCUSSION
Characteristic of subjects
Subjects were 18 men with the average age of 22.0±2.4 years old and all subjects were a BAU student (100%), 72.2% were undergraduate stu-dent and 27.8% were postgraduate stustu-dent. The average allowance were 1,240,000±1,060,000 (IDR) per month. 61.1% of subjects allocated more than 450,000 (IDR) for foods and 72.2% allocated less than 152,000 (IDR) for beverages per month.
Nutrition status, body composition, and nut-rition intake before and during Ramadan fast-ing
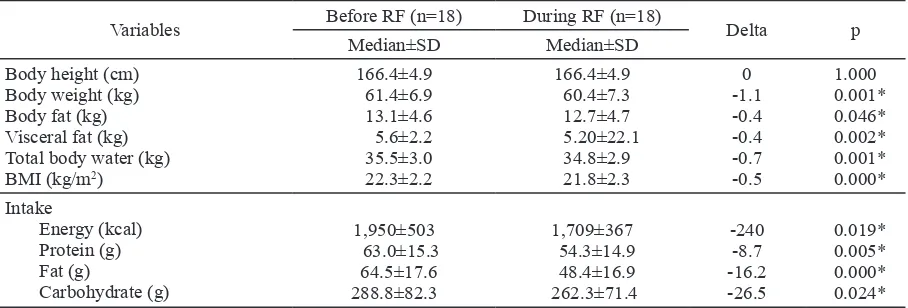
The result found that body weight, total body fat, visceral fat, total body water, and BMI during RF were significantly decreasing (p<0.05) (Table 1). This result was in line with study by Syam (2016). Decreasing of body weight was caused by decreasing of body water and body fat percentage during fasting. Reducing of body water caused by body water alteration during RF. These may increase risk of dehydration (Mazidi
et al. 2014).
during fat oxidation (Sinaiko 2007). Increase in fat oxidation occurs due to the decrease of nutri-tion intake during RF, refer to Table 1.
There is a significant decrease in nutrition intake (energy, protein, fat, and carbohydrate) during RF (p<0.05). Hardinsyah (2011) stated that in general the amount of calories which goes into the body was in limited amount during fast-ing. People only eat 75-80% from the daily ca-lorie intake, therefore after RF the body weight decrease in about 5-10%. Lower nutrition intake during RF happened because of the limited time to eat and choices of types of food. Study by Un-alacak et al. (2010) showed that restriction of nutrition intake was caused by the changing of eating pattern, from 3 times per day to 2 times per day, thus reduce the total energy intake.
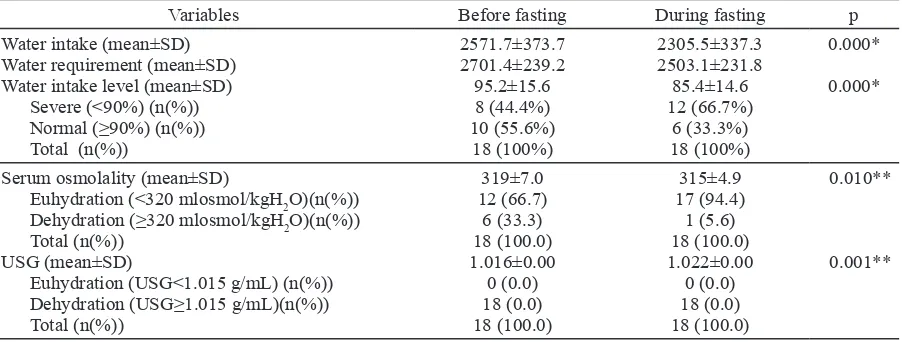
Water intake, water intake level, and hydra-tion status before and during Ramadan fasting There was a significant differences of water intake and water intake levels before and during RF (p<0.05) (Table 2). Most of the subjects have low water intake levels (<90%) during fasting. These caused by limitation of all types’ food and be-verages during fasting about more than 12 hours (Trepanowski & Bloomer 2010). Al-Arouj et al. (2010) recommended to increase water in-take during no fasting time and sahoor time. People should have enough drink at the end of sahoor, before fasting time and when iftar
time in order to prevent the risk of dehydration. Hydration status in this study was mea-sured using 2 methods, serum osmolality and USG which were gold standard measurements for hydration status using blood and urine sam-ples. There was significant decrease in serum os -molality level during fasting (p<0.05). The ma-jority of subjects had normal serum osmolality levels (euhydration). These condition occur due to the homeostasis mechanism during fasting, so that serum osmolality is able to be maintained in normal levels. Hosseini et al. (2013); Dikme and Dikme (2016) pointed that there was no signifi
-cant differences in osmolality serum before and during RF. Unchanging serum osmolality may be caused by normal levels of plasma sodium or the balance condition of fluid and sodium. Increasing of serum osmolality can occur due to the hyper-natremia or excess of sodium intake (Kuwabara
et al. 2017).
Hydration status based on USG level shows that before and during RF all subject were suffering from dehydration (100%). These because the subjects had the same water intake ha-bits before and during RF. These result was in line with Hardinsyah et al. (2017b), that all sub-jects were suffering from dehydration and was worse during fasting, especially in the afternoon near iftar time based on the USG levels. There was no positive correlation between serum osmo-lality and USG. Less subjects were categorized as having dehydration based on osmolality levels compared to the USG levels. These can be ex-plained by the homeostasis mechanism in body.
Changing of osmolality activates the osmoreceptor, so that can increase the anti-diuretic hormone (ADH) and stimulate the thirsty mechanism. Increasing of osmolality can causes dehydration and become more severe without immediate fluid consumption during fasting. These induced the kidney to reabsorb water for maintenance and fluid balancing in the body, so the urine will decrease in volume and be more concentrated and the body water will at normal level (Hardinsyah et al. 2017a).
The present of this mechanism was con-firmed by data on subject’s dehydration symp -toms of this study. More subjects claimed dec-rease in urine volume and more concentrated urine during the RF. In addition, self-urine check cards result also showed that more subject had more concentrated urine colour during fasting.
Liver function before and during Ramadan fasting
Table 3 shows significant decrease in SGOT and SGPT level during fasting (p<0.05).
Variables Before RF (n=18) During RF (n=18) Delta p
Median±SD Median±SD
Body height (cm) Body weight (kg) Body fat (kg) Visceral fat (kg) Total body water (kg) BMI (kg/m2) * Significantly paired t-test in p<0.05
36 J. Gizi Pangan,Volume 13, Number 1, March 2018 These results indicated that the liver was working
more lightly and had lower risk to cell damage during fasting. Study by Wahjoetomo (1994) in Hardinsyah (2011) and Nasiri et al. (2016) also found that SGOT and SGPT serum levels during fasting were lower than before fasting.
Some factors that may increase the SGPT levels are excess of fat intake, alcohol consump-tion, smoking habits, and free radicals exposed (Hardinsyah 2011). Subject in this study were non-smokers and consume no alcohol. Subject’s fat consumption was not in excess, it was ≤91 g based on RDA (2013). So the decreasing of SGPT levels in this study was explained by the fasting done by subject during the Ramadan holy month. Exposure of free radicals in this study not only from cigarette smoke but also from food and energy metabolism in the body. Food like carbo-hydrate, fat, and protein sources will be break-down to form energy, so it needs large amount of oxygen capacity. Increasing oxygen will lead to production of free radicals in the body. When the metabolism is increasing, detoxification organ performed in heavier task (Hardinsyah 2011).
Carbohydrate, fat, and protein intake be-fore and during RF in this study were significantly different and decrease during fasting, so the free radicals exposure and toxin from food were low. Therefore, the optimum cell regeneration process will happen and the detoxification organ carries lighter task (Hardinsyah 2011). These process was characterized by the decrease in SGOT and SGPT levels in the liver tissue (Table 3).
SGOT is an enzyme which helps the glu-coneogenesis process in the mitochondria. When the carbohydrate intake is low during fasting, the body will breakdown the energy storage (fat) in the body to produce the glucose as an energy source for activities. As a result the SGOT en-zyme is required in optimum amount as a cata-lyst. During fasting the breakdown of fat to en-ergy (gluconeogenesis) still under control, so
the secretion of SGOT was not too high like in normal time. It means that the liver was working lighter through the recycle of the energy deposits in the body during fasting (Thapa & Walia 2007).
SGPT is an enzyme which produced by liver tissue and has higher activity in the liver. The significant decrease of SGPT in this study occurred due to the lowering of glycolysis pro-cess in the cytosol, this was caused by restric-tion of carbohydrate intake during fasting and the body uses glycogen in limited quantities for glycolysis. Cytosol is the site of glycolysis and SGPT is the key enzyme. So that when intake of carbohydrate was restricted and so was the gly-colysis, the SGPT enzyme excretion would also be going down (Thapa & Walia 2007).
Table 3 also shows that there is a tendency of decline in albumin serum level, but no signifi -cant differences (p>0.05). These results were in line with study by Mohammed (2011) and Kamal
et al. (2012) who found that there was no sig-nificant differences between albumin level before and during RF. Decreasing of albumin level was suspected by proteolysis from gluconeogenesis. There no decrease of body muscle percentage, but only decreasing in energy resource and body fat percentage in the body (Syam 2016).
The other test of liver function was biliru-bin urine. The result showed that there was no bi-lirubin found in the most of subject’s urine. Study by Mohammed (2011) also found that there was no significant differences before, during, and af -ter RF. The existence of bilirubin content in sub-ject’s urine indicated the damage of liver tissue or increasing of haemoglobin breakdown.
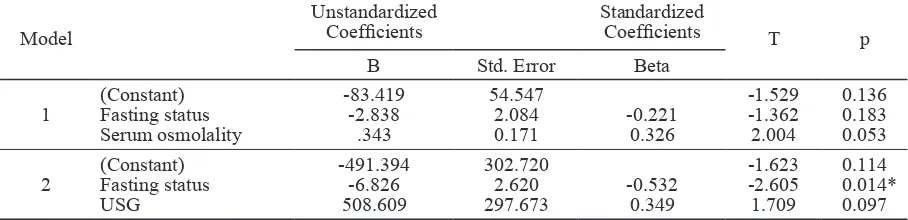
The regression of fasting status and hydration status to liver function
Table 4 shows the multiple linear regres-sion analysis was used to analyse the correla-tion of fasting status and hydracorrela-tion status (serum osmolality and USG) to liver function (SGPT Table 2. The distribution of subjects based on water intake, water intake levels, and hydration status before and during Ramadan fasting
Variables Before fasting During fasting p
Water intake (mean±SD) Water requirement (mean±SD) Water intake level (mean±SD)
Severe (<90%) (n(%))
Normal (≥90%) (n(%))
Total (n(%))
2571.7±373.7 2701.4±239.2 95.2±15.6 8 (44.4%) 10 (55.6%) 18 (100%)
2305.5±337.3 2503.1±231.8 85.4±14.6 12 (66.7%)
6 (33.3%) 18 (100%)
0.000*
0.000*
Serum osmolality (mean±SD)
Euhydration (<320 mlosmol/kgH2O)(n(%))
Dehydration (≥320 mlosmol/kgH2O)(n(%)) Total (n(%))
USG (mean±SD)
Euhydration (USG<1.015 g/mL) (n(%))
Dehydration (USG≥1.015 g/mL)(n(%))
Total (n(%))
319±7.0 12 (66.7)
6 (33.3) 18 (100.0) 1.016±0.00
0 (0.0) 18 (0.0) 18 (100.0)
315±4.9 17 (94.4)
1 (5.6) 18 (100.0) 1.022±0.00
0 (0.0) 18 (0.0) 18 (100.0)
0.010**
0.001**
level). The result shows that fasting status effect SGPT level more compared to hydration status (p<0.05). Hydration status in this study was not affecting the SGPT level, because water a direct antitoxins in the body. Water may speed up tox-in clearance by functiontox-ing as solvent therefore water can help in filtration and excretion of body fluid by kidney resulted in urine secretion (Har -dinsyah 2011).
SGPT level was significantly affected by fasting status through the nutrients metabolism during fasting. The decrease in carbohydrate in-take during fasting because of the limited time for eating lowers the SGPT enzyme secretion (Thapa & Walia 2007) (Trabelsi et al. 2011).
CONCLUSION
Ramadan fasting had positive effect for de-creasing of BMI through the lowering of the body fat percentage because of energy, protein, fat, and carbohydrates intake are restricted. Most of sub-jects had severe hydration status (dehydration) during RF. The bad drinking habits before and during fasting explained this result. Another ben-efit of RF is that the liver function became better. It was characterized by the lowering of SGOT and SGPT levels. The benefits of RF appeared when the nutrients intake was balance each day.
The limitations of this study were the small number of subjects, done without control subjects and the hydration status was measured only in a week before fasting and the last 10 days of fast-ing. Therefore, future research should look into fluctuation in hydration status during RF, and the
study must conducted in large number of sub-jects and in various subsub-jects with different hy-dration status.
REFERENCES
Al-Arouj et al. 2010. Recomendations for man-agement of diabetes during Ramadan. Di-abetes Care 33(8):1895-1902.
Alinezhad NM, Salehi M. 2016. Effect of Rama-dan fasting on blood pressure in hyperten-sive patients: a systematic review. J Fast-ing Health 4(1):17-21.
Buyckx ME. 2007. Hydration and health promo-tion: a brief introduction. J Am Coll Nutr 5(26):533S-534S.
Contento IR. 2011. Nutrition Education Linking Research, Theory, and Practice. Canada: Jones and Bartlett Publishers Internation-al.
Dikme O, Dikme O. 2016. Ramadan fasting and its influence on serum osmolality in emer -gency patients. J Emerg Med Critical Care 2(1):1-4.
Fararjeh MA, Bustanji YK, Mohammad MK, Sa-leme ML. 2012. Intermittent fasting dur-ing Ramadan attenuates proinflammatory cytokines and immune cells in healthy subjects. Nutr res 3(2):947-955.
Firmansyah MA. 2015. Pengaruh puasa Rama-dan pada beberapa kondisi kesehatan. CKD 42(7):510-514.
Gustam, Briawan, H ardinsyah. 2012. Risk fac-tors of dehydration in indonesian adoles-cents and adults. J Gizi Pangan 8(1):1-9. Table 3. Liver function (mean±SD) before and during RF
Variable Before fasting (n=18) During fasting (n=18) Delta p
SGOT (U/L) SGPT (U/L) Albumin (g/dl) Bilirubin n(%)
Negative Positive
21.3±5.8 25.8±6.7 4.2±0.2
17 (94.4) 1 (5.6)
18.9±4.7 21.2±6.2 4.1±0.1
17 (94.4) 1 (5.6)
-2.4 -4.7 -0.02
0.000* 0.000* 0.717
*) Significantly paired t-test in p<0.05
Model
Unstandardized
Coefficients Standardized Coefficients T p
B Std. Error Beta
1
(Constant) Fasting status Serum osmolality
-83.419 -2.838
.343
54.547 2.084 0.171
-0.221 0.326
-1.529 -1.362 2.004
0.136 0.183 0.053
2
(Constant) Fasting status USG
-491.394 -6.826 508.609
302.720 2.620 297.673
-0.532 0.349
-1.623 -2.605 1.709
0.114 0.014*
0.097
* Significant multiple linear regression in p<0.05
38 J. Gizi Pangan,Volume 13, Number 1, March 2018 Hardinsyah, Santoso BI, Siregar P, Pardede SO.
2017a. Water for Health 3th Edition. Jakar-ta: Centra Communications.
Hardinsyah, Mawadaturrohmah N, Abinowo KP, Baliwati YF. 2017b. Hydration status and water intake of women during and after Ramadan fasting. Malays J Nutr (supple-ment) 23(1):S63-S70.
Hardinsyah. 2011. Detox While Fasting. Jakarta: PT. Gramedia.
Hosseini SRA, Sardar MA, Hejazi K, Farahati S. 2013. The effect of Ramadhan fasting and physical activity on body composition, serum osmolality levels and some param-eters of electrolytes in female. Int J Endo-crinol Metab 2(2):88-94.
Kamal S, Ahmad QS, Sayedda K, Haque M. 2012. Effect of islamic fasting on lip-id profile, total protein and albumin on healthy muslim man subjects of shri ram murti smarak institute of medical sciences, bareilly, uttar pradesh. National journal of medical research 2(4):407-410.
Kuwabara et al. 2017. Increased serum sodium and serum osmolarity are independent risk factors for developing chronic kid-ney disease; 5 year cohort study. pone. Doi:10.1371/journal.pone.0169137. Mazidi M, Karimi E, Rezaee P, Nematy M,
Sale-hi M. 2014. The effect of Ramadan fast-ing on body composition. Shiraz E-Med J. Doi:10.17795/sej19733.
Mohamed HJJ, Nazri NH, See-ling L. 2013. Ra-madan bazaar and RaRa-madan buffets: the possible influence on eating behaviour and health among Malaysian muslims. J Fast-ing Health 1(2):43-45.
Mohammed ZJ. 2011. The influence of Rama -dan fasting on some hematological and biochemical parameters in healthy adult mans. Iraqi National J. For Nursing Spe-cialties 24(1):45-51.
Mousavi SA, Rezaei M, Baghni SA, Seifi M. 2014. Effect of fasting on mental health in the general population of Kermanshah, Iran. J Fasting Health 2(2):65-70.
Nasiri J, Kheiri S, Khoshdel A, Boroujeni AJ. 2016. Effect of Ramadan fast on liver func-tion tests. Iran J Med Sci 41(5):459-460. Sinaiko A. 2007. Obesity, insulin resistance and
the metabolic syndrome. J Pediatr 83(1): 3-5.
Syam AF, Sobur CS, Abdullah M, Makmun D. 2016. Ramadan fasting decreases body fat but not protein mass. Int J Endocrinol Metab. Doi: 10.5812/ijem.29687.
Thapa BR, Walia A. 2007. Liver function tests and thei interpretation. Indian J Pedistr 74(7):663-671.
Trabelsi K, Abed K, Trepanowski JF, Stannard SR, Ghlissi Z, Ghozzi H, Masmoudi L, Jammoussi K, Hakim A. 2011. Effects of Ramadan fasting on biochemical and anthropometric parameters in physically active men. Asian J Sports Med 2(3):134-144.
Trepanowski JF, Bloomer RJ. 2010. The impact of religious fasting on human health. Nutr J 9(57):2-5.
![The effects of five week aerobic interval training on the body composition of pencak silat elite athletes / Johansyah Lubis … [et al.]](data:image/gif;base64,R0lGODlhAQABAIAAAP///wAAACH5BAEAAAAALAAAAAABAAEAAAICRAEAOw==)