Abstract. Traffic congestion reflects waste of time and energy that must be eliminated. Many methods have been employed by past studies to solve this problem. The approach utilized by those studies is mostly macroscopic that consider vehicles and drivers in aggregate. This study argues that a more microscopic approach is also required to depict and solve the congestion problem. Hence, agent-based simulation is brought forward to help identify the cause of congestion problem. In this study, drivers are assumed to have their own motives that might drive them to resort to aggressive behaviors that ultimately lead to traffic congestion. As a preliminary investigation, this study aims to discover type of aggressive driving behavior on Bandung City. The results demonstrate that aggressive dirivng behaviors on Bandung City can be categorized into five factors namely improper speed, inattentiveness, display of hostility, impatience, and disobedience of traffic sign/signals. This study also found that different composition of driving behaviors leads to different degree of congestion. Impatience behavior is found to be the factor that must be eliminate to remedy congestion on Bandung City.
Kata kunci: Driving behavior, traffic congestion, factor analysis, agent-based simulation, smart city
Abstrak. Kemacetan lalu lintas mencerminkan pemborosan energi dan waktu yang harus ditiadakan. Banyak metode telah digunakan dalam penelitian-penelitian masa lalu yang ditujukan untuk memecahkan permasalahan ini. Pendekatan yang digunakan oleh penelitian-penelitian tersebut untuk menggambarkan dan memecahkan masalah kemacetan pada umumnya bersifat makroskopik yang memandang kendaraan dan pengendara secara agregat. Studi ini berpendapat bahwa pendekatan yang lebih mikroskopis diperlukan dalam menggambarkan dan memecahkan permasalahan kemacetan. Dalam studi ini, pengemudi diasumsikan memiliki motif tersendiri saat berkendara yang dapat mendorong mereka untuk berperilaku agresif dan berujung pada kemacetan. Sebagai penyelidikan awal, studi ini bertujuan untuk mengetahui jenis perilaku mengemudi agresif di Kota Bandung. Hasil dari studi ini menunjukkan bahwa perilaku mengemudi agresif dapat dikategorikan menjadi lima faktor yaitu penggunaan kecepatan yang tidak sepantasnya, kurangnya perhatian saat berkendara, perilaku kekerasan dalam berkendara, ketidaksabaran dalam berkendara, dan ketidaktaatan pada tanda lalu lintas. Studi ini juga menemukan bahwa komposisi perilaku mengemudi agresif yang berbeda dapat menghasilkan perbedaan tingkat kemacetan lalu lintas. Ketidaksabaran dalam berkendara ditemukan sebagai factor yang paling harus dieliminasi untuk mengurangi kemacetan di Kota Bandung.
Keywords: Perilaku mengemudi, kemacetan lalu lintas, analisis factor, simulasi berbasis agen, smart city
*Corresponding author. Email: manahan@sbm-itb.ac.idth th th Received: June 26 , 2018, Revision: July 17 , 2018, Accepted: July 18 , 2018
Print ISSN: 1412-1700; Online ISSN: 2089-7928. DOI: http://dx.doi.org/10.12695/jmt.2018.17.2.5
Copyright@2018. Published by Unit Research and Knowledge, School of Business and Management - Institut Teknologi Bandung (SBM-ITB)
Investigating Aggressive Driving Behavior in Reducing
Traffic Congestion on Bandung City
JurnalManajemen Teknologi
Jurnal Manajemen Teknologi, 17(1), 2018,151-165 Available online at http://journal.sbm.itb.ac.id
1 2 3 4 5
Ulfi Muti , Mahanan Siallagan *, Utomo S. Putro , Marsetyawan , and Dini T. Alamanda 1, 2, 3, School of Business and Management, Institut Teknologi Bandung
4Bappeda Provinsi Riau, Pemerintah Daerah Provinsi Riau 5Fakultas Ekonomi, Universitas Garut
Introduction
Traffic congestion in Bandung is deteriorating in increasing pace. It is caused by the quantity of vehicles in Bandung that continually expanded from time to time. Unfortunately, the expansion rate of transportation infrastructure could not keep up with the increasing number of vehicles. To illustrate, the length of roads in West Java - the province in which Bandung became its capital city - in 2016 is 21.574 km (Section of Commerce and Service Statistics, 2016).
It represents a slight decrease from the length of roads in 2015 that has reached 25.729 km (Section of Commerce and Service Statistics, 2016). On the contrary, the number of vehicles in West Java is increasing by the rate of 12,55% annualy between 2012 to 2016 (Section of Commerce and Service Statistics, 2016). In 2016 alone, motorcycle and passenger car increased by 9,96% and 7,52% concecutively. Moreover, motorcycle dominates the number of vehicles across all types – motorcycle, passenger car, bus, and truck – with 79% (Section of Commerce and Service Statistics, 2016). The complete figures can be seen on Figure 1.
Figure 1.
The Growth in Number of Vehicles on West Java Between 2012 to 2016. Source: Section of Commerce and Service Quality (2016)
As the result, the roadways of Bandung City are overcrowded in which the actual number of vehicles is about to surpass the healthy number of vehicles that roadways can endure. Therefore, this issue should be dealt immediately by reducing the negative impacts that might be resulted. Expanding the highway is one of the solutions in resolving traffic congestion from macroscopic perspective. However, this solution alone is not enough because there are other variables in play, such as the increasing number of vehicles. One micro element of congestion that deserve attention from researchers, as admitted by OECD (Organisation for Economic Cooperation and Development), is driving behaviors (OECD, 2007).
Abstract. Traffic congestion reflects waste of time and energy that must be eliminated. Many methods have been employed by past studies to solve this problem. The approach utilized by those studies is mostly macroscopic that consider vehicles and drivers in aggregate. This study argues that a more microscopic approach is also required to depict and solve the congestion problem. Hence, agent-based simulation is brought forward to help identify the cause of congestion problem. In this study, drivers are assumed to have their own motives that might drive them to resort to aggressive behaviors that ultimately lead to traffic congestion. As a preliminary investigation, this study aims to discover type of aggressive driving behavior on Bandung City. The results demonstrate that aggressive dirivng behaviors on Bandung City can be categorized into five factors namely improper speed, inattentiveness, display of hostility, impatience, and disobedience of traffic sign/signals. This study also found that different composition of driving behaviors leads to different degree of congestion. Impatience behavior is found to be the factor that must be eliminate to remedy congestion on Bandung City.
Kata kunci: Driving behavior, traffic congestion, factor analysis, agent-based simulation, smart city
Abstrak. Kemacetan lalu lintas mencerminkan pemborosan energi dan waktu yang harus ditiadakan. Banyak metode telah digunakan dalam penelitian-penelitian masa lalu yang ditujukan untuk memecahkan permasalahan ini. Pendekatan yang digunakan oleh penelitian-penelitian tersebut untuk menggambarkan dan memecahkan masalah kemacetan pada umumnya bersifat makroskopik yang memandang kendaraan dan pengendara secara agregat. Studi ini berpendapat bahwa pendekatan yang lebih mikroskopis diperlukan dalam menggambarkan dan memecahkan permasalahan kemacetan. Dalam studi ini, pengemudi diasumsikan memiliki motif tersendiri saat berkendara yang dapat mendorong mereka untuk berperilaku agresif dan berujung pada kemacetan. Sebagai penyelidikan awal, studi ini bertujuan untuk mengetahui jenis perilaku mengemudi agresif di Kota Bandung. Hasil dari studi ini menunjukkan bahwa perilaku mengemudi agresif dapat dikategorikan menjadi lima faktor yaitu penggunaan kecepatan yang tidak sepantasnya, kurangnya perhatian saat berkendara, perilaku kekerasan dalam berkendara, ketidaksabaran dalam berkendara, dan ketidaktaatan pada tanda lalu lintas. Studi ini juga menemukan bahwa komposisi perilaku mengemudi agresif yang berbeda dapat menghasilkan perbedaan tingkat kemacetan lalu lintas. Ketidaksabaran dalam berkendara ditemukan sebagai factor yang paling harus dieliminasi untuk mengurangi kemacetan di Kota Bandung.
Keywords: Perilaku mengemudi, kemacetan lalu lintas, analisis factor, simulasi berbasis agen, smart city
*Corresponding author. Email: manahan@sbm-itb.ac.idth th th Received: June 26 , 2018, Revision: July 17 , 2018, Accepted: July 18 , 2018
Print ISSN: 1412-1700; Online ISSN: 2089-7928. DOI: http://dx.doi.org/10.12695/jmt.2018.17.2.5
Copyright@2018. Published by Unit Research and Knowledge, School of Business and Management - Institut Teknologi Bandung (SBM-ITB)
Investigating Aggressive Driving Behavior in Reducing
Traffic Congestion on Bandung City
Jurnal Manajemen Teknologi
Jurnal Manajemen Teknologi, 17(1), 2018,151-165 Available online at http://journal.sbm.itb.ac.id
1 2 3 4 5
Ulfi Muti , Mahanan Siallagan *, Utomo S. Putro , Marsetyawan , and Dini T. Alamanda
1, 2, 3, School of Business and Management, Institut Teknologi Bandung 4Bapeda Provinsi Riau, Pemerintah Daerah Provinsi Riau
5Fakultas Ekonomi, Universitas Garut
Introduction
Traffic congestion in Bandung is deteriorating in increasing pace. It is caused by the quantity of vehicles in Bandung that continually expanded from time to time. Unfortunately, the expansion rate of transportation infrastructure could not keep up with the increasing number of vehicles. To illustrate, the length of roads in West Java - the province in which Bandung became its capital city - in 2016 is 21.574 km (Section of Commerce and Service Statistics, 2016).
It represents a slight decrease from the length of roads in 2015 that has reached 25.729 km (Section of Commerce and Service Statistics, 2016). On the contrary, the number of vehicles in West Java is increasing by the rate of 12,55% annualy between 2012 to 2016 (Section of Commerce and Service Statistics, 2016). In 2016 alone, motorcycle and passenger car increased by 9,96% and 7,52% concecutively. Moreover, motorcycle dominates the number of vehicles across all types – motorcycle, passenger car, bus, and truck – with 79% (Section of Commerce and Service Statistics, 2016). The complete figures can be seen on Figure 1.
Figure 1.
The Growth in Number of Vehicles on West Java Between 2012 to 2016. Source: Section of Commerce and Service Quality (2016)
As the result, the roadways of Bandung City are overcrowded in which the actual number of vehicles is about to surpass the healthy number of vehicles that roadways can endure. Therefore, this issue should be dealt immediately by reducing the negative impacts that might be resulted. Expanding the highway is one of the solutions in resolving traffic congestion from macroscopic perspective. However, this solution alone is not enough because there are other variables in play, such as the increasing number of vehicles. One micro element of congestion that deserve attention from researchers, as admitted by OECD (Organisation for Economic Cooperation and Development), is driving behaviors (OECD, 2007).
In contrast to macroscopic approach, the behavior of agents - i.e. the drivers - received greater emphasis in microscopic approach (Burmeister, Haddadi, Matylis, 1997). Ljubović (2009) sharpened this argument by stated that traffic simulation tends to put greater emphasis on drivers' behavior. As the opposite of macroscopic approach, this behavior can be explained by ordinary differential equation. By focusing on drivers as the agents in traffic simulation, the appropriate representation of traffic congestion in Bandung can be better captured. This focus enables this study to discern different characteristics of drivers. As argued by Ljubović (2009), driving styles are varied as each driver might perceive their environment differently. This perception is influenced by their characteristics as individuals including their beliefs, desires, and intentions (Rossetti, Bampi, Liu, Van Vliet, & Cybis, 2000). In respect to driving behavior, those characteristics can be characterized by their aggressiveness, confidence, and driving experience.
Multi-agent system (MAS) is farther able to clearly models drivers' decision making as individuals (Zhou, Lin, & Xi, 2012). This concept is adopted by agent-based modeling paradigm which deals with social systems that are made up by the interaction of agents. Furthermore, that interactions could turn into experiences that might stimulate agents to adapt their driving behaviors as response to their environment (Macal & North, 2010).
Cellular automata is a tool under MAS framework which represents drivers as reactive agents whose action are based on their perception of the environment (Bazzan, Wahle, & Klugl, 1999). Similar to cellular automata, car-following is also a tool under MAS framework that is able to describe individual vehicles' motion. The primary difference between car-following and cellular automata is that car-following theory is focusing on the motion of preceding vehicles as the adjacent object of the vehicle observed (Zhang, Zhao, Sun, Liu, & Li, 2016).
Based on previous explanation, agent-based modeling approach possess huge potential in simulating individual driving behavior realistically (Khalesian & Delavar, 2008). The use of this approach is also supported by Hager, Rauh, & Rid (2015) that argue that agent-based modeling can assist traffic simulation in order to develop scenarios for shaping future driving behavior.
In the case of Bandung, drivers can be divided into three groups: car drivers, motorcycle drivers, and public transportation drivers (e.g angkutan kota). Each group of drivers has distinct driving behaviors. This study concentrates on private drivers that consist of car drivers and motorcycle drivers. The rationale is that motorcycle drivers and car drivers represent significant portion of all drivers on Bandung City. Furthermore, the emergence of online public transportation in Indonesia (e.g. Gojek and Grab) that increasingly taking the role of public transportation display similar driving behavior with car drivers and motorcycle drivers.
As specified before, driving behavior sometimes can be more aggressive (e.g. impatient, attempting to different drivers, and breaking the rules). This study aims to investigate what sort of aggressive driving behavior that occured in Bandung City. Simpang Dago that is known as one of the most crowded intersection (simpang means intersection in Sundanese) on Bandung City is taken as the case. The framework of this study is showed in Figure 2.
It is worth to keep in mind that the aim of this study is to remedy the traffic congestion on Bandung City. This aim is achieved by means of identifying and reducing aggressive driving behavior. Hence, the aim of this study can be divided into two purposes. Firstly, to identify the type of aggressive driving behavior by using factor analysis. Secondly, to identify the type of aggressive driving behavior that has major contribution to the congestion by running simulations.
Research Methodology
There are several considerations that must be take into account in conducting this study. Theses are unit of analysis, sample, and variable.
Unit of analysis
The unit of analysis in this study is people who drive cars and motorcycles that contribute to traffic congestion on Bandung City. Therefore, the drivers do not have to live in Bandung City as long as they commute around Bandung City. Bandung city is designated as the area studied since it has numerous pull factors (e.g. tourism and education) that attract people to visit. Furthermore, this study aims to support the Municipal Government of Bandung City to improve the welfare of local communities in terms of economy and social affairs.
Sample
The data used in this study is gathered by using questionnaire that randomly distributed to the drivers in Bandung. As the result, 297 responses are solicited and considered as sufficient to be analyzed using exploratory factor analysis.
Questionnaires
Questionnaire used in this study aims to explore about the type of aggressive driving behavior that are mostly occured on Bandung. There are 10 factors with 14 total items explained those factors as could be seen thoroughly on Table 1. Four-point Likert-scale was used to capture the level of agreement of respondents. The scale starts from 1 that reflects “strongly disagree” to 4 that reflects “strongly agree”. Moreover, logit questions, i.e. Yes/No questions, are also used in some items. The items are conveyed in Bahasa Indonesia as local language, instead of English, to ease respondents to provide responses.
Figure 2.
Research Framework
Factor analysis in exploring the types of aggressive done
by drivers in Bandung
Result of factor analysis Type of aggressiveness
Behaviour of agents in Agent-based Simulation and Modelling
Traffic Model in Agent-based Simulation and Modelling
Result of ABMS
In contrast to macroscopic approach, the behavior of agents - i.e. the drivers - received greater emphasis in microscopic approach (Burmeister, Haddadi, Matylis, 1997). Ljubović (2009) sharpened this argument by stated that traffic simulation tends to put greater emphasis on drivers' behavior. As the opposite of macroscopic approach, this behavior can be explained by ordinary differential equation. By focusing on drivers as the agents in traffic simulation, the appropriate representation of traffic congestion in Bandung can be better captured. This focus enables this study to discern different characteristics of drivers. As argued by Ljubović (2009), driving styles are varied as each driver might perceive their environment differently. This perception is influenced by their characteristics as individuals including their beliefs, desires, and intentions (Rossetti et al., 2000). In respect to driving behavior, those characteristics can be characterized by their aggressiveness, confidence, and driving experience.
Multi-agent system (MAS) is farther able to clearly models drivers' decision making as individuals (Zhou, Lin, & Xi, 2012). This concept is adopted by agent-based modeling paradigm which deals with social systems that are made up by the interaction of agents. Furthermore, that interactions could turn into experiences that might stimulate agents to adapt their driving behaviors as response to their environment (Macal & North, 2010).
Cellular automata is a tool under MAS framework which represents drivers as reactive agents whose action are based on their perception of the environment (Bazzan, Wahle, & Klugl, 1999). Similar to cellular automata, car-following is also a tool under MAS framework that is able to describe individual vehicles' motion. The primary difference between car-following and cellular automata is that car-following theory is focusing on the motion of preceding vehicles as the adjacent object of the vehicle observed (Zhang, Zhao, Sun, Liu, & Li, 2016).
Based on previous explanation, agent-based modeling approach possess huge potential in simulating individual driving behavior realistically (Khalesian & Delavar, 2008). The use of this approach is also supported by Hager, Rauh, & Rid (2015) that argue that agent-based modeling can assist traffic simulation in order to develop scenarios for shaping future driving behavior.
In the case of Bandung, drivers can be divided into three groups: car drivers, motorcycle drivers, and public transportation drivers (e.g angkutan kota). Each group of drivers has distinct driving behaviors. This study concentrates on private drivers that consist of car drivers and motorcycle drivers. The rationale is that motorcycle drivers and car drivers represent significant portion of all drivers on Bandung City. Furthermore, the emergence of online public transportation in Indonesia (e.g. Gojek and Grab) that increasingly taking the role of public transportation display similar driving behavior with car drivers and motorcycle drivers.
As specified before, driving behavior sometimes can be more aggressive (e.g. impatient, attempting to different drivers, and breaking the rules). This study aims to investigate what sort of aggressive driving behavior that occured in Bandung City. Simpang Dago that is known as one of the most crowded intersection (simpang means intersection in Sundanese) on Bandung City is taken as the case. The framework of this study is showed in Figure 2.
It is worth to keep in mind that the aim of this study is to remedy the traffic congestion on Bandung City. This aim is achieved by means of identifying and reducing aggressive driving behavior. Hence, the aim of this study can be divided into two purposes. Firstly, to identify the type of aggressive driving behavior by using factor analysis. Secondly, to identify the type of aggressive driving behavior that has major contribution to the congestion by running simulations.
Research Methodology
There are several considerations that must be take into account in conducting this study. Theses are unit of analysis, sample, and variable.
Unit of analysis
The unit of analysis in this study is people who drive cars and motorcycles that contribute to traffic congestion on Bandung City. Therefore, the drivers do not have to live in Bandung City as long as they commute around Bandung City. Bandung city is designated as the area studied since it has numerous pull factors (e.g. tourism and education) that attract people to visit. Furthermore, this study aims to support the Municipal Government of Bandung City to improve the welfare of local communities in terms of economy and social affairs.
Sample
The data used in this study is gathered by using questionnaire that randomly distributed to the drivers in Bandung. As the result, 297 responses are solicited and considered as sufficient to be analyzed using exploratory factor analysis.
Questionnaires
Questionnaire used in this study aims to explore about the type of aggressive driving behavior that are mostly occured on Bandung. There are 10 factors with 14 total items explained those factors as could be seen thoroughly on Table 1. Four-point Likert-scale was used to capture the level of agreement of respondents. The scale starts from 1 that reflects “strongly disagree” to 4 that reflects “strongly agree”. Moreover, logit questions, i.e. Yes/No questions, are also used in some items. The items are conveyed in Bahasa Indonesia as local language, instead of English, to ease respondents to provide responses.
Figure 2.
Research Framework
Factor analysis in exploring the types of aggressive done
by drivers in Bandung
Result of factor analysis Type of aggressiveness
Behaviour of agents in Agent-based Simulation and Modelling
Traffic Model in Agent-based Simulation and Modelling
Result of ABMS
Variable
The factors and indicators used in this study are mostly adopted from Wickens et al. (2013) that also study aggressive driving behavior as perceived by other drivers. The indicators are showed on Table 1.
Similar variables are also employed by Galovski and Blanchard (2002). By using 30 recruited drivers, Galovski and Blanchard (2002) study attempts to measure the efficacy of Cognitive-behavioral Psychological Intervention (CBT) to ameliorate aggressive driving behavior as opposed to ticketing and other conventional treatment.
Factors Indicators Explanation
Improper Speed Speed Racing “I ever drive with the high speed which
over the tolerated speed on the road I pass” Unnecessary
slow driving “I ever slower my speed while driving because of unnecessary things (e.g. texting while driving”
Sporadic speeds “I ever drive with continuously changing my speed”
Tailgating “I ever following the vehicles ahead with
the distance is more closely than reasonable”
Lane Usage Improper Lane
Usage “I ever pass the vehicles ahead using an improper way (e.g. shoulder of the roadway”
Sides-weeping “I ever move from one lane to another” Improperly Equipped No turn signal “I Always give the flashing light when
turning or changing lane” Disobedience of
Traffic Sign/ Signal “I ever break the traffic control sign”
Improper Braking “I ever brake suddenly without due regard
the vehicle ahead do the same things”
Blocking “I don’t give the other vehicle the way for
them passing through” Display of Hostility
or Violence Yelling to other drivers “I ever yell the other driver on horn honking” Chasing the
other vehicles “When there is an annoying vehicle, I ever to chase it to solve my problem” Driver’s Inattention Cell Phone “I ever distracted because of cell phone
use” Unspecified
distraction “I ever distracted because of another distraction beside cell phone (e.g. there is a street seller)”
Table 1.
The Factors that Constitute Aggressive Driving Behavior
The next step is to assign appropriate name to each factor that is found. In factor 1, improper speed and unnecessary slow driving remains in the same group as hypothesized which makes it easier to label them as improper speed. Factor 2 includes improper braking and unspecified distraction which contain different variables adopted from Wickens, Hollands, Banburry, & Parasuraman (2013). Regarding to a study conducted by James & Nahl (2000), both variables represent inattentiveness because both of improper braking (braking suddenly) and unspecified distraction are caused by drivers' inattentiveness to their surroundings.
Factor 3, that include yelling to other drivers and chasing other drivers, remain the same as hypothesized. The appropriate name for factor 3 is display of hostility or violence. Factor 4 contains sporadic speeds and tailgating. Since in the hypothesis they are belong to different factor, it would be more appropriate to review other studies before assigning any name. The sporadic speeds and tailgating are the product of drivers' rushing habit.
Table 2.
The Result of Reliability and Validity Test
KMO Barlett Test’s of
Sphericity Factor of Variance Explained (%) Cronbach Alpha Approx.
Chi-Square df Sig
0,628 339,878 91 0,000 52,827 0,509
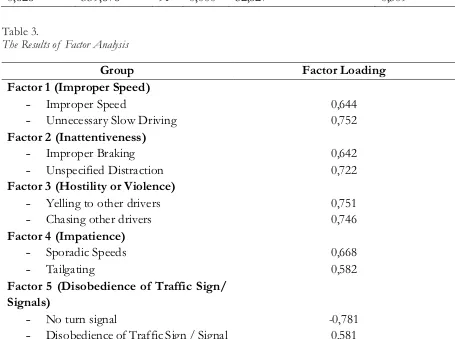
Table 3.
The Results of Factor Analysis
Group Factor Loading
Factor 1 (Improper Speed) - Improper Speed
- Unnecessary Slow Driving 0,644 0,752
Factor 2 (Inattentiveness) - Improper Braking
- Unspecified Distraction 0,642 0,722
Factor 3 (Hostility or Violence) - Yelling to other drivers
- Chasing other drivers 0,751 0,746
Factor 4 (Impatience) - Sporadic Speeds
- Tailgating 0,668 0,582
Factor 5 (Disobedience of Traffic Sign/ Signals)
- No turn signal
Variable
The factors and indicators used in this study are mostly adopted from Wickens et al. (2013) that also study aggressive driving behavior as perceived by other drivers. The indicators are showed on Table 1.
Similar variables are also employed by Galovski and Blanchard (2002). By using 30 recruited drivers, Galovski and Blanchard (2002) study attempts to measure the efficacy of Cognitive-behavioral Psychological Intervention (CBT) to ameliorate aggressive driving behavior as opposed to ticketing and other conventional treatment.
Factors Indicators Explanation
Improper Speed Speed Racing “I ever drive with the high speed which
over the tolerated speed on the road I pass” Unnecessary
slow driving “I ever slower my speed while driving because of unnecessary things (e.g. texting while driving”
Sporadic speeds “I ever drive with continuously changing my speed”
Tailgating “I ever following the vehicles ahead with
the distance is more closely than reasonable”
Lane Usage Improper Lane
Usage “I ever pass the vehicles ahead using an improper way (e.g. shoulder of the roadway”
Sides-weeping “I ever move from one lane to another” Improperly Equipped No turn signal “I Always give the flashing light when
turning or changing lane” Disobedience of
Traffic Sign/ Signal “I ever break the traffic control sign”
Improper Braking “I ever brake suddenly without due regard
the vehicle ahead do the same things”
Blocking “I don’t give the other vehicle the way for
them passing through” Display of Hostility
or Violence Yelling to other drivers “I ever yell the other driver on horn honking” Chasing the
other vehicles “When there is an annoying vehicle, I ever to chase it to solve my problem” Driver’s Inattention Cell Phone “I ever distracted because of cell phone
use” Unspecified
distraction “I ever distracted because of another distraction beside cell phone (e.g. there is a street seller)”
Table 1.
The Factors that Constitute Aggressive Driving Behavior
The next step is to assign appropriate name to each factor that is found. In factor 1, improper speed and unnecessary slow driving remains in the same group as hypothesized which makes it easier to label them as improper speed. Factor 2 includes improper braking and unspecified distraction which contain different variables adopted from Wickens, Hollands, Banburry, & Parasuraman (2013). Regarding to a study conducted by James & Nahl (2000), both variables represent inattentiveness because both of improper braking (braking suddenly) and unspecified distraction are caused by drivers' inattentiveness to their surroundings.
Factor 3, that include yelling to other drivers and chasing other drivers, remain the same as hypothesized. The appropriate name for factor 3 is display of hostility or violence. Factor 4 contains sporadic speeds and tailgating. Since in the hypothesis they are belong to different factor, it would be more appropriate to review other studies before assigning any name. The sporadic speeds and tailgating are the product of drivers' rushing habit.
Table 2.
The Result of Reliability and Validity Test
KMO Barlett Test’s of
Sphericity Factor of Variance Explained (%) Cronbach Alpha Approx.
Chi-Square df Sig
0,628 339,878 91 0,000 52,827 0,509
Table 3.
The Results of Factor Analysis
Group Factor Loading
Factor 1 (Improper Speed)
- Improper Speed
- Unnecessary Slow Driving 0,644 0,752
Factor 2 (Inattentiveness) - Improper Braking
- Unspecified Distraction 0,642 0,722
Factor 3 (Hostility or Violence) - Yelling to other drivers
- Chasing other drivers 0,751 0,746
Factor 4 (Impatience) - Sporadic Speeds
- Tailgating 0,668 0,582
Factor 5 (Disobedience of Traffic Sign/ Signals)
- No turn signal
They sometimes miscalculate the travel time and tend to be rushing when they meet the obstacle that they don't expected (e.g. congestion). Thus, it makes them to be in a hurry and become impatience which indicated by changing the speed sporadically and also following the vehicle ahead to show that they are in a hurry (James & Nahl, 2000). Hence, the appropriate name of factor 4 is impatience. The last factor is factor 5 that includes not using turn signal and disobedience of traffic sign / signals. Both variables can be easily labeled as disobedience of traffic sign / signals since not using turn signal also represents disobedience.
The types of aggressive driving behavior are used in agent-based modeling and simulation to portray the heterogeneity of driving behaviors. It is important that the simulation conducted approximately represents the real world. Thus, to ensure well-representation of simulation, the variety of drivers in term of driving behavior is maintained to be fairly accurate by replicating the actual-world's composition of them.
Agent-based Modeling and Simulation
The agent-based modeling is known as the approach that is able to cover behavioral heterogeneity (Manley et al., 2014). In this study, agent-based modeling is used to discern the heterogeneous behavior of drivers – that are grouped into normal driver, speeding-improperly driver, inattentive driver, and impatient driver – at individual level. In principle, agents can be categorized into simple and complex agents based on their characteristics. In general, drivers interact and adapt to their environment and other agents; drivers are able to learn based on which their behavior can be modified; each agent could act autonomously; and agents are heterogenous. While complex agents are considered to have all of those characteristics, simple agents are lack in one or more of those characteristics.
Regarding characteristics, other variety of agents also arise that consist of reactive and cognitive agents. Compared to cognitive agents, reactive agents lack of ability to learn and change their behavior based on their learning process although they are still trying to adapt. In this study, reactive agents are used in traffic simulation to model the congestion on Simpang Dago. Hence their actions would be more tactical. The options would be speed changing, lane changing, accelerating, decelerating, rules following, and willingness to overtake in order to produce the shortest travel time. In order to pursue the shortest travel time, the driving behaviors could produce congestion especially at the intersection.
The Attribute of Drivers
Each agent is assumed to have varied aggressiveness level that determine the preferred speed. Aggressive driving behavior means that the behavior while driving is influenced by drivers' emotion that might increase safety risk of other drivers (James & Nahl, 2000). As found in this study, there are five types of aggressiveness, namely improper speed, inattentiveness, hostility or violence, impatience, and disobedience of traffic sign / signals. These types of aggressiveness are the result of autonomous behaviors of agents which enable them to be proactive in the effort to arrive at the destination on time. During the attempt to accomplish the goal, the agents react to the surrounding environment.
If the actual travel time exceeds the expected travel time on regular basis, the typical reactions of drivers to compensate that situation are:
o If the observed site is empty, then they may increase the speed of their vehicles.
o If the observed site is crowded because the traffic light is red, then they may break through the traffic light.
o If the observed site is crowded because traffic light malfunction and / or the absence of policemen to manage the traffic, they may compete with other drivers by blocking or taking over the path of other drivers.
The Use of Cellular Automata on Driving Behavior Simulation
Semantic explanation on the previous section can be stated mathematically by the assistance of cellular automata. It is conventionally used in modeling the flow of traffic both in freeway and congested roadway as found on previous studies (e.g. Nagel & Schreckenberg, 1992; Das, 2011). The basic tenets of cellular automata in modeling the traffic is that if a vehicle observes preceding vehicle, the vehicle will be stop moving considering that the preceding vehicle will not move in the next time unit – the time needed to move to the next grid. Hence, in moving to the next grid, the vehicle does not move directly. It follows two rules: one-dimensional rule in X-axis motion and one-dimensional rule in Y-axis motion.
In one-dimensional rule in X-axis motion, the focus of drivers is to move forward without considering their neighbor both in the left and right. Instead of that, the drivers focus on the existence of other vehicles ahead and behind of them. In respect to one-dimensional rule, the plausible type of aggressiveness that might emerged is impatience and inattentiveness. In other words, they might increase or decrease their current speed.
In one-dimensional rule in Y-axis motion, the acceleration and randomization have the possiblity to occur. It means the driver can control the velocity of their vehicles. As a consequence, they can adapt their behavior to the environment including other vehicles, roads, traffic lights, intersection, and people crossing the street.
Environment communicate its condition to agents through the behavior or response of preceding vehicle that includes slowing down or speeding up, the occurrence of an incident, cost of traveling (which in this study is limited to the shortest time and path), and the politeness level of the drivers. Those signals serve as a means of communication between agents and their environment that eventually shape the reasoning of the agents. Thus, based on a given condition, the agents are able to accelerate or decelerate, change the lane or not, change the route or stay on the same route (which is limited in this study), overtake or queuing in line, and being polite to other drivers or the opposite.
All of the explanations above can be summarized in Figure 3 that describe the agent reaction and behavior toward environment in a loop.
· Vehicle a head slow down /speed up
· Incident/event · Cost of Traveling · Initiative/politeness level Send orders
They sometimes miscalculate the travel time and tend to be rushing when they meet the obstacle that they don't expected (e.g. congestion). Thus, it makes them to be in a hurry and become impatience which indicated by changing the speed sporadically and also following the vehicle ahead to show that they are in a hurry (James & Nahl, 2000). Hence, the appropriate name of factor 4 is impatience. The last factor is factor 5 that includes not using turn signal and disobedience of traffic sign / signals. Both variables can be easily labeled as disobedience of traffic sign / signals since not using turn signal also represents disobedience.
The types of aggressive driving behavior are used in agent-based modeling and simulation to portray the heterogeneity of driving behaviors. It is important that the simulation conducted approximately represents the real world. Thus, to ensure well-representation of simulation, the variety of drivers in term of driving behavior is maintained to be fairly accurate by replicating the actual-world's composition of them.
Agent-based Modeling and Simulation
The agent-based modeling is known as the approach that is able to cover behavioral heterogeneity (Manley et al., 2014). In this study, agent-based modeling is used to discern the heterogeneous behavior of drivers – that are grouped into normal driver, speeding-improperly driver, inattentive driver, and impatient driver – at individual level. In principle, agents can be categorized into simple and complex agents based on their characteristics. In general, drivers interact and adapt to their environment and other agents; drivers are able to learn based on which their behavior can be modified; each agent could act autonomously; and agents are heterogenous. While complex agents are considered to have all of those characteristics, simple agents are lack in one or more of those characteristics.
Regarding characteristics, other variety of agents also arise that consist of reactive and cognitive agents. Compared to cognitive agents, reactive agents lack of ability to learn and change their behavior based on their learning process although they are still trying to adapt. In this study, reactive agents are used in traffic simulation to model the congestion on Simpang Dago. Hence their actions would be more tactical. The options would be speed changing, lane changing, accelerating, decelerating, rules following, and willingness to overtake in order to produce the shortest travel time. In order to pursue the shortest travel time, the driving behaviors could produce congestion especially at the intersection.
The Attribute of Drivers
Each agent is assumed to have varied aggressiveness level that determine the preferred speed. Aggressive driving behavior means that the behavior while driving is influenced by drivers' emotion that might increase safety risk of other drivers (James & Nahl, 2000). As found in this study, there are five types of aggressiveness, namely improper speed, inattentiveness, hostility or violence, impatience, and disobedience of traffic sign / signals. These types of aggressiveness are the result of autonomous behaviors of agents which enable them to be proactive in the effort to arrive at the destination on time. During the attempt to accomplish the goal, the agents react to the surrounding environment.
If the actual travel time exceeds the expected travel time on regular basis, the typical reactions of drivers to compensate that situation are:
o If the observed site is empty, then they may increase the speed of their vehicles.
o If the observed site is crowded because the traffic light is red, then they may break through the traffic light.
o If the observed site is crowded because traffic light malfunction and / or the absence of policemen to manage the traffic, they may compete with other drivers by blocking or taking over the path of other drivers.
The Use of Cellular Automata on Driving Behavior Simulation
Semantic explanation on the previous section can be stated mathematically by the assistance of cellular automata. It is conventionally used in modeling the flow of traffic both in freeway and congested roadway as found on previous studies (e.g. Nagel & Schreckenberg, 1992; Das, 2011). The basic tenets of cellular automata in modeling the traffic is that if a vehicle observes preceding vehicle, the vehicle will be stop moving considering that the preceding vehicle will not move in the next time unit – the time needed to move to the next grid. Hence, in moving to the next grid, the vehicle does not move directly. It follows two rules: one-dimensional rule in X-axis motion and one-dimensional rule in Y-axis motion.
In one-dimensional rule in X-axis motion, the focus of drivers is to move forward without considering their neighbor both in the left and right. Instead of that, the drivers focus on the existence of other vehicles ahead and behind of them. In respect to one-dimensional rule, the plausible type of aggressiveness that might emerged is impatience and inattentiveness. In other words, they might increase or decrease their current speed.
In one-dimensional rule in Y-axis motion, the acceleration and randomization have the possiblity to occur. It means the driver can control the velocity of their vehicles. As a consequence, they can adapt their behavior to the environment including other vehicles, roads, traffic lights, intersection, and people crossing the street.
Environment communicate its condition to agents through the behavior or response of preceding vehicle that includes slowing down or speeding up, the occurrence of an incident, cost of traveling (which in this study is limited to the shortest time and path), and the politeness level of the drivers. Those signals serve as a means of communication between agents and their environment that eventually shape the reasoning of the agents. Thus, based on a given condition, the agents are able to accelerate or decelerate, change the lane or not, change the route or stay on the same route (which is limited in this study), overtake or queuing in line, and being polite to other drivers or the opposite.
All of the explanations above can be summarized in Figure 3 that describe the agent reaction and behavior toward environment in a loop.
· Vehicle a head slow down /speed up
· Incident/event · Cost of Traveling · Initiative/politeness level
Send orders
Simulation
The simulation of traffic condition comprises of existing condition and scenarios related to strategy to reduce congestion in Simpang Dago. The simulation is conducted with the help of NetLogo 5.1.0 software. Numerous scenarios are tested in order to determine the best strategy to reduce congestion caused by aggressive driving behavior in Simpang Dago. In conducting the simulation, each scenario was run for 10.000 iteration and done 20 times. However, before conducting the simulation, calibration of the model is conducted to ensure that the simulation represents the approximate condition of the real world.
The object of simulation is the intersection of Simpang Dag o. Congestion on that intersection can be measured by the value of volume-capacity ratio (V/C) which could be fell between 0 – 1. The closer it gets to 1, the more likely traffic congestion occurs. Based on the data from Dishub Kota Bandung, the average V/C in Dago Street is 0.84.
This is very similar to the approximate V/C value produced by simulation, that is 0.813. Thus, the result of simulation of 220 drivers is able to represents the actual V/C value. From those 220 drivers, 110 drivers are assumed to be normal which made the rest of them are drivers with aggressive driving behaviors. The composition of drivers' type become the emergent properties that can be identified through the number of waiting vehicles. The simulation aims to determine the precise composition of drivers' type that produce the least congestion on Simpang Dago.
The Composition of Drivers Type
As has been previously mentioned, driving behaviour are varied across drivers based on the level of aggressiveness. Therefore, the composition of each drivers' type in the simulation should follow the real world. Its calibration by using weighted average is showed by Table 4. Table 4 shows the percentage of each driver type in the real world. Those percentages reflect the existing condition of drivers' composition on Bandung including Simpang Dago.
Table 4.
The Proportion of Driver's Type
Drivers÷ Type Average of 5 Weighted
Factors Rank
Weighted Average of 3
Significant Factors
% Drivers
Speeding-improperly 2.579124579 5 1.579019698 26%
Inattentive 1.97979798 3 0.40403115 7%
Hostile 1.569023569 2 -
Impatient 2.491582492 4 1.016949153 17%
Traffic-sign
disobedient 0.95959596 1 -
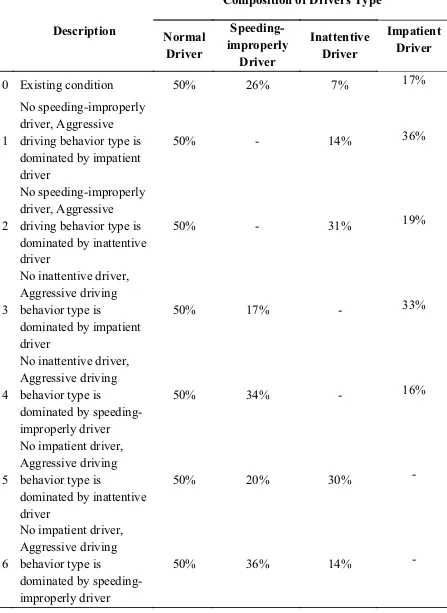
Table 5.
Scenario Development
Description
Composition of Drivers Type
Normal Driver
Speeding-improperly
Driver
Inattentive Driver
Impatient Driver
0 Existing condition 50% 26% 7% 17%
1
No speeding-improperly driver, Aggressive driving behavior type is dominated by impatient driver
50% - 14% 36%
2
No speeding-improperly driver, Aggressive driving behavior type is dominated by inattentive driver
50% - 31% 19%
3
No inattentive driver, Aggressive driving behavior type is
dominated by impatient driver
50% 17% - 33%
4
No inattentive driver, Aggressive driving behavior type is
dominated by speeding-improperly driver
50% 34% - 16%
5
No impatient driver, Aggressive driving behavior type is
dominated by inattentive driver
50% 20% 30% -
6
No impatient driver, Aggressive driving behavior type is
dominated by speeding-improperly driver
Simulation
The simulation of traffic condition comprises of existing condition and scenarios related to strategy to reduce congestion in Simpang Dago. The simulation is conducted with the help of NetLogo 5.1.0 software. Numerous scenarios are tested in order to determine the best strategy to reduce congestion caused by aggressive driving behavior in Simpang Dago. In conducting the simulation, each scenario was run for 10.000 iteration and done 20 times. However, before conducting the simulation, calibration of the model is conducted to ensure that the simulation represents the approximate condition of the real world.
The object of simulation is the intersection of Simpang Dag o. Congestion on that intersection can be measured by the value of volume-capacity ratio (V/C) which could be fell between 0 – 1. The closer it gets to 1, the more likely traffic congestion occurs. Based on the data from Dishub Kota Bandung, the average V/C in Dago Street is 0.84.
This is very similar to the approximate V/C value produced by simulation, that is 0.813. Thus, the result of simulation of 220 drivers is able to represents the actual V/C value. From those 220 drivers, 110 drivers are assumed to be normal which made the rest of them are drivers with aggressive driving behaviors. The composition of drivers' type become the emergent properties that can be identified through the number of waiting vehicles. The simulation aims to determine the precise composition of drivers' type that produce the least congestion on Simpang Dago.
The Composition of Drivers Type
As has been previously mentioned, driving behaviour are varied across drivers based on the level of aggressiveness. Therefore, the composition of each drivers' type in the simulation should follow the real world. Its calibration by using weighted average is showed by Table 4. Table 4 shows the percentage of each driver type in the real world. Those percentages reflect the existing condition of drivers' composition on Bandung including Simpang Dago.
Table 4.
The Proportion of Driver's Type
Drivers÷ Type Average of 5 Weighted
Factors Rank
Weighted Average of 3
Significant Factors
% Drivers
Speeding-improperly 2.579124579 5 1.579019698 26%
Inattentive 1.97979798 3 0.40403115 7%
Hostile 1.569023569 2 -
Impatient 2.491582492 4 1.016949153 17%
Traffic-sign
disobedient 0.95959596 1 -
Table 5.
Scenario Development
Description
Composition of Drivers Type
Normal Driver
Speeding-improperly
Driver
Inattentive Driver
Impatient Driver
0 Existing condition 50% 26% 7% 17%
1
No speeding-improperly driver, Aggressive driving behavior type is dominated by impatient driver
50% - 14% 36%
2
No speeding-improperly driver, Aggressive driving behavior type is dominated by inattentive driver
50% - 31% 19%
3
No inattentive driver, Aggressive driving behavior type is
dominated by impatient driver
50% 17% - 33%
4
No inattentive driver, Aggressive driving behavior type is
dominated by speeding-improperly driver
50% 34% - 16%
5
No impatient driver, Aggressive driving behavior type is
dominated by inattentive driver
50% 20% 30% -
6
No impatient driver, Aggressive driving behavior type is
dominated by speeding-improperly driver
Scenario Development
Aggressive driving behavior could worsen the already congested intersection. Yet, the type of aggressive driving behavior that mostly leads to congestion is remain unknown. Through the use of scenarios, several compositions of driving behavior that highly contribute to traffic congestion are displayed in Table 5.
The Resulting Scenarios
The Scenario 0 represents the existing traffic condition of Simpang Dago in which the group of aggressive drivers is dominated by speeding-improperly driver and followed by impatient and inattentive driver concecutively. The result of this scenario can be used as a benchmark in analyzing several intervened scenarios produced later in this study.
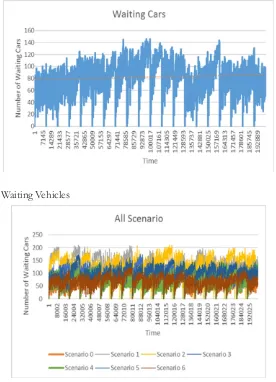
As displayed on Figure 4, the trend of waiting vehicles is slightly increasing. The average waiting vehicles under secenario 0 is 146 out of 220 vehicles included in the simulation or 66%. This figure indicates a congestion is occurred. Therefore, some scenarios with different composition of drivers' type should be proposed in order to reduce the number of waiting vehicles i.e. congestion.
Overall Analysis
Figure 5 summarizes the number of waiting vehicles from all scenarios. Despite of its vagueness, it can be discerned that Scenario 4 and 6 represent the least number of waiting vehicles as compared to other scenarios. Thus, these scenarios can be the alternative strategies in reducing congestion in the intersection of Simpang Dago.
Figure 4.
Scenario 0 – Number of Waiting Vehicles
Figure 5.
All Scenarios – Number of Waiting Vehicles
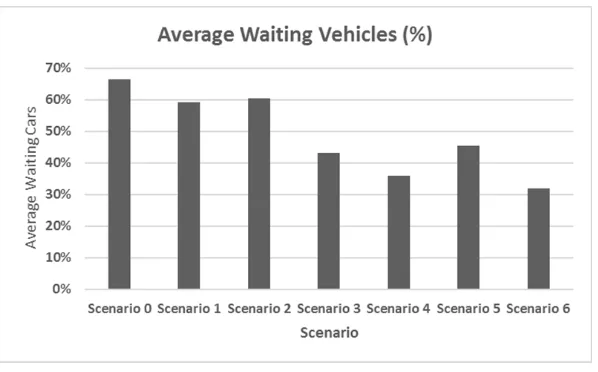
Figure 6 complements the Figure 5 in depicting the average waiting vehicles of all scenarios. It is obvious that Scenario 4 and 6 have the least average waiting vehicles. This result corroborates the result that is showed on Figure 5. However, Scenario 6 represents the best alternative in reducing congestion since it is not only reducing the number of waiting vehicles, it is also more stable. Moreover, in Scenario 6, the trend of average waiting vehicles is also decreasing as time passes.
By considering these findings, it can be decided that the best scenario to be promoted in reducing congestion in Simpang Dago is Scenario 6. In this scenario, the number of impatient drivers is kept at zero and the existence of speeding-improperly drivers exceed inattentive drivers. Therefore, strategies to promote this scenario must be found. Yet, how to do so? The easiest path is to refer to past studies regarding means to eliminate impatient drivers. Firstly, we must seek explanation about the antecedents of impatient driving behavior.
Impatience is “… intolerance to an event that impedes or delays an action or the ability to obtain something” (Naveteur et al., 2013). A study on young drivers (i.e. college students) revealed that impatient driving is more likely to manifest on drivers with low distress tolerance when they face frustrating or challenging situation, e.g. traffic jam or provoking behavior of another driver (Beck et al., 2013).
One of the most provoking driving behavior is weaving through traffic or cutting off (Wickens, 2013). By provoking, it could be meant that this sort of behavior might trigger another aggressive driving behavior (a chain of events). It is possible that the chain of events ended in a more catastrophic event, such as deadly car accidents, rather than a mere traffic congestion.
Different conclusion reached by Kaieser et al. (2016) that propose aggressive driving behavior does not always relate to low distress tolerance. This finding is also supported by Miles and Johnson (2003) that also found that ag gressive drivers tend to perceived themselves as skillful drivers. Thereby, there is a possibility that aggressive driving behaviors brings the same sense of excitement as those found in sport. It supports the hypothesis that increasing the threat of punishment (e.g. fining) to some extent might only increase the reward (i.e. the challenge) of doing such behavior and thus ineffective. Both low distress level and challenge seeking behavior indicate poor emotional stability.
Several strategies have been offered to remedy aggressive driving behavior. Unfortunately, the treatment protocol that based on CBT (cognitive behavioral therapy) toward aggressive drivers, as strategy to eliminate aggressive driving behavior as proposed by Galovski (2002), might be perceived as too
Figure 6.
Scenario Development
Aggressive driving behavior could worsen the already congested intersection. Yet, the type of aggressive driving behavior that mostly leads to congestion is remain unknown. Through the use of scenarios, several compositions of driving behavior that highly contribute to traffic congestion are displayed in Table 5.
The Resulting Scenarios
The Scenario 0 represents the existing traffic condition of Simpang Dago in which the group of aggressive drivers is dominated by speeding-improperly driver and followed by impatient and inattentive driver concecutively. The result of this scenario can be used as a benchmark in analyzing several intervened scenarios produced later in this study.
As displayed on Figure 4, the trend of waiting vehicles is slightly increasing. The average waiting vehicles under secenario 0 is 146 out of 220 vehicles included in the simulation or 66%. This figure indicates a congestion is occurred. Therefore, some scenarios with different composition of drivers' type should be proposed in order to reduce the number of waiting vehicles i.e. congestion.
Overall Analysis
Figure 5 summarizes the number of waiting vehicles from all scenarios. Despite of its vagueness, it can be discerned that Scenario 4 and 6 represent the least number of waiting vehicles as compared to other scenarios. Thus, these scenarios can be the alternative strategies in reducing congestion in the intersection of Simpang Dago.
Figure 4.
Scenario 0 – Number of Waiting Vehicles
Figure 5.
All Scenarios – Number of Waiting Vehicles
Figure 6 complements the Figure 5 in depicting the average waiting vehicles of all scenarios. It is obvious that Scenario 4 and 6 have the least average waiting vehicles. This result corroborates the result that is showed on Figure 5. However, Scenario 6 represents the best alternative in reducing congestion since it is not only reducing the number of waiting vehicles, it is also more stable. Moreover, in Scenario 6, the trend of average waiting vehicles is also decreasing as time passes.
By considering these findings, it can be decided that the best scenario to be promoted in reducing congestion in Simpang Dago is Scenario 6. In this scenario, the number of impatient drivers is kept at zero and the existence of speeding-improperly drivers exceed inattentive drivers. Therefore, strategies to promote this scenario must be found. Yet, how to do so? The easiest path is to refer to past studies regarding means to eliminate impatient drivers. Firstly, we must seek explanation about the antecedents of impatient driving behavior.
Impatience is “… intolerance to an event that impedes or delays an action or the ability to obtain something” (Naveteur, Cœugnet, Charron, Dorn, & Anceaux, 2013). A study on young drivers (i.e. college students) revealed that impatient driving is more likely to manifest on drivers with low distress tolerance when they face frustrating or challenging situation, e.g. traffic jam or provoking behavior of another driver (Beck, Daughters, & Ali,, 2013).
One of the most provoking driving behavior is weaving through traffic or cutting off (Wickens, 2013). By provoking, it could be meant that this sort of behavior might trigger another aggressive driving behavior (a chain of events). It is possible that the chain of events ended in a more catastrophic event, such as deadly car accidents, rather than a mere traffic congestion.
Different conclusion reached by Kaieser et al. (2016) that propose aggressive driving behavior does not always relate to low distress tolerance. This finding is also supported by Miles and Johnson (2003) that also found that ag gressive drivers tend to perceived themselves as skillful drivers. Thereby, there is a possibility that aggressive driving behaviors brings the same sense of excitement as those found in sport. It supports the hypothesis that increasing the threat of punishment (e.g. fining) to some extent might only increase the reward (i.e. the challenge) of doing such behavior and thus ineffective. Both low distress level and challenge seeking behavior indicate poor emotional stability.
Several strategies have been offered to remedy aggressive driving behavior. Unfortunately, the treatment protocol that based on CBT (cognitive behavioral therapy) toward aggressive drivers, as strategy to eliminate aggressive driving behavior as proposed by Galovski (2002), might be perceived as too
Figure 6.
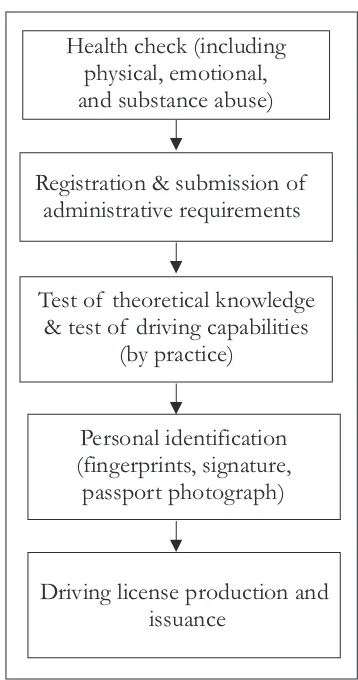
expensive to be applied in most developing countries including Indonesia. In advance implementation of ICT, driving behavior of an individual vehicle can be continuously monitored (vehicle tracking) based on real time GPS tracking that is similar to the offerings of Fleetio Drive (Rarestep Inc, 2018), undesirable pattern can be spotted, and punishment can be imposed accordingly. The similar approach also suggested Cambridge Systematics, Inc. and Texas Transportation Institute (2005) for FHWA (Federal Highway Administration) under a much broader concept of ITS (. However, the more efficient strategy that can be suggested to Indonesian authorities is to scientifically predict, e.g. by using computer-based test, the psychological feasibility (i.e. emotional stability) of driving license applicants. The test should also be repeated periodically when drivers need to extend their driving license.
In Indonesia, to get driving license, one must obtain health certificate, including verified emotional health statement (i.e. surat keterangan sehat rohani) of the candidate, issued by licensed psychiatrist (Figure 7). However, evidences about the methods used and their effectiveness are difficult to be found. Moreover, for developing countries with insufficient land transportation facilities, the threshold of emotional stability level - as the condition that must be met by drivers to be granted driving license - should be somewhat higher compared to those countries with better land transportation facilities. This is due to poor public transportation facilities and inadequate traffic management system.
Despite of the strategy suggested, it is still important to commit further studies to completely identify the motivations behind ag gressive driving behaviors among Indonesian drivers. The rationale of this suggestion is that each motivation might need different solution or policy. That kind of information might greatly help concern parties to find creative means to effectively mitigate aggressive driving behaviors efficiently.
Figure 7.
The Summary of Driving License Issuance Process in Indonesia (adapted from Wiyono et al. (2012))
Conclusion
This study manages to produce several important findings. Firstly, the aggressive driving behaviors in Bandung can be grouped into five factors namely improper speed, inattentiveness, display of hostility or violence, impatience, and disobedience of traffic sign/signals. Secondly, based on the simulation, the factor that possess the most contribution to congestion in Simpang Dago is impatient drivers as showed on scenario 6. Hence to reduce the congestion, the number of impatient drivers should be kept at zero. Based on past studies, several alternatives also offered in this research. However, further studies are still needed to formulate effective treatment to mitigate impatient drivers.
Health check (including physical, emotional, and substance abuse)
Registration & submission of administrative requirements
Test of theoretical knowledge & test of driving capabilities
(by practice) reactive to social behavior. W. Bugard, T. Cristaller, & A. B. Cremers (Ed.),
rd
Proceeedings of the 23 Annual German Conference on Artifical Intelligence (pp. 303–306). Doi: 10.1007/3-540-48238-5_28
Beck, K. H., Daughters, S. B., & Ali, B. (2013). Hurried driving: Relationship to distress tolerance, driver anger, aggressive and risky driving in college students. Accident Analysis & Prevention, 51, 51-55. Elsevier. doi: 10.1016/j.aap.2012.10.012
Burmeister, B., Haddadi, A., and Matylis, G. (1997). Application of multi-agent systems in traffic and transportation. IEE Proceedings – Software Engineering, vol. 144, issue 1 (pp. 51–60). doi: 10.1049/ip-sen:19971023.
Federal Highway Administration of United States. Cambridge Systematics, Inc. & Texas Transportation Institute. (2005). Traffic Congestion and Reliability: Trends and Advanced Strategies for Congestion Mitigation. R e t r i e v e d f r o m : https://ops.fhwa.dot.gov/congestion_ report/congestion_report_05.pdf Das, S. (2011). Cellular automata based traffic
model that allows the cars to move with a small velocity during congestion. Chaos, Solitons & Fractals, 44(4), 185-190. Doi: 10.1016/j.chaos.2011.01.012.
Galovski, T., & Blanchard, E.B. (2002). Psychological characteristics of agressive drivers with and without intermittent explosive disorder. Behavior Research & Therapy, 40(10), 1157-1168. Doi: 10.1016/S0005-7967(01)00083-3 Hager, K., Rauh, J. and Rid, W. (2015).
Agent-based modeling of traffic behavior in g r o w i n g m e t r o p o l i t a n a r e a s . Transportation Research Procedia, 10, 306-315. Doi: 10.1016/j.trpro.2015.09.080.
Jain, V., Sharma, A., & Subramanian, L. (2012). Road traffic congestion in the aggressive driving: steering clear of highway w a r f a r e. A m h e r s t , N e w Yo r k : Prometheus Books.
Kaiser, S., Furian, G. and Sclembach, C. (2016). Aggressive behaviour in road traffic – findings from Austria. Transportation Research Procedia, 14, 4384-4392. Elsevier. Doi: 10.1016/j.trpro.2016.05.36
Khalesian, M., & Delavar, M. R. (2008). A multi-agent based traffic network micro-simulation using spatio-temporal GIS. Center of Excellence in Geomatics Eng. and Disaster Management, 10, 31-36. Retrieved
f r o m :
http://citeseerx.ist.psu.edu/viewdoc/d ownload?doi=10.1.1.184.2430&rep=re p1&type=pdf
Ljubović, V. (2009). Traffic simulation using agent-based models. XXII International Symposium on Information, Communication and Automation Technologies (ICAT), 1-06.
I E E E . D o i :
10.1109/ICAT.2009.5348417
Manley, E., Cheng, T., Penn, A., & Emmonds, A. (2014). A framework for simulating large scale complex urban traffic dynamics through hybrid agent-based modelling. Computers, Environment and Urban Systems, 44, 27–36. Elsevier. doi: 10.1016/j.compenvurbsys.2013.11.003 Macal, C. M., & North, M. J. (2010). Tutorial on
agent-based modelling and simulation. Journal of simulation, 4(3), 151-161. R e t r i e v e d f r o m : https://link.springer.com/content/pdf /10.1057/jos.2010.3.pdf