Published online July 20, 2014 (http://www.sciencepublishinggroup.com/j/aff) doi: 10.11648/j.aff.20140304.11
ISSN: 2328-563X (Print); ISSN:2328-5648 (Online)
Predicting growth and yield models for
Eucalyptus
species in Aek Nauli, North Sumatera, Indonesia
Siti Latifah
1, Teodoro Reyes Villanueva
2, Myrna Gregorio Carandang
2,
Nathaniel Cena Bantayan
2, Leonardo M. Florece
31
Forestry Program Study, Sumatera Utara University, Medan, Indonesia
2
Forest Resources Management, University of the Philippines Los Banos, Los Banos, Philippines
3
Environmental Science, University of the Philippines Los Banos, Los Banos, Philippines
Email address:
sitilatifah [email protected] (S. Latifah), [email protected] (TR. Villanueva), [email protected] (M. G. Carandang), [email protected] (NC. Bantayan)
To cite this article:
Siti Latifah, Teodoro Reyes Villanueva, Myrna Gregorio Carandang, Nathaniel Cena Bantayan, Leonardo M. Florece. Predicting Growth and Yield Models for Eucalyptus Species in Aek Nauli, North Sumatera, Indonesia.Agriculture, Forestry and Fisheries.
Vol. 3, No. 4, 2014, pp. 209-216. doi: 10.11648/j.aff.20140304.11
Abstract:
This study was conducted primarily to develop a yield prediction model for Eucalyptus spp plantations in Aek Nauli, North Sumatera, Indonesia as a contribution to sustain development and management of forest plantations. Data for growth and yield model were collected from the inventory and permanent sample plots (PSPs).The data in this study used 650 rhombic plots consisting of 106 PSPs and 544 inventory plots with several variations of plot size. Stands’ features referred to diameter, height, merchantable volume, age, species, spacing, site index, basal area, and density of Eucalyptusspecies. Models using initial age, specifically, model 2 was found consistently to be the best model in most Eucalyptus
plantations. Among the models using initial and projection age, model 4 was the better one. Model 2 using original ages looks better than model 4 because of it is being more reliable and its sigmoid growth curve. Nonetheless, significant differences were noticed between different models for predicting the merchantable volume of Eucalyptus spp. Plantations. Growth and yield models can be used to identify the best growing species of Eucalyptus spp. E. hybrid is recommended for plantation in this study area because it had the highest of merchantable volume.
Keywords:
Eucalyptus, Growth, Yield, Merchantable Volume, Forest Plantation1. Introduction
Indonesia is the world's largest exporter of tropical timber, generating income of US$ 5 billion annually, and more than 48 million hectares (55 per cent of its remaining forests) are earmarked for logging.. During 1990- 2005, the country lost more than 28 million ha of forest indicating annual change in forest cover of -1,871,400 ha or annual deforestation rate of 2.0 per cent. Total forest loss since 1990 is around 24.1% (Mongabay, 2006).
One potential method for reducing tropical forest destruction is the creation of environmentally sustainable plantations that can supply wood and paper pulp product in order to reduce demand for wood from virgin forest (Hartono, 2002).
The Government of Indonesia is developing timber estates to increase forest sector wood products. Wood
industries are increasing rapidly; they need more than 40 million m3 of wood production every year. This cannot be supplied from the country’s natural forests alone and Indonesia, thus, need developing forest plantations. These programs are executed by private companies with forest concession areas (e.g. Industrial Timber Estate or HTI_ Hutan Tanaman Industry ) or State Forest Corporations (e.g. Perhutani and Inhutani) (Pramono and Agung, 1996).
In this case, Indonesian government policy will help rapid increase in Eucalypt plantations for industrial wood use. Eucalyptus is favored for its rapid growth, indigenous origin and multipurpose use. Its major uses in Indonesia are for pulp (PT. TPL, 2008). Sumatera However, in Indonesia, the estimation of yield and growth model for
Growth modeling of plantation timber species is a vital tool for predicting yield from future harvesting and financial returns. One important criterion of sustainable forest management is long term maintenance of yield. These requirements have implications for model design, its
implementation and commercial use. For robust
predictions, reliable models and input data of high accuracy are a must. Sustained yield regulation is a prerequisite for sustainable management of forest resources. Its importance is recognized internationally in developing standards for sustainable forest management following ITTO guidelines' Principle 17. In order to ensure a sustained production of timber from each forest management unit, a reliable method for controlling timber yield should be adopted (ITTO, 1990).
One of the three essential elements of forest management is prognosis, that is, growth and yield prediction. Forest cannot be managed without proper information on the future availability of wood and/or-sub product ( Bantayan, 2006). Such information is obtained by growth and yield models. According to Vanclay (2003), there are many good reasons for building models. Building a model can help to analyze data from experiments and observation plots. It can help to focus research plans and to anticipate results, so that measurement programs and techniques can be planned accordingly. Modeling may be the most efficient way to examine experimental data, investigate implications and formulate optimal silvicultural guidelines
For these reasons, managing these forests has greatly increased the demand for accurate growth and yield information on forest management. Thus, this study essentially seeks to answer the questions: (1) what is the growth and yield performance of Eucalyptus plantations in Aek Nauli, North Sumatera Indonesia?; (2) What factors (as independent variables) are related to the stand yield?;(3)
Which is the best growing species of Eucalyptus
plantations ?
2. Material and Method
2.1. Study Site
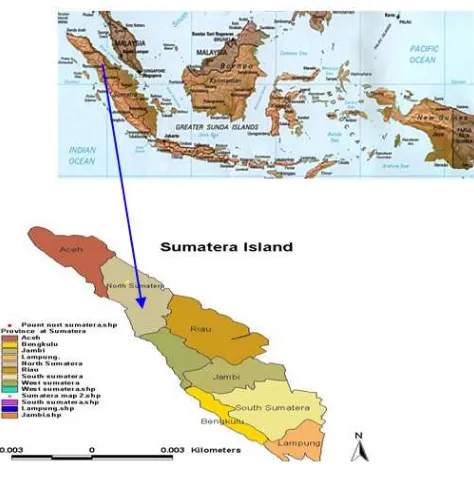
The study was conducted in Aek Nauli sector of the Industrial Timber Estate (Hutan Tanaman Industri - HTI) namely, PT. Toba Pulp Lestari (PT. TPL), from December 2008 – March 2009. It is in the territorial jurisdiction of Porsea subdistric, Simalungun regency, North Sumatera Province, Indonesia (Figure 1). The study area whose plots were used in the study belongs to climate A based on Schmith and Ferguson (1951). It has the highest annual rainfall in October and the lowest in August. Based on its topography, the study area has a rainfall range of 85 – 434 mm/month, it has an elevation range from 350 to 1400 msal and it has top soil depth ranges from 10 to 44 cm. The study area covered an area 189,975 ha with Aek Nauli sector has an area 21341.8 ha (Figure 1). Geographically, it is located between 02° 40’00” to 02° 50’00” north latitude and 98°
50’00” to 99° 10’00” east longitude.
Figure 1. Location of study site
2.2. Materials
The data in this study used 650 rhombic plots consisting of 106 permanent sample plots (PSPs ) and 544 inventory plots with several variations of plot size, from 0.02 to 0.04 ha. PSPs have an area of 3.44 ha. It consisted of 106 plot or 273 observations. Inventory plot has an area of 21.76 ha. It consisted of 544 plots (Table 2). Thus, the total area of the plots in this study site is 25.2 ha.
Each selected sample plot was located in an area where the stand was of even age, uniformly spaced, and disease free. Ten percent (10%) of total plots equal to sixty five (65) rhombic plots were taken with random samples from inside 650 plots which were used for validation of the yield model. Dependent variable of the yield stand was merchantable volume. Based on the analyses of factors affecting yield, growth and yield were expressed as a function of independent variables (Davis, 2001). Generally, yield (V) is considered to be a function of basal area, top height, age, site index, stand density, spacing as stand variables while top soil, rain fall, slope, elevation, and type of soil as geographic variables.
Species were grouped into E. hybrid, E. grandis (E.gra),
E. pellita, E. urophylla (E. uro), mixed Eucalyptus, and all
Eucalyptus species. The data sets for the model were derived from 470 E. hybrid, 94 E.grandis, 23 E. pellita, 46 E. urophylla and 119 mixed E. observations. E. hybrid is breeding from E. urophylla vs E. grandis and E. pellita vs E. grandis. Mixed Eucalyptus observations consisted of
E.hybrid, E.grandis, E. pellita, and E. urophylla species. 2.3. Data Analysis
height, density and weight. Also, they can be measured in value, which is the measure of economic and social interest. In this study area, focus concentrated on physical measures of growth and yield namely, merchantable volume, because it forms the basis of value measures.
There have been many general forms of standard volume equations presented by many authors for a variety of conditions. There is no specific equation which is generally applicable and valid for all species. When tree volume is expressed as a function of both height and diameter, the relationship is called standard volume equation.
The regression equations used the logarithmic transformation models which were modified from the best model developed by some research such as that of Silva et al (2007), Pereira et al (2006), Yue et al ( 2007) ,Villar (2005), Aswandi (2000) Bi et al., ( 1994), Bennet (1970) as cited by Clutter (1983), Sullivan and Clutter (1972). For the purpose, the following equations were generated. The models tested are shown in Table 1.
Table 1. Regression models tested for estimating growth and yield for
Eucalyptus spp
V= merchantable volume in cubic meter per hectare
V1= merchantable volume in initial ages in cubic meter per hectare
V2= merchantable volume in projection ages in cubic meter per hectare
BA= basal area in square meters per hectare
TH= top height in meter
Age= original age in year
Age1 and Age 2 = initial and projection ages in year SI= site index in meter
SD= stand density (tree/ha)
SP= original spacing in square meters; TS= depth of top soil in centimeter (cm)
R= rain fall monthly (mm)
SL= slope in percent (%)
E= elevation in masl
DA, DB, DC and DD= dummy variable for group of soil
ln= natural logarithm or logarithm to the base
2.718281828
b0, b1,….bn = regression coefficient 1,2,3= model using original age
4,5,6 = model using initial and projection ages
One approach to simplifying multiple regression equations is the stepwise regression. The procedure is probably the most widely used method for subset regression analysis (ANALYSTSOFT, 2008).
All equations were tested to determine which one is the best predictor of growth and yield for Eucalyptus species.
The merchantable volume models were tested and respective fits of each the models were mainly assessed using criteria as follows:
1. The best model is the one which gives the largest coefficients of determination (R2) and coefficients of correlation (r), smallest mean square error (MSE) and values of Mallow’s C(p) and Variance Inflation Factor (VIF)
4. Randomness of the residual as shown in the graph of the residual error values versus fitted merchantable volume values;
5. Considers the parsimony of parameters. It is a subset of the independent variables which have to be small enough to manage cost and analysis facilitated but large enough for adequate description, control or prediction. That means, when all the leading equations appear to fit the data equally well, the simplest equation should be chosen as the best model.
The criteria that determine the best model is weighted with each criterion in the same scale as follows:
Score of weighted = [ (R2) + (r) - (MSE) – (Cp) + (Σ independent variables are significant / Σ independent variables in the model ) + (Σ independent variables are not multicollinerity / Σ independent variables in the model )]
The model selected should provide the highest accuracy as the models are verified against a separate set of yield data.
where :
χ2 C = is the chi-square value calculated α = level of significance
n = number of observations Oi = observed value Ei = expected (true) value
3. Results and Discussion
3.1. Selecting the Best Model
The regression equations were tested using several candidate regressions from non-linear models. When the relationship is non –linear, the model should be based on the nature of the curve representing given relationship. Two general types of equations are commonly used in regression analysis involving variables that exhibit non-linear relationship namely polynomial and exponential equations. These equations can be transformed into linear equations thru polynomial or logarithmic transformation.
Forest growth models in this study involving the logarithm of merchantable volume are the dependent variable. The use of the logarithm of yield as dependent variable is a convenient way to mathematically express the interaction of the independent variables in their effect on yield. Stand age, in most yield analysis, has been expressed as a reciprocal to allow for the ‘leveling off’( asymptotic) effect of yield with increasing age. Site index is not often transformed prior to fitting, but sometimes logarithmic or reciprocal transformations are employed. In some models, height of dominant stand has been used in conjunction with age and the variable site index eliminated. The measure of
stand density is commonly subjected to logarithmic transformation, particularly in models employing basal area, but the exact form in which density is included is quite variable, especially for plantation models which utilize number of trees per unit area as an independent variable. (Avery and Burkhart, 1994 )
The regression equations used two groups of independent variables. One group ( model 1, 2 and 3) used original age, the basal area, height, site index, stand density, spacing, top soil, rain fall, slope, elevation and type of soil as independent variable. The other group used initial and projection age, volume, the basal area, height, site index, stand density, spacing, top soil, rain fall, slope, elevation and type of soil in initial age as independent variable.
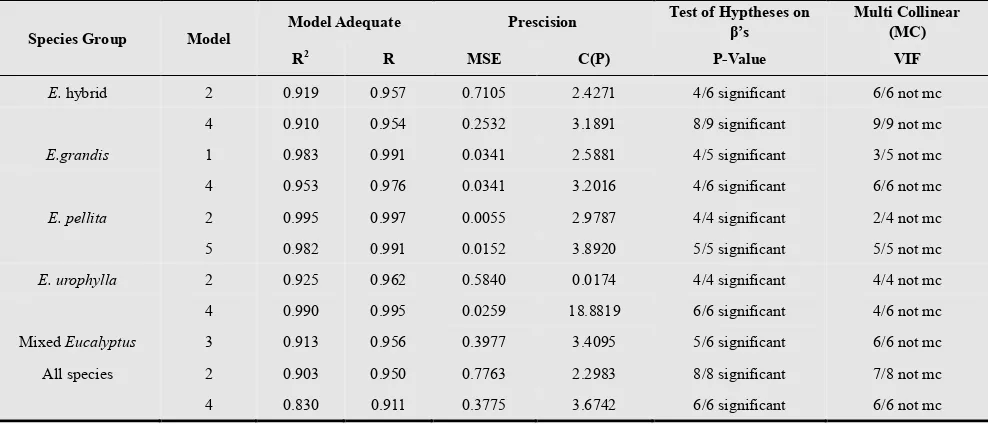
Among the models using initial age, model 2 of the stepwise procedure was found consistently to be the best model because it was accepted in almost Eucalyptus species groups and also the model had the highest of the coefficients of determination (R2) and coefficients of correlation (r), and the lowest mean square error (MSE) and Mallow's C(p), almost all independent variables are significant and also almost the independent variables is not multicollinerity. Similarly, among the models using initial and using initial and projection age, model 4 was the best (Table 2)
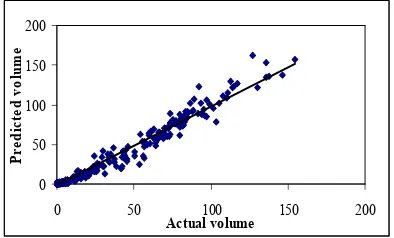
3.2. Validation
Model validation is possibly the most important step in the model building sequence. It is also one of the most overlooked. A good representation of how the effectiveness a yield model as a predictive tool is its behavior in a real situation. Figure 2 and 3 show the comparison of graph between the actual data and predicted data by the best models for all species group. The angle between Y-axis and a line on the graph is nearly 450 . Likewise is the angle between X- axis and a line on the graph.
Table 2. Coefficients of determination (R2), coefficients of correlation (r), mean square error (MSE), and Mallow's C(p), P-value and VIF among the best
models
Species Group Model
Model Adequate Prescision Test of Hyptheses on β’s
Multi Collinear (MC)
R2 R MSE C(P) P-Value VIF
E. hybrid 2 0.919 0.957 0.7105 2.4271 4/6 significant 6/6 not mc
4 0.910 0.954 0.2532 3.1891 8/9 significant 9/9 not mc
E.grandis 1 0.983 0.991 0.0341 2.5881 4/5 significant 3/5 not mc
4 0.953 0.976 0.0341 3.2016 4/6 significant 6/6 not mc
E. pellita 2 0.995 0.997 0.0055 2.9787 4/4 significant 2/4 not mc
5 0.982 0.991 0.0152 3.8920 5/5 significant 5/5 not mc
E. urophylla 2 0.925 0.962 0.5840 0.0174 4/4 significant 4/4 not mc
4 0.990 0.995 0.0259 18.8819 6/6 significant 4/6 not mc
Mixed Eucalyptus 3 0.913 0.956 0.3977 3.4095 5/6 significant 6/6 not mc
All species 2 0.903 0.950 0.7763 2.2983 8/8 significant 7/8 not mc
4 0.830 0.911 0.3775 3.6742 6/6 significant 6/6 not mc
0
Figure 2. Actual and predicted volume all species group using original age
The capability of any prediction model to give accurate estimates is the real test for any such model. It is not necessary to establish that a model is “perfect”, which is probably impossible because all models are abstractions of reality. But it is important to establish that the model is correctly implemented and free of errors. To test the accuracy of the yield model whether the model particularly follows the real world or not, two sets of observations were used in testing the goodness of fit of the yield model using chi-square (χ2) test.
Based on the results of computation, it can be concluded that there is no significant difference between the actual and the predicted value of merchantable volume. This was because p-value of the chi-square (χ2) of the model using original ages for E. hybrid, E.grandis, E. pellita, E. urophylla, E. mix and all species observations, respectively is 0.1601, 0.7587, 0.9952, 0.6191, 0.9999 and 0.0557 while p-value of the chi-square (χ2) of the model using initial and projection ages for E. hybrid, E.grandis, E. pellita, E. urophylla, and all species observations, respectively is 0.0505, 0.707, 0.3279, 0.2934 and 0.0538. The p-value of the chi-square (χ2) of both group models is greater than the corresponding 0.05 level of significance
Figure 3. Actual and predicted volume all species group using initial and
projection age
The residual plot is the best model shown which offers a good example of what a problem-free plot should look like (Figure 4.). The residual plot is the best model shown which offers a good example of what a problem-free plot should look like. There are no curved trends in the plot, the average
of the residuals is zero, and the points are equally represented about the x-axis. This residual represents the difference between the observed response merchantable volume and the value predicted by the regression line. If the regression model represents the data correctly, the residuals should be randomly distributed around the line of error = 0 with zero mean.
Figure 4. Example of residuals plotted of all Eucalyptus species for the best
model (model 2) using original ages
Both the best models using original ages and using initial and projection age are precise enough since there no significant differences in results compared to those using the chi-square method. Both models are biologically realistic, because all independent variables of both models follow the logical factors affecting yield. Models using original age are better than models using initial and projection age because it had the highest total weighted score for those criteria and also it is more reliable because the growth of stands follows a sigmoid shape of the curve. (Figure 5 and 6.)
0
Figure 5. Yield curve for all Eucalyptus species using original ages
0
Figure 6. Yield curve for all Eucalyptus species using initial and projection
3.3. The Application of the Best Model to Get the Best Growing Species
The timber properties of grown Eucalyptus in the past have proven to have problems, but with the current increased interest in biomass for fiber and energy production, Eucalyptus species may now have a commercially viable endues. Various Eucalyptus species have been planted in Aek Nauli sector with varying degrees of success. As mentioned in the beginning of this chapter, in this study area, the species are grouped into E. hybrid (E.hyb), E. grandis
(E.gra), E pellita E. urophylla (E. uro), E. Mix and E all
species. The problem is in deciding which species to plant that have high productivity. The author would like to find out if these six group species produce different average merchantable volumes. These yields were obtained by the prediction value of merchantable volume.
Models allow us to forecast future trends thereby helping
us make more effective decisions (Villanueva,
2005) .Models using initial age was selected as the best
Pereira et al (2006) reported that the prediction equation for Eucalyptus grandis in central Western region of Minas Gerais Brazil, including age, site index and basal area were fitted. These models fitted were also found to be good enough to predict growth and yield in E. grandis plantations in North Sumatera, Indonesia (Aswandi, 2000).
Table 3. Analyses models of variance (ANOVA) of the different yield
prediction for the E. hybrid, E.grandis, E. pellita, E. urophylla, mixed Eucalyptus and all species
SV SS DF MS F P-Valu
Based on the result of the analysis of variance using the six models , it can be concluded that there is significant difference between models among them to predict the merchantable volume of eucalyptus species. This is because the value of test statistic F is 42.782 is greater than the corresponding tabular F value of 2.22 at 0.05 level of significance ( Tabel 3). Consequently, each Eucalyptus species has the specific model to predict the yield.
When the result of ANOVA indicates significant hybrid, E. grandis, E. hybrid and all eucalyptus species. It is because p-values are 0.078 and 0.124, respectively which are greater than 0.05 of level significance .
0.9405 5.4773 E. urophylla E. mix E. all species
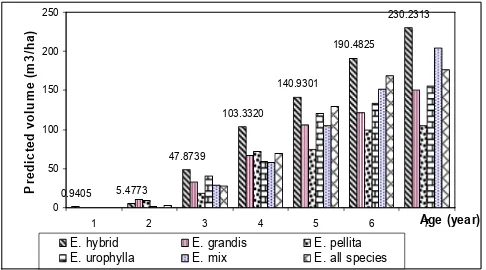
Based on the specific model for every Eucalyptus spp. to predict the yield, Figure 7 shows the graph for each
Eucalyptus species. This figure indicates that E. hybrid
observations has the highest (230 m3 ha-1) of merchantable volume in year 7 and E.pellita observations has the lowest (104 m3 ha-1) of merchantable volume in year 7.
E. hybrid has the highest (230 m3ha-1) of predicted volume in year 7 with final model V = exp [ 0.12043 + 0.46844 ( ln BA*ln TH) -1.84144 (Age-1) + 0.03701 ( TS) + 0.00129 ( R) + 0.14059(DC) ]. It means that there is an increase in volume by 0.46844 per unit increase in multiple basal area with top height holding other independent variables constant. There is a decrease in volume by 1.84144 per unit increase in reciprocal age holding other independent variables constant. There is an increase in volume by 0.03701 per unit increase in depth of top soil holding other independent variables constant. There is an increase in volume by 0.0129 per unit increase in rainfall holding another independent variables constant and last there is a increase in volume by 0.14059 per unit increase in dummy variable for group of soil holding another independent variables constant.
The wrong choice of the species on a given site, wrong site selection for a given species and lack of tending operations were the principal factors for the low yield. It is assumed that the highest of merchantable volume is E. hybrid; the recommended plantation for this study area is
E. hybrid. This species is suitable, as suggested by International development agencies, because the breeding new crops is important for ensuring sustainable forest management by developing new varieties that are
higher-yielding, resistant to pests and diseases,
drought-resistant or regionally adapted to different environments and growing conditions.
4. Conclusions
In relation to the objectives of the study, there are several conclusions reached as follows:
1. Based on six criteria used in this study, Model 2 using original ages can be applied to accurately growth and yield at study site. Each Eucalyptus species have the specific model to predict growth and yield for the study site.
2. There are eight independent variables affecting the yield of Eucalyptus namely basal area, height, age, site index, spacing, depth of top soil, rainfall and group of soil.
3. The quality of predictions obtained from any type of growth and yield model will depend on the availability of suitable data to calibrate and to initialize the model before each simulation.
4. With the highest value of averages merchantable volume at 7 year, Eucalyptus hybrid is the best growing species to be planted at the study site.
Acknowledgement
This research is part of PhD thesis of the first author funded by SEAMEO-BIOTROP DIPA 2008. The authors extend deeply acknowledgment to the Ministry of Education and Culture – Republics Indonesia for scholarship and support to accomplish this paper. Sincerely appreciation is also extended to anonymous reviewer for correction and Measurement. Fourth Edition. New York: McGraw-Hill, Inc. 408 pp.
[3] ASWANDI, 2000. Growth and Yield of Eucalyptus grandis Hill ex Maiden at Aek Nauli Simalungun. North Sumatera. [4] BANTAYAN, N.C. 2006. Gis in the Philippines :
Principles and Applications in Forestry and Natural Resources. First Edition. Published by PARRFI and AKECU. Philippines
[5] BENNET, F. A. 1970. Yield and Stand Structural Patterns for Old Field Plantations on Slash Pine. U. S. D. A. For. Serv., Res. Paper SE-60.
[6] BENNET, F. A. 1970. Yield and stand structural patterns for old-field plantations of slash pine. U.S.D.A. For. Serv., res. Paper SE-60
[7] BI, H., O. CHIKUMBO, and V. JURSKIS. 1994. Yield Equations for Regrowth Forests Regenerated From Fire on
The Southeast Coast of New South
Wales.http://www.daff.gov.au/__data/assets/pdf_file/0017/5 0462/nsw_ed_frm5.pdf
[8] CLUTTER, JL, J.C. FORTSON, L.V. PIENAAR, G.H. BRISTER, and R.L. BAILEY. 1983. Timber Management: A quantitative approach. Canada: John Willey & Sons, Inc. 332 p
[9] DAVIS, L.S., K.N. JOHNSON, P.S. BETTINGER and T.E. HOWARD. 2001. Forest Management to Sustain Ecological, Economic and Social Values. McGraw-Hill Companies, Inc. 1221 Avenue of the Americas, New York. NY 10020. 804 p.
[10] HARTONO, B.T. 2002. Can Forest Plantations Alleviate Pressure on natural Forest? an Efficiency Analysis in Indonesia. Research Report no. 2002- RRI in Economy and Environment Program for Southeast Asia.
[11] ITTO. 2001. Annual Review and Assessment of The World Timber Situation.
[12] ITTO. 1990. ITTO Guidelines for The Sustainable Management of Natural Tropical Forest. ITTO Policy Document Series, I., Policy Development Series 1. ITTO, Yokohama, 18 pgs.
[13] MONGABAY. 2006. INDONESIA.
[14] PEREIRA AJ, HELIO G.L, JOAO C.C.C, AND AGOSTINHO L.S. 2006. Use Data from Permanent Sampling Point in Growth and Yield Modeling. Http://www.scielo.br/scielo.php
[15] PERSEROAN TERBATAS TOBA PULP LESTARI (PT. TPL). 2008. Site Productivity Mapping.
[16] PERSEROAN TERBATAS TOBA PULP LESTARI (PT. TPL). 2008. Summary of the Annual Work Plan Efforts Timber Forest Products Utilization in the Industrial Timber Plantation Forests.
[17] PRAMONO, I.B. and A. PUDJIHARTA. 1996 Research Experiences on Eucalyptus in Indonesia. http://www.fao.org/docrep/005/AC772E/ac772e09.htm. [18] SILVA, A. L., JOAO, C. C. C., HELIO, G. L. AGUSTINHO,
L. D. S., and PABLO, F. L. 2007. Growth and Yield Prediction Using The Modified Buckman Model. Revista. Árvore vol.30 no.5 Viçosa Sept./Oct. 2006.
[19] SULLIVAN, A. D., and J. L.. CLUTTER. 1972. A simultaneous growth and yield model for loblolly pine. For. Sci. 18: 76-86.
[20] VANCLAY, J.K. 2003. Growth Modeling and Yield
Prediction For Sustainable Forest Management. Paper presented at the ITTO Workshop on Growth and Yield, 24-28th June 2002. Kuala Lumpur, Malaysia. http://jkv.50megs.com/R083_mf.pdf
[21] VILLAR, R. G. 2005. Optimization Model Based on Geographic Information System for a Forest Production Unit in Bukidnon, Philippines. PhD Dissertation Institute of Renewable Natural Resources. University o the Philippines Los Banos, Laguna, Philippines
[22] VILLANUEVA, T. R. 2005. Upland Ecosystem Management. Second Edition. University of the Philippines. Open University, Laguna, Philippines.
[23] WEI, X, and NUNO M.G.B. 2000. Genetic Gains and Levels of Relatedness From Best Linier Unbiased Prediction Of Eucalyptus Europhylla for Pulp Production In Southeastern China. Canadian Journal Of Forestry Research. 30 (10): 1601-1607