http://dx.doi.org/10.17503/Agrivita-2014-36-1-p033-047
STRUCTURE OF SOIL FOOD WEB IN SMALLHOLDER COCOA PLANTATION,
SOUTH KONAWE DISTRICT, SOUTHEAST SULAWESI, INDONESIA
Laode Muhammad Harjoni Kilowasid1)*, Tati Suryati Syamsudin2), Endah Sulystiawati2) and Fransiscus-Xaverius Susilo3)
1) Department of Agrotechnology, Faculty of Agriculture, Halu Oleo University, Jl. HEA Mokodompit 93231 Kendari, Southeast Sulawesi Indonesia,
2) School of Life Science and Technology, Bandung Institute of Technology, West Java, Indonesia 3) Department of Agrotechnology, Faculty of Agriculture, Lampung University, Bandar Lampung Indonesia
Corresponding author Phone:+62-401-3193596 Email: [email protected]
Received: February 26, 2014 / Accepted: May 22, 2014
ABSTRACT
An understanding of the structure of the soil food web is critical in determining the practices of soil fertility management based on the biological processes in tropical agricultural regions. The objectives of the study were to assess the variation in trophic level biomass and to analyze the dynamics of the energy channels on the increasing age of cocoa plantation. The characteristics of soil food web structure in smallholder cocoa plantation aged 4, 5, 7, 10, and 16 years were analyzed. The results showed that only biomass at the third trophic level increased with plantation age, but not for the biomass at the lower trophic levels. Biomass in all energy channels did not increased as well along with plantation age. We concluded that variation in the soil food web structure was more influenced by biotic factors of macro-arthropods group, such as facilitation, recolonization capabilities and accessibility in the soil habitat of smallholder cocoa plantation.
Keyword: biomass, biotic, energy channel, trophic level
INTRODUCTION
The process of decomposition and nitrogen mineralization involves trophic inter-action between soil fauna and microbes in soil food web (Schimel and Bennett, 2004; Osler and Sommerkorn, 2007). Structures of soil food web are playing an important role in explaining the effect of changes in the composition and diversity of species on the pathway in decomposition and nitrogen mineralization by soil biota community
(Berg et al., 2001; Holtkamp et al., 2011). Soil organic matter and root are the primary energy source for microbes and soil fauna (Moore et al., 2004; Petchey et al., 2010). Fraction of soil organic matter is labile organic fraction that can be accessed by bacteria, fungi as well as saprophagous macro-arthropods, and recalcitrant organic fraction which is generally more accessible by fungi and saprophagous macro-arthropods (Hunt et al., 1987; Coleman, 2008).
Energy and nutrients from soil organic matter supplied occupying at the higher trophic level can go through the channels of bacterial, fungal, and saprophagous macro-arthropods in soil food web community (Susilo et al., 2004; Moore et al., 2005; Bardgett and Wardle, 2010). The process of nutrients in bacterial biomass flowing into bacterivore up to the top predators is known as bacterial energy channel, while the nutrients from fungal biomass flowing into the fungivora up to the top predators is known as fungal energy channel, and nutrients from root biomass flowed by nematodes and root-feeding insects up to the top predator is known as root energy channels (Moore and Hunt, 1988; Moore et al., 1988; Berg et al., 2001). Moreover, nutrients flowing from saprophagous macro-arthropods biomass to their consumer and finally up to the top predator could be reffered as saprophagous macro-arthropods energy channel in soil food web community.
34
Laode Muhammad Harjoni Kilowasid et al.: Structure of Soil Food Web in Smallholder Cocoa ...
al., 2008). Didden et al. (1994) found the biomass of fungivore soil fauna more dominant than bacterivore soil fauna biomass in agricultural systems minimized in soil tillage, use of inorganic fertilizers, and biocides. The biomass ratio of fungi to bacteria, biomass ratio of fungal energy channels to bacterial energy channels, and biomass ratio of bacterivore to fungivore in the former agricultural land was lower than that of the natural forest land (Holtkamp et al., 2008). Root biomass does not only contribute to soil organic matter content (Hertel et al., 2009), but it also serves as carbon and nutrient source for soil fauna. Biomass of root-feeding nematodes tend to decrease with age of vegetation (Holtkamp et al., 2008), for it is allegedly associated with increased concentrations of defense compounds (i.e. terpenoids) in root tissues, so it is not easily root-feeding insects and saprophagous macro-arthropods (Doblas - Miranda, 2009).
An understanding of the dynamics of the energy channels in the soil food web is critical in determining the regulation of agricultural soil fertility management practices based on biological processes in tropical environment (Swift, 1997). However, studies related to the dynamics of the soil food web structure in the tropical agroecosystem, especially in smallholder cocoa plantation are still neglected. Indonesia was in the world’s third rank, and it was in the first rank in Asia-Pacific as cocoa bean producer (ICCO, 2010). In this region, approximately 94 % of the total area of cocoa plantations was managed by small farmers (Directorate General of Estate, Agricultural Ministry RI, 2012). By some researchers was proposed a small-holder cocoa plantation as management land system suitable for the soil biodiversity conservation (Delabie et al., 2007; Moco et al., 2009).
The studies related to the dynamic of soil biota community structures was still focused on composition and diversity of soil fauna community from different managemen system and different age of cocoa plantation (Moco et al., 2009; Kilowasid et al., 2012; Kilowasid et al., 2013). Meanwhile, up to now the study how the
pattern changes in the structures of soil food web with age of small-holder cocoa plantation is still rare. The objectives of the study are to Mowila sub-District, South Konawe District, South East Sulawesi in smallholder cocoa plantation aged 4 years (040 08’ 33.2’’S; 122
031’01.7’’E), 5 years (04008’50.5’’S; 122 030’
41.04’’E), 7 years (040 08’ 44.4’’S; 122 030’
47.7’’E), 10 years (040 08’ 34.4’’S; 122 031’
40.5’’E), and 16 years (04007’04.9’’S; 122015’
02.8’’E). The average of rainfall was 175.58 mm
month-1 and air temperature was 26.740C. The topography of the research area was categorized as flat with the slope class of 0-3%. Soil type was categorized as a sub-group Dystrudept Typical, coarse clay, Isohypertermic. The location description of every plantation was described in Kilowasid et al. (2012) and the soil characteristics in the Kilowasid et al. (2013).
Sample Collection of Soil Organic Fraction, Root and Soil Organisms
each sub-sample was taken for analysis of soil microbes and protozoa using a stainless steel cylinder of 7.4 cm in inner diameter. Soil sample for analysis of microbial analysis, protozoa, enchytraeid, nematodes and soil mesofauna was put in different zipper packs, and each was placed in a cool box and transported to the laboratory.
Determination of Soil Organic Fraction and Root Biomass
Fraction of labile soil organic matter and recalcitrant were extracted following the acid hydrolysis two-step procedure with H2SO4 as solvent extraction (Rovira and Vallejo, 2002; Rovira and Vallejo, 2007; Belay-Tedla et al., 2009). Separation of active roots from the soil following the procedure is described in Kilowasid et al. (2013). Fresh root was dried at a temperature of 700C for 48 hours (Munoz and Beer, 2001). After the dry weight was weighed, then the root was smoothed using a blender to analyze the C root tissue.
Analysis of Soil Organism Biomass
The biomass of each soil organism group was expressed in kg C/ha/15 cm in soil depth. The number of bacteria in the soil samples was estimated, following the procedure by Trolldenier (1996). Cell number of soil bacteria stained with acridine orange on a microscope slide was counted under epifluorescence microscope which was magnified 500 times, and as many as 20 fields of view were obtained. The number of bacteria was then converted into biovolume using a factor of 0.5236 μm3 cell-1 (Klein and Paschke, 2000). The biovolume of bacteria was changed into bacterial biomass using a conversion factor (3.20 x 10⁻¹³ g C μm-3) (Bakken and Olsen 1985). Soil fungal biomass was estimated with an approach of fluorescein diacetate hydrolysis method, following the procedures explained by Green et al. (2006). Fluorescein content in the soil was converted to fungal biomass with a regression model reported by Gaspar et al. (2001), and 40% carbon content of fungal biomass (van Veen and Paul, 1979).
The number of active flagellates was estimated from 15 µl soil suspension (1:5) in a hemocytometer chamber and counted under the objective lens light microscope at a magnification of 400 times, while the number of
active amoebae in soil suspensions (1:10) in a petri dish was counted under an inverted phase contrast microscope magnified 200 times, following the procedure of Adl et al. (2008). Individuals of flagellates were converted to biovolume with a convertion factors of 50μm3 were counted under a dissecting microscope and a minimum of 100 individuals were identified up to family level under a light microscope, magnified 400 times. Every family was allocated to the feeding type grouping as in Yeates et al. (1993). Every nematode was converted to wet weight using a conversion factor value by Ferris (2010). The wet weight was converted to dry weight using the ratio dry weight: wet weight was 0.21 (Yeates, 1979) and 50% carbon content of dry weight (Beare et al., 1992).
Soil meso-fauna including Acari (mites), Collembola and adult Diptera were extracted from soil using a Berleses Tullgren technique at 38- 400C room temperature for five days. Each soil meso-fauna was preserved in 70% alcohol and counted under a dissecting microscope. Acari, Collembola, and Diptera, which had been cleaned and mounted, were identified up to morphospecies level. Individuals of Acari were converted to biomass using a conversion factor of carbon content of dry weigth from each group. Oribatida was 2.39 μg C individual-1, Mesostigmata 3.47 μg C individual-1, Prostigmata 0.45 μg C individual-1 (Beare et al., 1992) and Astigmata 0.26 μg C individual-1 (Persson and Lohm, 1977; Berg et al., 1998). Diptera and Collembola biomass having been preserved in 70% alcohol were estimated using the relationship between dry weight and body length based on the formula from Ganihar (1997) and 50% carbon content of dry weight (Bezemer et al. 2010).
36
Laode Muhammad Harjoni Kilowasid et al.: Structure of Soil Food Web in Smallholder Cocoa ...
estimated using an average of 0.031 mg dry weight per individual (Persson and Lohm, 1977) and 50% carbon content of dry weight (Bezemer et al., 2010).
Soil macrofauna from soil was removed using a hand sorting techniques, and the specimens preserved in alcohol 70% were identified up to morphospecies. Dry weight of each taxon of macrofauna was estimated using allometric equation between dry weight and body length of specimens that had been preserved in 70% alcohol (Collins, 1991; Ganihar 1997; Sabo et al. 2002; Gruner 2003; Brady and Noske, 2006; Höfer and Ott., 2009) and carbon content assumed 50% of dry weight for each taxa (Bezemer et al. 2010).
Diagram of Soil Food Web
The diagram of the soil food web was constructed by grouping soil organism taxa based on the similarity in their prey, predator, growth rate and survival rate (Moore et al., 1988; Moore, 1994; Sugihara et al., 1997). Construction of the soil food web in this study was developed from a generic soil food web for tropical agricultural proposed by Susilo et al. (2004). The generic soil food web model combined with the latest knowledge about the feeding habit of functional groups in soil food webs from a number of ecosystem types and climates was previously described by some authors (i.e. Berg et al., 2001; Schröter et al., 2003; Holtkamp et al., 2008; Bezemer et al., 2010). The soil food webs for smallholder cocoa plantation is described in the following diagram (for more details see Kilowasid, 2012)
Analysis of Characteristics of Soil Food Web Structure
Trophic level
Labile organic fraction, organic fraction recalcitrant and the root were the primary energy sources of functional groups in soil food web and set occupied at the basal trophic and refered as zero trophic levels (Rooney et al., 2006; Holtkamp et al., 2008). Trophic position of each predator is determined using the following formula (Williams and Martinez, 2004; Rooney et al., 2006): where TLj is the trophic level of the higher order
predator trophic position, TLi is trophic level of the prey, n is the number of prey consumed by the predator, pij is the dependent feeding preference of predator j on prey i.
The dependent feeding preference of predator j on prey i (pij) was calculated with summation over all (n) trophic groups on which j prayed, Bi is the biomass of prey i.
Generally, feeding preferences of top predators on certain prey types in the soil food web modeling used dietary data on estimated percentage of each functional group (flagellates, amoebae, nematodes, acari, Collembola, enchytraeids and earthworms) following de Ruiter et al. (1994) and Didden et al. (1994). Meanwhile, feeding preference data for other soil macro-invertebrates for the soil food web modeling has not been published (Holtkamp et al., 2011). To overcome the limitation of the data availability related to dietary percentage for macro-invertebrates functional groups to determine the feeding preference weight of a predator on prey particular types, the weighting factor (wij) used was 1, which is based on the consideration that consumption depends on the relative abundance of prey predator (Berg et al., 2001). Every trophic level biomass was calculated by summing the biomass from each
trophic group within the respective trophic levels (Holtkamp et al. 2008).
Energy Channel
Energy channels of root, bacteria, fungi, and saprophagous micro-arthropods were quantified by summing the biomass of all trophic groups that obtained energy from each channel. A trophic group gained more energy from the primary sources contributed to more than one channel of energy. The roots were assumed to contribute over the energy channels through the root-eating nematodes and herbivorous macro-arthropod. Labile organic fraction contributed fully to channel the energy that flows through bacteria, saprophagus macro-arthropods, enchytraeidae, and milipedes. Labile and recalcitrant organic fraction contributed equally to the energy channels in fungi, saprophagous macro-arthropods, termites, earthworms and milipedes. Contributions of another group to each energy channel were calculated using the feeding preference rate. Before the feeding preference rate was calculated, biomass group at every trophic level was standardized with the way each trophic group of biomass was divided by the total biomass from all groups which constituted the soil food web community multiplied by 100. Based on the standardized biomass, later the contribution of each group in the energy channel was level and energy channels from the soil food web among different ages of cocoa plantations, univariate analysis of variance with least significant differences (LSD) post hoc test was applied. The assumption of normality was tested using the Shapiro-Wilk and the assumption of homogeneity of variance between groups was tested with Levene's test. To detect the changing trend of every trophic level biomass and energy channel biomass along the age of cocoa plantation, linear regression analysis was employed.
RESULTS AND DISCUSSION
Biomass of trophic level
38
Laode Muhammad Harjoni Kilowasid et al.: Structure of Soil Food Web in Smallholder Cocoa ...
food web (Figure 1). In chronosequence approach it was often hypothesized that biomass at trophic level 0 of soil food web tended to increase linearly with age of vegetation (Holtkamp et al., 2008). In this study, biomass at the trophic level 0 did not show a linear increase with age of cocoa plantation (p = 0.073; R2 = 0.168). The content of each soil organic fraction in all cocoa plantations was relatively the same (Table 1). These results were similar to findings by Smiley and Kroschel (2009), where the soil organic carbon content did not change significantly along the age of smallholder cocoa plantation. Biomass at the trophic level 0 was composed the fraction of soil organic matter plus root biomass. Biomass at to reduce with age of the cocoa plantation. This pattern of reduction in root biomass is similar to the findings of Smiley and Kroschel (2008) on the pattern of changing biomass of cocoa root in Napu, Central Sulawesi. Although biomass of root between cocoa plantations differed significantly, but its influence could not change the contribution effect of the soil organic fraction to biomass at the trophic level 0 with age of the cocoa plantation.
Biomass at the trophic level 1 consisted biomass of saprophagous macro-arthropods, herbivorous macro-arthropods, termites, earthworms, Enchytraeidae, bacteria, fungi and root-feeding nematodes (Figure 1). Biomass at the trophic level 1 (Figure 2B) did not show a significant increase (p = 0.925; R2 = 0.001). Biomass with trophic level 2 was composed of centipedes, milipedes, Diplura, ants, flagellates, amoeba, prostigmatid mites, oribatid mites, Collembola, omnivorous, bacterivorous, and fungivorous nematodes (Figure 1) also showed no significant increase with age of cocoa plantation ( p = 0.120 ; R2 = 0.129 ). Biomass at the trophic level 2 on plantation aged 5 years was the lowest, and on the plantation aged 10 years was the highest (Figure 2C). Table 2
shows that the biomass of centipedes, milipedes and diplura on cocoa plantation aged 5 years was the lowest, while biomass of centipedes and Diplura at the plantation aged 10 years and milipedes at the plantation aged 16 years was the highest. Biomass of ants, all groups of micro-arthropods and flagellates between age of cocoa plantation were not significantly different. Biomass of amoeba in cocoa plantation aged 5 years was the highest and in the aged 16 years it was the lowest. Biomass of omnivorous, bacterivorous and fungivorous nematodes at the plantation aged 4 years was the highest. Biomass of bacterivorous and fungivorous nematode in cocoa plantation aged 5 years and omnivorous nematode in cocoa plantation aged 16 years was the lowest.
Susilo et al. (2004) that the prediction of an increase or decrease in abundance of functional groups in the soil biota community should be seen as a "random walk" because the accessibility and the recolonisation from some taxa of macro-arthropods, such as ants, Coleoptera, Diptera, Centipedes, and Dermaptera (Wallwork, 1970) are playing an important role in controlling the abundance within trophic levels (Hubbell, 2001).
Biomass of Energy Channel
The biomass of root energy channels did not show a linear increase with age of cocoa plantation (R2 = 0.014 p = 0.624). A similar pattern was also shown by the biomass in fungal energy channels (R2 = 0.120 p = 0.134), bacterial energy channel (R2 = 0.006 p = 0747), and saprophagous macro-arthropod energy channels (R2= 0.130 p = 0.119).
2
Laode Muhammad Harjoni Kilowasid et al.: Structure of Soil Food Web in Smallholder Cocoa ...
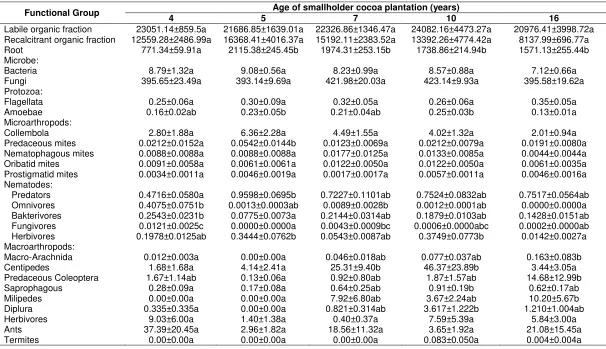
Table 1. Biomass of functional group in different age of smallholder cocoa plantation (kg C/ha/ 15 cm, soil depth)
Functional Group Age of smallholder cocoa plantation (years)
4 5 7 10 16
Labile organic fraction 23051.14±859.5a 21686.85±1639.01a 22326.86±1346.47a 24082.16±4473.27a 20976.41±3998.72a Recalcitrant organic fraction 12559.28±2486.99a 16368.41±4016.37a 15192.11±2383.52a 13392.26±4774.42a 8137.99±696.77a
Root 771.34±59.91a 2115.38±245.45b 1974.31±253.15b 1738.86±214.94b 1571.13±255.44b
Microbe:
Bacteria 8.79±1.32a 9.08±0.56a 8.23±0.99a 8.57±0.88a 7.12±0.66a
Fungi 395.65±23.49a 393.14±9.69a 421.98±20.03a 423.14±9.93a 395.58±19.62a
Protozoa:
Flagellata 0.25±0.06a 0.30±0.09a 0.32±0.05a 0.26±0.06a 0.35±0.05a
Amoebae 0.16±0.02ab 0.23±0.05b 0.21±0.04ab 0.25±0.03b 0.13±0.01a
Microarthropods:
Collembola 2.80±1.88a 6.36±2.28a 4.49±1.55a 4.02±1.32a 2.01±0.94a
Predaceous mites 0.0212±0.0152a 0.0542±0.0144b 0.0123±0.0069a 0.0212±0.0079a 0.0191±0.0080a Nematophagous mites 0.0088±0.0088a 0.0088±0.0088a 0.0177±0.0125a 0.0133±0.0085a 0.0044±0.0044a Oribatid mites 0.0091±0.0058a 0.0061±0.0061a 0.0122±0.0050a 0.0122±0.0050a 0.0061±0.0035a Prostigmatid mites 0.0034±0.0011a 0.0046±0.0019a 0.0017±0.0017a 0.0057±0.0011a 0.0046±0.0016a Nematodes:
Predators 0.4716±0.0580a 0.9598±0.0695b 0.7227±0.1101ab 0.7524±0.0832ab 0.7517±0.0564ab Omnivores 0.4075±0.0751b 0.0013±0.0003ab 0.0089±0.0028b 0.0012±0.0001ab 0.0000±0.0000a Bakterivores 0.2543±0.0231b 0.0775±0.0073a 0.2144±0.0314ab 0.1879±0.0103ab 0.1428±0.0151ab Fungivores 0.0121±0.0025c 0.0000±0.0000a 0.0043±0.0009bc 0.0006±0.0000abc 0.0002±0.0000ab Herbivores 0.1978±0.0125ab 0.3444±0.0762b 0.0543±0.0087ab 0.3749±0.0773b 0.0142±0.0027a Macroarthropods:
Macro-Arachnida 0.012±0.003a 0.00±0.00a 0.046±0.018ab 0.077±0.037ab 0.163±0.083b
Centipedes 1.68±1.68a 4.14±2.41a 25.31±9.40b 46.37±23.89b 3.44±3.05a
Predaceous Coleoptera 1.67±1.14ab 0.13±0.06a 0.92±0.80ab 1.87±1.57ab 14.68±12.99b
Saprophagous 0.28±0.09a 0.17±0.08a 0.64±0.25ab 0.91±0.19b 0.62±0.17ab
Milipedes 0.00±0.00a 0.00±0.00a 7.92±6.80ab 3.67±2.24ab 10.20±5.67b
Diplura 0.335±0.335a 0.00±0.00a 0.821±0.314ab 3.617±1.222b 1.210±1.004ab
Herbivores 9.03±6.00a 1.40±1.38a 0.40±0.37a 7.59±5.39a 5.84±3.00a
Ants 37.39±20.45a 2.96±1.82a 18.56±11.32a 3.65±1.92a 21.08±15.45a
Termites 0.00±0.00a 0.00±0.00a 0.00±0.00a 0.083±0.050a 0.004±0.004a
40
La
od
e M
uh
am
m
ad
Ha
rjo
ni K
ilo
was
id
e
t
a
l.:
S
tru
ctu
re
Of So
il F
oo
d We
b I
n Sm
all
ho
ld
er Co
co
a
..
....
....
...
...
...
Laode Muhammad Harjoni Kilowasid et al.: Structure of Soil Food Web in Smallholder Cocoa ...
Table 1 (Continued)
Functional Group Age of smallholder cocoa plantation (years)
4 5 7 10 16
Oligochaeta:
Earthworms 0.123±0.036a 0.062±0.033a 0.205±0.054abc 0.375±0.133c 0.095±0.026ab
Enchytraeids 0.614±0.217ab 0.242±0.108a 0.413±0.137ab 1.103±0.538b 0.271±0.142ab
Remarks: Numbers followed by different letter within a column indicate significant difference in functional group biomass (n = 20, mean±standard error) between the cocoa plantations at p < 0.05 level
41
La
od
e M
uh
am
m
ad
Ha
rjo
ni K
ilo
was
id
e
t
a
l.:
S
tru
ctu
re
Of So
il F
oo
d We
b I
n Sm
all
ho
ld
er Co
co
a
..
....
....
....
...
...
42
Laode Muhammad Harjoni Kilowasid et al.: Structure of Soil Food Web in Smallholder Cocoa ...
Figure 3. Standarised biomass (*) of (A) root energy channel, (B) fungal energy channel, (C) bacterial energy channel, and (D) saprophagous macro-arthropods energy channel in small-holder cocoa plantation aged 4, 5, 7, 10, and 16 years (n = 20, mean±standar error). Different letters placed above the bars indicate significant difference between ages of cocoa plantation at p < 0.05 Biomass in root energy channels in cocoa
plantation aged 4 years was lower than that of cocoa plantation aged 5, 7, 10 and 16 years (Figure 3A). In this research, it was found that the pattern of changing biomass in root energy channels followed the pattern of changes in root biomass. A possible explanation on the pattern form biomass of root energy channels may be related to the dynamics of root defense mechanism against soil fauna feeding on root (Bonkowsky et al., 2009).
plantation age were not significantly different (Figure 4C and 4D). in other words, the structuring in soil food web communities was influenced by combination of soil organic matter availabilty and biotic factors, such as facilitation, competition and predation..
Variation in energy channels indicated by the ratio of the organic fraction, the biomass ratio of fungi to bacteria, and the biomass ratio of energy channels was generally used to analyze changes in soil food web structure (Holtkamp et al., 2008). The results showed that the ratio of
recalcitrant organic fraction to labile organic fraction, biomass ratio of fungi to bacteria, biomass ratio of fungal energy channels to bacterial energy channel (FB ratio), or the biomass ratio of saprophagous macro-arthropod energy channels to fungal energy channels between cocoa plantations were not significantly different (Figure 4A, 4B, 4C, and 4D). The proportion of recalcitrant organic fraction was slightly lower than labile organic fractions in all cocoa plantations (Figure 4A).
44
Laode Muhammad Harjoni Kilowasid et al.: Structure of Soil Food Web in Smallholder Cocoa ...
Fungal biomass was more dominant than reviewed on some studies related soil food web in farm land and found that dominance of fungal biomass will be followed by the dominance of biomass in fungal energy channels. While in this study, although biomass of fungi was found most dominant (Figure 4B), but the biomass of fungal energy channels was lower than biomass of bacterial energy channels (Figure 4C). It is suspected by the presence of saprophagous macro-arthropods, earthworms, termites, and predators (ants, Coleoptera, and macro-Arachnids) potentially altering the distribution of biomass in fungal and bacterial energy channel in soil food webs micro-arthropods (Laakso, 1999; Mikola and Setala, 1999; Wise, 2004; Wardle, community in the small-holder cocoa plantation aged 4 to 16 years was relatively stable. Temporal changes in characteristics of soil food web structures were independent from net primary productivity in soil ecosystem. Variation in biomass at the trophic level 1, 2 or 3 and biomass in root energy channel of the soil food web is strongly influenced by biotic factors of macro-arthropods groud such as facilitation and recolonization capabilities and accessibility at different age of small-holder cocoa plantations.
ACKNOWLEDGEMENTS
This manuscript is as a part of the first author dissertation for Doctoral Program of Biology in School of Life Sciences and Technology, Bandung Institute of Technology (ITB). We would like to thank to The Directorate General of Higher Education, Ministry of Education and Cultural of the Republic of Indonesia for funding this research. Many thanks are also addressed to all people who helped us during fieldwork. Canadian Society of Soil Science, Inc. p. 455-469.
Aira, M., L.Sampedro, F. Monroy and J. Dominguez. 2008. Detrivorous earthworms directly modify the structure, thus altering the functioning of a microdecomposer food web. Soil Biology and Biochemistry 40: 2511-2516.
Bakken, L. R. and R.A. Olsen. 1985. Buoyant densities and dry-matter content of microorganisma: conversion of a measured biovolume into biomass. Applied and Environmental Microbiology 45 (4): 1188-1195.
Bardgett, R.D. and D.A. Wardle. 2010. Above-ground-belowground linkage: biotic interactions, ecosystem processes, and global change. Oxford University Press. New York. pp.297.
Beare, M. H., R.W. Parmelee, P.F. Hendrix, W. Cheng, D.C. Coleman and D.A. Jr. Crossley. 1992. Microbial and faunal interactions and effects on litter nitrogen and decomposition in agroecosystems. Ecological Monographs 62 (4): 569-591. Belay-Tedla, A., X. Zhou, B. Su, S. Wan and Y.
Lou. 2009. Labile, recalcitrant, and microbial carbon and nitrogen pools of tallgrass prairie soils in the US great plains subjected to experimental warming and clipping. Soil Biology and Biochemistry 41: 110-116.
Berg, M., J.P. Kniese, J.J.M. Bedaux and H.A. Verhoef .1998. Dynamics and stratify-cation of functional groups of micro- and mesoarthropodss in the organic layer of a scots pine forest. Biol Fertil Soils 26: 268-284.
Berg, M., P.C. de Ruiter, W. Didden, M. Jansen, T. Schouten and H. Verhoef. 2001. Community food web, decomposition and nitrogen mineralisation in a stratified scots pine forest soil. Oikos 94: 130-142. Bezemer, T.M, M.T. Fountain, J.M. Barea, S.
Robin, P.C. de Ruiter, S. Scheu, H. Setälä, P. Šmilauer and W.H. van der Putten. 2010. Divergent composition but similar function of soil food webs of individual plants: plant species and community effects. Ecology 91: 3027-3036.
Bonkowsky, M., C. Villenave and B. Griffiths. 2009. Rhizosphere fauna: the functional and structural diversity of intimate interactions of soil fauna with plant roots. Plant Soil 321: 213-233.
Brady, C.J and R.A. Noske. 2006. Generalised regressions provide good estimates of insect and spider biomass in the monsoonal tropics of Australia. Australian Journal of Entomology 45: 187-191. Coleman, D.C. 2008. From peds to paradoxes:
linkages between soil biota and their influences on ecological processes. Soil Biology & Biochemistry 40: 271-289. Collins, P.T. 1991. Length-biomass relationships
for terrestrial Gastropoda and Oligochaeta, Am.Midl. Nat. 128: 404-406. Delabie, J.H.C., B. Jahyny, I.C. do Nascimento, C.S.F. Mariano, S. Lacau, S. Campiolo, S.M. Philpott, and M. Leponce. 2007. Contribution of cocoa plantations to the conservation of native ants (insecta: Hymenoptera: Formicidae) with a special emphasis on the Atlantic forest fauna of southern Bahia, Brazil. Biodivers Conserv 16: 2359-2384.
de Ruiter, P.C., J. Bloem, L.A. Bouwman, W.A.M. Didden, G.H.J. Hoenderboom, G. Lebbink, J.C.Y. Marinissen, J.A. de Vos, M.J. Vreeken-Buijs and K.B. Zwart. 1994. Simulation of dynamics in nitrogen mineralization in the below-ground food webs of two arable farming system. Agric. Ecosyst. Environ. 51: 199-208. Didden, W.A.M., J.C.Y. Marinessen, M.J.
Vreeken-Buijs, S.L.G.E. Burgers, R. de Fluiter, M. Geurs and L. Brussaard. 1994. Soil meso-and macrofauna in two agricultural systems: factors affecting population dynamics and evaluation of their role in carbon and nitrogen dynamics. Agriculture, Ecosystems, and Environment 51: 171-186.
Directorate General of Esatate, Agricultural Ministry, RI. 2011. Area and production by category of Gonzalez-Megias. 2009. Different structuring factors but connected dynamics shape litter and below-ground soil macrofaunal food webs. Soil Biology & Biochemistry 41: 2543-2550.
Ekelund, F., R. Rønn and B. Griffths. 2001. Quantitative estimation of flagellate community structure and diversity in soil samples. Protist 152: 301-314.
Ferris, H. 2010. Form and function: metabolic footprints of nematodes in the soil food web. European Journal of Soil Biology 46: 97-104.
Ganihar, S.R. 1997. Biomass estimates of terrestrial arthropodss based on body length. J. Biosci. 22(2): 219-224.
Gaspar, M.L., M.N. Cabello, R. Pollero and M.A. Aon. 2001. Fluorescein diacetate hydrolysis as a measure of fungal biomass in soil. Current Microbiology 42: 339-344.
Green, V.S., D.E. Stott, and M. Diack. 2006. Assay for fluorescein diacetate hydrolytic activity: Optimization for Soil Samples. Soil Biology and Biochemistry 38: 693-701.
Gruner, D.S. 2003. Regressions of length and width to predict arthropods biomass in the Hawaiian Islands. Pacific Science. 57(3): 325-336.
Hertel, D., M.A. Harteveld and C. Leuschner. 2009. Conversion of a tropical forest into agroforest alters the fine root-related carbon flux to the soil. Soil Biology and Biochemistry 41: 481-490.
Holtkamp. R., P. Kardol, A. van der Wal, S.C. Dekker, W.H. van der Putten, and P.C. de Ruiter. 2008. Soil food web during eco-system development after land abandon-ment. Applied Soil Ecology 39: 23- 34.
46
Laode Muhammad Harjoni Kilowasid et al.: Structure of Soil Food Web in Smallholder Cocoa ...
Höfer, H., and R. Ott. 2009. Estimating biomass of Neotropical spiders and other arachnids (Araneae, Opiliones, Pseudoscorpiones, Ricinulei) by mass-length regression. The Journal of
ICCO. 2010. International Cocoa Organization. London.
Kilowasid, L.M.H. 2012. Control of soil fauna community on nitrogen status in cocoa plantation. ITB Bandung. Dissertation. p.92-93. (in Indonesia).
Kilowasid, L.M.H, T.S. Syamsudin, F.X. Susilo and E. Sulistyawati. 2012. Ecological Diversity of soil fauna as ecosystem engineers in small-holder cocoa plantation in South Konawe. J Trop Soils 17: 173-180.
Kilowasid, L.M.H, T.S. Syamsudin, F.X. Susilo, E. Sulistyawati and H. Syaf. 2013. Charac-teristics of soil fauna communities and habitat in small-holder cocoa plantation in South Konawe. J Trop Soils 18 (2): 149-159.
Klein, D.A, and M.W. Paschke. 2000. A soil microbial community structural-functional index: the microscopy-based total/active/ active fungal/bacterial (TA/AFB) biovolumes ratio. Applied Soil Ecology 14: 257-268.
Laakso, J. 1999. Short-term effects of wood ants (Formica aquilonia Yarr.) on soil animal community structure. Soil Biology and Biochemistry 31: 337-343.
Li, Y., and G. González. 2008. Soil fungi and macrofauna in the neotropics. In Myster, R. W. (eds.). Post-Agricultural Succession in the Neotropics. Springer. p.93-114.
Lorange-Merciris, G., D. Imbert, F. Bernhard-Reversat, P. Lavelle and J.F. Ponge. 2008. Litter N-content influences soil milipede abundance, species richness and feeding preferences in a
semi-evergreen dry forest of Guadeloupe (Lesser Antilles). Biol Fertil Soils 45: 93-98.
Marhaning, A.R., A.A.S. Mills, and S.M. Adl. 2009. Soil community changes during secondary succession to naturalizaed grasslands. Applied Soil Ecology 41: 137-147.
Mikola, J and H. Setala. 1999. Interplay of omnivory, energy channels and C availability in a microbial-based soil food web. Biol Fertil Soils 28: 212-218. Moco, M.K.S., E.F. Gama-Rodrigues, A.C.
Gama-Rodrigues, R.C.R. Machado and V.C. Baligar. 2009. Soil and litter fauna of cocoa agroforestry systems in Bahia, Brazil. Agroforest Syst 76: 127-138. Moore, J.C. and H.W. Hunt. 1988. Resource
compartmentation and the stability of real ecosystem. Nature 333: 261-263.
Moore, J.C., D.E. Walter and W.H. Hunt. 1988. Arthtropod regulation of micro- and mesobiota in below-ground detrital food webs. Ann. Rev. Entomol. 33: 419 – 439. Moore, J.C 1994. Impact of agricultural practices
on soil food web structure: theory and application. Agriculture, Ecosystem and Environment 51:239 – 247. Detritus, trophic dynamics and biodiversity. Ecology Letters 7: 584-600. Moore, J.C., K. McCann and P.C. de Ruiter.
2005. Modeling trophic patways, nutrient cycling, and dynamic stability in soils. Pedobiologia 49: 499-510.
Moya-Larano, J and D.H. Wise. 2007. Direct and indirect effects of ants on a forest-floor food web. Ecology 88(6):1454-1465. Munoz, F., and J. Beer. 2001. Fine root dynamics
of shaded cacao plantations in Costa Rica. Agroforestry Systems51:119-130. Osler, G.H.R. and M. Sommerkorn. 2007. Toward
a complete soil C and N cycle: incorporating the soil fauna. Ecology 88: 1611-1621.
H.A. and P.J. Morin (eds.): Community ecology: processes, models, and applications. Oxford University Press. New York. p. 7-22.
Persson, T. and U. Lohm. 1977. Energetical significance of the annelids and arthropodss in a Swedish grassland soil. Ecological Bulletins No. 23. Swedish Natural Science Research Council. pp.210.
Rooney, N., K. McCann, G. Gellner and J.C. Moore. 2006. Structural asymmetry and the stability of diverse food webs. Nature 442: 265 -269.
Rovira, P. and V.R. Vallejo. 2002. Labile and recalcitrant pool of carbon and nitrogen in organic matter decomposing at different depth in soil: an acid hydrolysis approach. Geoderma 107:109 – 141. Rovira, P. and V.R. Vallejo. 2007. Labile,
recalcitrant, and inert organic matter in mediterranean forest soils. Soil Biology & Biochemistry 39: 202 – 215.
Sabo, J.L., J.L. Bastow, and M.E. Power. 2002. Length-mass relationships for adult aquatic and terrestrial invertebrates in a California watershed. J. N. Am. Benthol. Soc. 21(2): 336 – 343.
Schimel, J.P. and J. Bennet. 2004. Nitrogen mineralization: challenges of a changing paradigm. Ecology 85: 591 – 602. Schroter, D. V. Wolters, and P.C. de Ruiter. 2003.
C and N mineralization in the decomposer food webs of a European forest transect. Oikos 102: 294 – 308. Smiley, G. L. and J. Kroschel. 2008. Temporal
change in carbon stock of cocoa-gliricidia agroforests of Central Sulawesi. Indonesia. Agroforest Syst. 73: 219 –
231.
Smiley, G.L. and J. Kroschel. 2009. Yield development and nutrient dynamics in cocoa-gliricidia agroforests of central Sulawesi. Indonesia. Agroforest Syst. Stout, J.D. and O.W. Heal. 1967. Protozoa. In: aggregation on food web properties. Oecologia 112: 272-284.
Susilo, F.X., A.M. Neutal, M. van Noordwijk, K.
Hairiah, G. Brown and M.J. Swift. 2004. Soil biodiversity and food webs. In: van Noordwijk,M., G. Cadisch, and C.K. Ong: Below-ground interactions in tropical agroecosystems: concept and models with multiple plant components. CAB International Publushing. p. 285 – 308 Swift, M.J. 1997. Biological management of soil
fertility as a component of sustainable agriculture: perspectives and prospects with particular reference to tropical regions. In: Brussard, L. and R. Ferrera-Cerrato (ed.): Soil ecology in sustainable agricultural systems. CRC Press LLC. Boca Raton. Chapter 7.
Trolldenier, G. 1996. Bacterial biomass. In: Schinner, F., R. Öhlinger, E. Kandeler and R. Maegisen (Eds.) Methods in soil biology. Springer, Hong Kong. p.135-137 van Veen, J.A. and E.A. Paul. 1979. Conversion
of biovolume measurements of soil organisms, grown under various tension, to biomass and their nutrient content. Applied and Environmental Microbiology 37: 686 – 692.
Viketoft, M., J. Bengtsson, B. Sohlenius, M.P. Berg, O. Petchey, C. Palmborg and K. Hus-Danell. 2009. Long-term effects of plant diversity and composition on soil nematode communities in model grasslands. Ecology 90(1): 90 – 99. Wardle, D.A. 2006. The influence of biotic
interactions on soil biodiversity. Ecology Letters 9: 870 – 886. American Naturalist 163(3): 458 – 468. Wise, D.H. 2004. Wandering spiders limit
densities of a major microbial-detritivore in the forest-floor food web. Pedobiologia 48: 181 – 188.
Yeates, G.W. 1979. Soil nematodes in terrestrial ecosystems. J. Nematol. 11: 213-229. Yeates, G.W., T. Bongers, R.G.M. De Goede,
D.W. Freckman and S.S.