Daftar Nama Perusahaan Property dan Real Estate Yang Dijadikan Sampel
No
Kode
Nama Perusahaan
Tanggal
Berdiri
Tanggal
Listing
1
ELTY
PT Bakrieland Development Tbk
11 Jan 1901
30 Okt 1995
2
BKDP
PT Bukit Darmo Property Tbk
07 Mei 1997
30 Mar 2004
3
BSDE
PT Bumi Serpong Damai Tbk
12 Feb 1990
08 Nov 1995
4
CTRA
PT Ciputra Development Tbk
25 Mar 1989
17 Apr 2000
5
CTRS
PT Ciputra Surya Tbk
09 Sept 1993
25 Mei 2002
6
CKRA
PT Citra Kebun Raya Agri Tbk
22 Apr 1985
29 Jul 1993
7
DART
PT Duta Anggada Realty Tbk
30 Des 1983
08 Mei 1990
8
DUTI
PT Duta Pertiwi Tbk
29 Des 1972
02 Nov 1994
9
GMTD PT Gowa Makassar Tourism Development Tbk
18 Feb 1991
13 Okt 2001
10
JRPT
PT Jaya Real Property Tbk
22 Des 1979
29 Jun 1994
11
LAMI
PT Lamicitra Nusantara Tbk
29 Jan 1988
18 Jul 2001
12
LPCK
PT Lippo Cikarang Tbk
30 Mei 1988
24 Jul 1997
13
LPKR
PT Lippo Karawaci Tbk
15 Okt 1990
28 Jun 1996
14
PJAA
PT Pembangunan Jaya Ancol Tbk
10 Jul 1992
02 Jul 2004
15
GPRA
PT Perdana Gapuraprima Tbk
29 Mei 1987
10 Okt 2007
16
SMRA
PT Summarecon Agung Tbk
26 Nov 1975
07 Mei 1990
Data Variabel Penelitian Tahun 2006
No
Emiten
CR
DER
LR
OPM
NPM
TATO
ROI
ROE
Pertumbuhan
Laba
1
ELTY
1.15
0.79
0.43
18.36
0.17
0.16
2.82
0.16
-0.27
2
BKDP
13.91
28.80
0.97
0.03
0.02
0.01
0.02
0.52
-0.04
3
BSDE
0.83
2.18
0.69
0.17
0.08
0.29
2.25
7.14
0.91
4
CTRA
2.53
0.46
0.25
0.24
0.48
0.23
11.09
20.11
6.22
5
CTRS
2.24
0.39
0.64
0.31
0.56
0.17
9.40
15.58
0.41
6
CKRA
33.89
0.03
0.03
-0.08
0.03
0.15
0.44
0.45
3.30
7
DART
0.41
2.77
0.73
0.32
0.28
0.30
8.14
30.68
-0.38
8
DUTI
0.76
1.48
0.54
0.10
0.07
0.24
1.61
4.42
-0.20
9
GMTD
0.71
2.33
0.70
0.17
0.13
0.22
2.75
9.15
0.17
10
JRPT
1.26
0.55
0.34
0.30
0.21
0.24
5.00
8.01
0.25
11
LAMI
1.50
2.01
0.67
0.10
0.02
0.09
0.20
0.59
-0.42
12
LPCK
3.54
1.60
0.61
0.14
0.03
0.10
0.28
0.73
-0.12
13
LPKR
1.35
1.76
0.61
0.23
0.17
0.22
3.83
10.96
-0.09
14
PJAA
2.38
0.32
0.24
25.01
18.98
0.70
13.23
17.45
0.01
15
GPRA
1.41
7.07
0.87
0.10
0.04
0.20
0.82
6.71
0.24
16
SMRA
0.86
1.25
0.55
0.25
0.17
0.44
7.67
17.23
0.11
17
SIIP
1.52
0.10
0.09
0.57
0.39
0.35
13.44
14.95
0.21
Data Variabel Penelitian Tahun 2007
No
Emiten
CR
DER
LR
OPM
NPM
TATO
ROI
ROE
Pertumbuhan
Laba
1
ELTY
3.14
0.36
0.26
21.80
0.17
0.14
2.35
0.14
0.98
2
BKDP
2.82
0.15
0.13
0.16
0.15
0.03
0.39
0.45
52.53
3
BSDE
0.85
1.84
0.65
0.19
0.07
0.40
2.95
8.40
0.28
4
CTRA
3.99
0.34
0.17
0.25
0.12
0.18
2.24
4.43
-0.71
5
CTRS
2.53
0.27
0.41
0.31
0.56
0.16
8.93
13.64
0.01
6
CKRA
4.70
0.23
0.18
-0.03
0.04
0.21
0.83
1.02
1.27
7
DART
0.23
4.04
0.80
0.36
0.21
0.19
3.98
20.07
-0.18
8
DUTI
0.78
1.37
0.52
0.12
0.05
0.28
1.31
3.44
-0.19
9
GMTD
0.75
2.21
0.69
0.18
0.13
0.22
2.82
9.07
0.06
10
JRPT
1.18
0.63
0.38
0.29
0.21
0.28
5.77
9.70
0.31
11
LAMI
1.30
2.81
0.73
0.15
0.03
0.15
0.47
1.78
2.05
12
LPCK
2.58
1.80
0.64
0.26
0.07
0.12
0.86
2.41
2.38
13
LPKR
1.44
1.43
0.57
0.22
0.17
0.20
3.35
8.39
0.09
14
PJAA
2.65
0.57
0.36
23.71
18.46
0.60
11.03
17.31
0.12
15
GPRA
2.07
1.45
0.59
0.20
0.09
0.32
2.71
6.72
2.51
16
SMRA
0.76
1.01
0.50
0.26
0.16
0.34
5.28
10.62
-0.05
17
SIIP
5.02
1.14
0.53
0.53
0.44
0.16
6.93
14.92
0.16
Data Variabel Penelitian Tahun 2008
No
Emiten
CR
DER
LR
OPM
NPM
TATO
ROI
ROE
Pertumbuhan
Laba
1
ELTY
2.49
0.70
0.38
21.45
0.26
0.13
3.26
0.13
1.03
2
BKDP
1.97
0.45
0.31
0.01
0.00
0.21
0.09
0.13
-0.71
3
BSDE
1.37
1.11
0.53
0.30
0.16
0.32
5.10
10.77
1.10
4
CTRA
3.32
0.38
0.19
0.22
0.16
0.16
2.49
5.06
0.20
5
CTRS
1.79
0.29
0.44
0.31
0.49
0.14
6.68
10.30
-0.16
6
CKRA
77.83
0.04
0.04
-0.21
0.45
0.03
1.13
1.19
28.88
7
DART
0.25
3.35
0.77
0.37
0.27
0.13
3.63
15.79
0.01
8
DUTI
1.12
0.81
0.41
0.10
0.04
0.24
0.89
1.77
-0.32
9
GMTD
0.76
2.09
0.68
0.19
0.13
0.21
2.80
8.64
0.02
10
JRPT
1.11
0.75
0.42
0.33
0.23
0.29
6.68
11.98
0.34
11
LAMI
1.29
2.62
0.71
0.14
0.08
0.18
1.45
5.30
2.14
12
LPCK
2.13
1.96
0.66
0.25
0.05
0.20
1.01
3.00
0.28
13
LPKR
1.45
1.54
0.59
0.18
0.15
0.22
3.15
8.24
0.05
14
PJAA
3.17
0.51
0.34
22.91
15.48
0.64
9.93
14.97
-0.06
15
GPRA
1.93
1.64
0.62
0.19
0.04
0.22
0.81
2.15
-0.67
16
SMRA
1.12
1.31
0.57
0.17
0.07
0.35
2.59
6.00
-0.41
17
SIIP
2.80
1.27
0.56
0.77
0.52
0.06
3.08
7.03
-0.49
Statistik Deskriptif Sebelum Transformasi Data
Descriptive Statistics
N Minimum Maximum Mean Std. Deviation
CR 51 .23 77.83 4.1753 11.59963 DER 51 .03 28.80 1.8894 4.03380 LR 51 .03 .97 .4959 .21929 OPM 51 -.21 25.01 2.8031 7.19372 NPM 51 .00 18.98 1.2067 4.16915 TATO 51 .01 .70 .2318 .13873 ROI 51 .02 13.44 3.9208 3.55338 ROE 51 .13 30.68 8.0353 6.74135 Pertumbuhan_Laba 51 -.71 52.53 2.0227 8.32364 Valid N (listwise) 51
Statistik Deskriptif Sesudah Transformasi Data
Descriptive Statistics
N Minimum Maximum Mean Std. Deviation
Ln_CR 51 -1.47 4.35 .5805 1.00620 Ln_DER 51 -3.51 3.36 -.0787 1.20234 Ln_LR 51 -3.51 -.03 -.8704 .71489 Ln_OPM 48 -4.61 3.22 -1.0318 1.71717 Ln_NPM 50 -3.91 2.94 -1.7801 1.49068 Ln_TATO 51 -4.61 -.36 -1.6633 .73912 Ln_ROI 51 -3.91 2.60 .8061 1.31568 Ln_ROE 51 -2.04 3.42 1.4428 1.47136 Ln_Pertumbuhan_Laba 33 -4.61 3.96 -.9602 2.07025 Valid N (listwise) 30
Hasil Uji Normalitas Sebelum Transformasi Data
One-Sample Kolmogorov-Smirnov Test
Unstandardized Residual
N 51
Normal Parametersa Mean .0000000
Std. Deviation 6.63276355
Most Extreme Differences Absolute .217
Positive .217
Negative -.161
Kolmogorov-Smirnov Z 1.547
Asymp. Sig. (2-tailed) .017
a. Test distribution is Normal.
Hasil Uji Normalitas Sesudah Transformasi Data
One-Sample Kolmogorov-Smirnov Test
Unstandardized Residual
N 30
Normal Parametersa Mean .0000000
Std. Deviation 1.31120395
Most Extreme Differences Absolute .104
Positive .077
Negative -.104
Kolmogorov-Smirnov Z .572
Asymp. Sig. (2-tailed) .899
Hasil Uji Multikolinieritas Sebelum Tindakan Perbaikan
Coefficientsa Model Unstandardized Coefficients Standardized Coefficients t Sig. Collinearity StatisticsB Std. Error Beta Tolerance VIF
1 (Constant) 3.824 3.910 .978 .339 Ln_CR 1.019 .605 .321 1.683 .107 .590 1.694 Ln_DER .726 1.152 .365 .630 .535 .064 15.622 Ln_LR -1.137 1.391 -.322 -.817 .423 .139 7.201 Ln_OPM -1.847 1.042 -1.541 -1.772 .091 .028 35.170 Ln_NPM 1.153 .996 .841 1.157 .260 .041 24.565 Ln_TATO 1.560 1.088 .459 1.433 .166 .209 4.775 Ln_ROI .376 .936 .183 .402 .692 .104 9.607 Ln_ROE -2.325 1.288 -1.554 -1.805 .086 .029 34.504
a. Dependent Variable: Ln_Pertumbuhan_Laba
Hasil Uji Multikolinieritas Sesudah Tindakan Perbaikan I
Coefficientsa Model Unstandardized Coefficients Standardized Coefficients t Sig. Collinearity Statistics
B Std. Error Beta Tolerance VIF
1 (Constant) -2.404 2.247 -1.070 .295 Ln_CR .576 .516 .292 1.117 .275 .292 3.424 Ln_DER .001 .912 .001 .001 .999 .065 15.315 Ln_LR -.235 1.297 -.094 -.182 .857 .074 13.424 Ln_NPM -.294 .318 -.204 -.925 .364 .411 2.432 Ln_TATO -.566 .640 -.177 -.884 .385 .498 2.009 Ln_ROI -.193 .667 -.094 -.290 .774 .188 5.316 Ln_ROE -.221 .332 -.147 -.666 .512 .407 2.459
Hasil Uji Mutikolinieritas Sesudah Tindakan Perbaikan II
Coefficientsa Model Unstandardized Coefficients Standardized Coefficients t Sig. Collinearity StatisticsB Std. Error Beta Tolerance VIF
1 (Constant) -2.403 1.697 -1.416 .169 Ln_CR .576 .491 .292 1.172 .252 .309 3.232 Ln_LR -.234 .588 -.093 -.398 .694 .348 2.872 Ln_NPM -.294 .312 -.204 -.943 .354 .411 2.432 Ln_TATO -.565 .611 -.177 -.926 .363 .525 1.904 Ln_ROI -.194 .557 -.094 -.348 .731 .260 3.853 Ln_ROE -.221 .315 -.147 -.702 .489 .435 2.300
a. Dependent Variable: Ln_Pertumbuhan_Laba
Hasil Uji Normalitas Setelah Tindakan Perbaikan Atas Terjadinya
Multikolinieritas
One-Sample Kolmogorov-Smirnov Test
Unstandardized Residual
N 33
Normal Parametersa Mean .0000000
Std. Deviation 1.46105029
Most Extreme Differences Absolute .069
Positive .069
Negative -.052
Kolmogorov-Smirnov Z .398
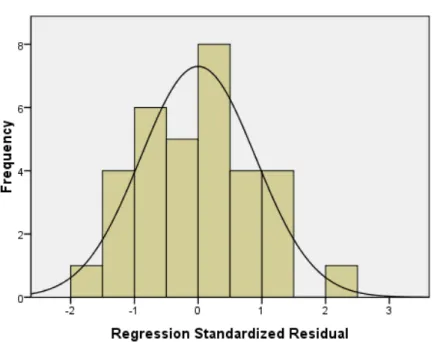
Grafik Histogram Dan Normal P-P Plot Setelah Tindakan Perbaikan Atas
Multikolinieritas
Hasil Uji Hateroskedastisitas
Hasil Uji Autokorelasi
Runs Test
Unstandardized Residual
Test Valuea .13659
Cases < Test Value 16
Cases >= Test Value 17
Total Cases 33
Number of Runs 18
Z .005
Hasil Uji F
ANOVAb
Model Sum of Squares df Mean Square F Sig.
1 Regression 68.841 6 11.474 4.367 .004a
Residual 68.309 26 2.627
Total 137.150 32
a. Predictors: (Constant), Ln_ROE, Ln_NPM, Ln_LR, Ln_TATO, Ln_CR, Ln_ROI b. Dependent Variable: Ln_Pertumbuhan_Laba
Hasil Uji t
Coefficientsa Model Unstandardized Coefficients Standardized Coefficients t Sig. Collinearity StatisticsB Std. Error Beta Tolerance VIF
1 (Constant) -2.403 1.697 -1.416 .169 Ln_CR .576 .491 .292 1.172 .252 .309 3.232 Ln_LR -.234 .588 -.093 -.398 .694 .348 2.872 Ln_NPM -.294 .312 -.204 -.943 .354 .411 2.432 Ln_TATO -.565 .611 -.177 -.926 .363 .525 1.904 Ln_ROI -.194 .557 -.094 -.348 .731 .260 3.853 Ln_ROE -.221 .315 -.147 -.702 .489 .435 2.300