Connecting
to
Compete
2010
Trade Logistics in the
Global Economy
The Logistics Performance Index and Its Indicators
• Except in high-income countries, the availability and quality
of trade-related infrastructure is a major constraint to
• Efficient border management and coordination of the
LPI 1–2.48 LPI 2.48–2.75
LPI 2.75–3.23 LPI 3.23–5
Connecting to Compete 2010
Trade Logistics in the Global Economy
The Logistics Performance Index and Its Indicators
Jean-François Arvis
The World Bank
Monica Alina Mustra
The World Bank
Lauri Ojala
Turku School of Economics
Ben Shepherd
The World Bank
© 2010 he International Bank for Reconstruction and Development/he World Bank 1818 H Street NW
Washington, DC 20433 Telephone: 202-473-1000 Internet: www.worldbank.org E-mail: [email protected]
All rights reserved
he indings, interpretations, and conclusions expressed herein are those of the authors and do not necessarily relect the views of the Executive Directors of the International Bank for Reconstruc-tion and Development/he World Bank or the governments they represent.
he World Bank does not guarantee the accuracy of the data included in this work. he boundar-ies, colors, denominations, and other information shown on any map in this work do not imply any judgment on the part of he World Bank concerning the legal status of any territory or the endorse-ment or acceptance of such boundaries.
Rights and Permissions
he material in this publication is copyrighted. Copying and/or transmitting portions or all of this work without permission may be a violation of applicable law. he International Bank for Reconstruction and Development/he World Bank encourages dissemination of its work and will normally grant permission to reproduce portions of the work promptly.
For permission to photocopy or reprint any part of this work, please send a request with complete information to the Copyright Clearance Center Inc., 222 Rosewood Drive, Danvers, MA 01923, USA; telephone: 978-750-8400; fax: 978-750-4470; Internet: www.copyright.com.
All other queries on rights and licenses, including subsidiary rights, should be addressed to the Oice of the Publisher, he World Bank, 1818 H Street NW, Washington, DC 20433, USA; fax: 202-522-2422; e-mail: [email protected].
If you have any questions or comments about this report, please contact:
International Trade Department he World Bank
1818 H Street NW, Room MSN G4-176, Washington, DC 20433 USA Telephone: 202-473-8922
E-mail: [email protected]
Web site: www.worldbank.org, www.worldbank.org/trade, or www.worldbank.org/lpi
Foreword
his is the second edition of Connecting to
Com-pete: Trade Logistics in the Global Economy,
which was irst published in November 2007. he Logistics Performance Index (LPI) and its indicators are a joint venture of the World Bank, logistics providers, and academic partners. he LPI is a comprehensive index created to help countries identify the challenges and opportu-nities they face in trade logistics performance. he World Bank conducts the LPI survey every two years.
Logistics encompasses an array of essen-tial activities—from transport, warehousing, cargo consolidation, and border clearance to in-country distribution and payment systems— involving a variety of public and private agents. A competitive network of global logistics is the backbone of international trade. Unfortu-nately, many developing countries have not yet beneited from the productivity gains of logis-tics modernization and internationalization implemented over the last 20 years by advanced economies.
Improving logistics performance has be-come an important development policy objec-tive in recent years because logistics have a major impact on economic activity. Evidence from the 2007 and 2010 LPIs indicates that, for coun-tries at the same level of per capita income, those with the best logistics performance experience additional growth: 1 percent in gross domestic product and 2 percent in trade. hese indings are especially relevant today, as developing coun-tries need to invest in better trade logistics to boost recovery from the current economic crisis and emerge in a stronger and more competitive position.
On a hopeful note, the 2010 LPI points to modest but positive trends in key areas such as customs, use of information technologies for
trade, and investment in private services. It also shows that logistics overperformers—countries with a higher LPI score than income would pre-dict—are countries that have consistently in-vested in reforms and improvements. he 2010 LPI highlights new areas that need further at-tention, such as the coordination of agencies involved in border clearance and the quality of domestic trucking and customs brokerage services.
Connecting to Compete 2007 helped spark di-alogue in several countries among various stake-holders in the government and between policy-makers and the private sector about measures to address logistics bottlenecks and facilitate inter-national trade and transportation. he
optimis-tic messages from Connecting to Compete 2010
should encourage countries to do even more, particularly important for countries whose trade logistics performance continues to be low.
With the LPI, the World Bank aims to focus attention on an issue of global importance and provide a platform for dialogue among govern-ment, business, and civil society. By showing how countries compare to others in the area of trade logistics and illuminating the costs of poor logistics performance, we hope the LPI will con-tinue to serve as a catalyst, helping policymakers and the private sector build the case for domes-tic policy reform, for investment in trade-related infrastructure, and for the regional and multi-lateral cooperation that is needed for countries to break out of the vicious circle of “logistics unfriendliness.”
his is the second report presenting a new data-set for the Logistics Performance Index (LPI) and indicators. he survey is conducted every two years to improve the reliability of the indi-cators and to build a dataset comparable across countries and over time.
he LPI survey would not have been possi-ble without the support and participation of the International Federation of Freight Forwarders Associations (www.iata.com), the Global Ex-press Association (www.global-exEx-press.org), the Global Facilitation Partnership for Transporta-tion and Trade (www.gfptt.org), ten major inter-national logistics companies, and a large group of
medium-size logistics companies worldwide. he survey was designed and implemented with Fin-land’s Turku School of Economics (www.tse.i), which has worked with the World Bank to de-velop the concept since 2000.
he authors express their gratitude to the hundreds of employees of freight forwarding and express carrier companies around the world who took the time to respond to the survey. heir participation was central to the quality and credibility of the project, and their continu-ing involvement and feedback will be essential as we develop and reine the survey and the LPI in future years.
his report was prepared by the World Bank’s International Trade Department (PRMTR), under the guidance of Bernard Hoekman (director) and Mona Haddad (sector manager). The project leaders and main authors were Jean-François Arvis and Monica Alina Mustra. Authors also included Professor Lauri Ojala (Turku School of Economics), Ben Shepherd, and Daniel Saslavsky (consultants).1
Gerard McLinden, Marc Juhel, Louis-Paul Tardif (Transport Canada), Aart Kraay, Andreas Dietrich Kopp, Lilya Repa, Charles Kunaka, Robin Carruthers, and Giuseppe Iarossi provided major inputs to the survey concept and the review
of the results. he authors are also grateful to Tapio Naula (USAID Regional Trade Liberaliza-tion and Customs Project) for providing material on Central Asia and to Yann Duval (UNESCAP Trade and Investment Division) for providing
material on East Asia. he LPI survey website2
was designed and developed by Patrick Tse and Stefen Soulejman Janus of the World Bank Insti-tute. he 2010 LPI website is produced and sup-ported by Arseny Malov and Adarsh Desai from the World Bank Institute under close guidance of the core team. Scott Johnson from the World Bank Information Solutions Group assisted the team with monitoring survey responses.
Foreword iii
Acknowledgments iv Authors v
LPI ranking and scores 2010 viii
Summary and key findings 1
1. The 2010 Logistics Performance Index 3
From awareness to implementation 3 Logistics performance in 2010: what’s new? 4 New features of the LPI survey 5
Key indings from the 2010 LPI 6
2. Unbundling logistics performance 14
Infrastructure 14 Services 14
Border procedures and time 16 Supply chain reliability 20
3. Policy priorities in trade facilitation and logistics 23
Infrastructure 24
Improving the quality of trade and transport services 24 Coordinating border management 24
Regional facilitation: making trade corridors work better 25
References 26
Appendix 1. International LPI results 28
Appendix 2. Domestic LPI results, by region and income group 32 Appendix 3. Domestic LPI results, time and cost data 35
Appendix 4. The LPI methodology 41
Appendix 5. Comparing the international LPI with other indicators 45
Notes 49
Boxes
1.1 Measuring logistics performance using the LPI 4
1.2 Private sector opinions matter 6
1.3 How precise are LPI scores and ranks? 11
1.4 Policy applications of the 2007 LPI at the regional and global levels 12
2.1 Trade logistics and facilitation in landlocked Central Asia 21
Figures
1.1 Lead time to export 5
1.2 Cumulative distribution of LPI scores, 2010 7
1.3 2010 LPI score, average and minimum/maximum range by income group 9
1.4 Distribution of country performance across income levels, by LPI quintile 9
1.5 LPI overperformers and underperformers in 2010, relative to income per capita 10
1.6 Number of countries with a statistically signiicant change in the LPI from 2007 to 2010, by income group 11
1.7 LPI score as percentage of highest LPI score, by LPI quintile, 2007 and 2010 12
2.1 Respondents indicating high or very high average quality of services and policy restrictiveness of distribution services 15
2.2 Median import lead time and average clearance time, by LPI quintile 16
2.3 Median export lead time, by LPI quintile 17
2.4 Red tape afecting import and export transactions, by LPI quintile 18
2.5 Compliance with overseas security requirements compared with 2005, by LPI quintile 19
2.6 Comparison of UNCTAD Liner Shipping Connectivity Index and the LPI measures of the transshipment constraint 20
2.7 Structure of logistics costs faced by traders 21
2.8 Respondents indicating shipments are oten or nearly always cleared and delivered as scheduled, by LPI quintile 22
2.9 Shipments not meeting company quality criteria, by LPI quintile 22
A5.1 Relation of the share of parts and components in total exports and the LPI score 46 A5.2 Relationship of Global Enabling Trade Index 2009 and 2010 LPI 47
A5.3 Doing Business trade facilitation data and LPI 2010 47
A5.4 Doing Business import time versus LPI lead import time (median) for port/airport 48
Tables
1.1 Top 10 logistics performers 2010 7
1.2 Bottom 10 logistics performers 2010 7
1.3 Top 10 logistics performers 2010, upper middle-income countries 8
1.4 Top 10 logistics performers 2010, lower middle-income countries 8
1.5 Top 10 logistics performers 2010, low-income countries 8
1.6 Respondents indicating an improved or much improved logistics environment since 2005, by LPI quintile 13
2.1 Respondents indicating high or very high quality of infrastructure in listed areas, by LPI quintile 14
2.2 Respondents indicating high or very high competence and quality of service in listed sectors, by LPI quintile 15
2.3 Respondents indicating that listed customs procedures are available and being used, by LPI quintile 17
2.4 Respondents indicating that listed border agencies are of high or very high competence and quality, by LPI quintile 17
2.5 Respondents indicating that they oten or nearly always experience delay factors, by LPI quintile 19
2.6 Export distance, cost, and time in landlocked countries 20
3.1 Typology of countries according to impediments to logistics performance 23
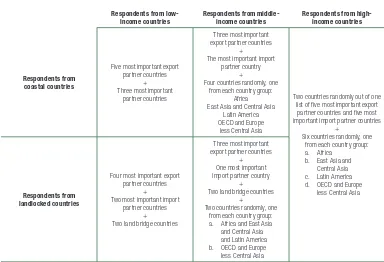
A4.1 Methodology for selecting country groups for survey respondents 42 A4.2 Results of principal component analysis for the international LPI 43 A4.3 Component loadings for the international LPI 43
Economy
Germany 1 4.11 100.0
Singapore 2 4.09 99.2
Sweden 3 4.08 98.8
Netherlands 4 4.07 98.5
Luxembourg 5 3.98 95.7
Switzerland 6 3.97 95.5
Japan 7 3.97 95.2
United Kingdom 8 3.95 94.9
Belgium 9 3.94 94.5
Norway 10 3.93 94.2
Ireland 11 3.89 92.9
Finland 12 3.89 92.6
Hong Kong SAR, China 13 3.88 92.4
Canada 14 3.87 92.3
United States 15 3.86 91.7
Denmark 16 3.85 91.4
France 17 3.84 91.3
Australia 18 3.84 91.2
Austria 19 3.76 88.7
Taiwan, China 20 3.71 86.9
New Zealand 21 3.65 85.0
Italy 22 3.64 84.9
Korea, Rep. 23 3.64 84.7
United Arab Emirates 24 3.63 84.5
Spain 25 3.63 84.3
Czech Republic 26 3.51 80.5
China 27 3.49 79.9
South Africa 28 3.46 78.9
Malaysia 29 3.44 78.4
Poland 30 3.44 78.2
Israel 31 3.41 77.5
Bahrain 32 3.37 76.2
Lebanon 33 3.34 75.1
Portugal 34 3.34 75.0
Thailand 35 3.29 73.6
Kuwait 36 3.28 73.2
Latvia 37 3.25 72.2
Slovak Republic 38 3.24 71.9
Turkey 39 3.22 71.4
Saudi Arabia 40 3.22 71.3
Brazil 41 3.20 70.6
Iceland 42 3.20 70.5
Estonia 43 3.16 69.3
Philippines 44 3.14 68.8
Lithuania 45 3.13 68.5
Cyprus 46 3.13 68.4
India 47 3.12 67.9
Argentina 48 3.10 67.4
Chile 49 3.09 67.3
Mexico 50 3.05 65.7
Panama 51 3.02 65.0
Hungary 52 2.99 63.8
Economy
Vietnam 53 2.96 63.1
Greece 54 2.96 62.8
Qatar 55 2.95 62.6
Costa Rica 56 2.91 61.3
Slovenia 57 2.87 60.2
Senegal 58 2.86 59.8
Romania 59 2.84 59.1
Oman 60 2.84 59.1
Tunisia 61 2.84 58.9
Kazakhstan 62 2.83 58.9
Bulgaria 63 2.83 58.8
Malta 64 2.82 58.6
Dominican Republic 65 2.82 58.5
Uganda 66 2.82 58.4
Peru 67 2.80 57.9
Uzbekistan 68 2.79 57.5
Benin 69 2.79 57.4
Honduras 70 2.78 57.1
Ecuador 71 2.77 57.0
Colombia 72 2.77 57.0
Macedonia, FYR 73 2.77 56.9
Croatia 74 2.77 56.8
Indonesia 75 2.76 56.5
Paraguay 76 2.75 56.3
Uruguay 77 2.75 56.3
Bahamas, The 78 2.75 56.1
Bangladesh 79 2.74 56.0
Syrian Arab Republic 80 2.74 55.9
Jordan 81 2.74 55.8
Mauritius 82 2.72 55.3
Serbia 83 2.69 54.1
Venezuela, RB 84 2.68 53.9
Congo, Dem. Rep. 85 2.68 53.8
El Salvador 86 2.67 53.7
Bosnia and Herzegovina 87 2.66 53.4
Madagascar 88 2.66 53.2
Azerbaijan 89 2.64 52.6
Guatemala 90 2.63 52.4
Kyrgyz Republic 91 2.62 52.0
Egypt, Arab Rep. 92 2.61 51.8
Georgia 93 2.61 51.8
Russian Federation 94 2.61 51.6
Tanzania 95 2.60 51.4
Togo 96 2.60 51.4
Guinea 97 2.60 51.2
Haiti 98 2.59 51.1
Kenya 99 2.59 51.0
Nigeria 100 2.59 51.0
Yemen, Rep. 101 2.58 50.8
Ukraine 102 2.57 50.6
Iran, Islamic Rep. 103 2.57 50.5
Moldova 104 2.57 50.5
Economy
Cameroon 105 2.55 49.7
Niger 106 2.54 49.4
Nicaragua 107 2.54 49.3
Jamaica 108 2.53 49.2
Côte d’Ivoire 109 2.53 49.2
Pakistan 110 2.53 49.1
Armenia 111 2.52 48.9
Bolivia 112 2.51 48.5
Gambia, The 113 2.49 48.0
Turkmenistan 114 2.49 47.9
Chad 115 2.49 47.9
Congo, Rep. 116 2.48 47.4
Ghana 117 2.47 47.3
Lao PDR 118 2.46 47.0
Albania 119 2.46 46.8
Comoros 120 2.45 46.5
Montenegro 121 2.43 45.9
Gabon 122 2.41 45.4
Ethiopia 123 2.41 45.4
Papua New Guinea 124 2.41 45.3
Maldives 125 2.40 45.1
Djibouti 126 2.39 44.8
Liberia 127 2.38 44.4
Bhutan 128 2.38 44.3
Cambodia 129 2.37 44.0
Algeria 130 2.36 43.7
Tajikistan 131 2.35 43.2
Libya 132 2.33 42.8
Myanmar 133 2.33 42.7
Botswana 134 2.32 42.3
Solomon Islands 135 2.31 42.0
Mozambique 136 2.29 41.5
Sri Lanka 137 2.29 41.4
Zambia 138 2.28 41.2
Mali 139 2.27 40.7
Guyana 140 2.27 40.7
Mongolia 141 2.25 40.2
Angola 142 2.25 40.1
Afghanistan 143 2.24 39.9
Fiji 144 2.24 39.7
Burkina Faso 145 2.23 39.4
Sudan 146 2.21 38.7
Nepal 147 2.20 38.6
Iraq 148 2.11 35.5
Guinea-Bissau 149 2.10 35.4
Cuba 150 2.07 34.3
Rwanda 151 2.04 33.4
Namibia 152 2.02 32.8
Sierra Leone 153 1.97 31.2
Eritrea 154 1.70 22.4
Somalia 155 1.34 10.9
his report presents the indings of the second edi-tion of Connecting to Compete, a report on the new dataset for the 2010 Logistics Performance Index (LPI) and its component indicators. he LPI is a multidimensional assessment of logistics perfor-mance, rated on a scale from one (worst) to five (best). It uses more than 5,000 individual country assessments made by nearly 1,000 international freight forwarders to compare the trade logistics pro-iles of 155 countries.
he 2010 LPI also provides a snapshot of selected performance indicators in nearly 130 countries, in-cluding expanded information on the time, cost, and reliability of import and export supply chains, infra-structure quality, performance of core services, and the friendliness of trade clearance procedures. he 2010 LPI and its indicators encapsulate the irsthand knowledge of movers of international trade, collected amid the economic turmoil of 2009.
he importance of eicient logistics for trade and growth is now widely acknowledged. Analysis based on the 2007 LPI or similar information has shown that better logistics performance is strongly associated with trade expansion, export diversiica-tion, ability to attract foreign direct investments, and economic growth. In other words, trade logis-tics matter.
World trade is moved between countries by a network of increasingly global logistics operators. But the ease with which traders can use this net-work to connect with international markets de-pends in large part on country-speciic factors such as trade procedures, transport and telecommunica-tions infrastructure, and the domestic market for support services. he LPI and its component indi-cators provide a unique global point of reference to better understand these key dimensions of logistics performance.
Germany and Singapore receive the highest rat-ings in the 2010 LPI with scores over 4.08, while Somalia ranks last with a score of 1.34. As observed in Connecting to Compete 2007, there is a large
logistics gap between high- and low-income coun-tries. he LPI scores of advanced economies and some emerging and transition economies are rela-tively high due to their well-developed trade facili-tation programs. But most countries are still in the process of addressing their performance bottlenecks. Although small diferences in scores and rankings of individual countries should be interpreted with caution, especially for countries in the intermedi-ate group of performers, the countries that have the worst performance —mostly least developed countries —are hampered by severe capacity con-straints that make sustained progress diicult.
Income is not the only determinant of a country’s logistics environment. Even in low-income countries, policymakers can do much to boost performance. Liberalizing logistics services markets, for example, can encourage local service providers to increase quality and price competitively. his is particularly important in sectors such as trucking and customs brokerage that are essential to eicient service deliv-ery by international forwarders.
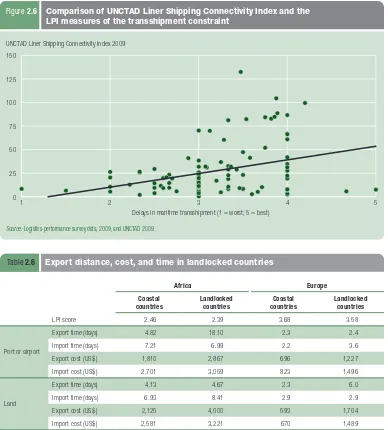
Countries with low LPI scores tend to have higher average times to import or export. But it is important to keep these delays in perspective. Lead times reported by international forwarders are much shorter than shipping times. Landlocked developing countries are at a disadvantage because they cannot control shipping conditions outside their borders. Importing into a landlocked developing country typ-ically takes a week longer than for its coastal neigh-bors, but times can vary widely, especially in Africa. Even more than time and cost, logistics perfor-mance depends on the reliability and predictability of the supply chain. he level of logistics service avail-able in the best performing countries is about double that in the lowest performing countries. In the low-est performing countries, importers and exporters incur extra costs as a result of the need to mitigate the efects of unreliable supply chains, for example, by increasing inventory to hedge against failed deliv-eries. he costs of poor performance ultimately fall
on end users or consumers. he relative—and oten even absolute—burden of such costs is highest in the least developed countries.
Unreliability of logistics can come in many forms in low performance countries. Excessive physical inspection or inappropriate reliance on inspector discretion causes large variations in clearance times, and multiple inspections are frequent. Increasingly strict safety and security measures impair service provision in all but the top ranking countries.
The information obtained from logistics professionals relected in the 2010 LPI is very relevant for helping to identify priorities for government agencies planning to implement reform agendas in cooperation with private stakeholders:
Except in high-income countries, the
•
availability and quality of trade-related infrastructure is a major constraint to performance—but the speciic priori-ties tend to vary across countries. In-formation technology infrastructure is widely available and widely used for trade processing, even in low-income countries. Countries in the interme-diate range of logistics performance tend to be relatively more impacted by the quality and availability of physical infrastructure (ports or roads). Rail services receive very low scores almost everywhere.
Eicient border management and
co-•
ordination of the various agencies in-volved in border clearance is increas-ingly important. The performance of agencies responsible for enforcement of sanitary and phytosanitary regulation —and to a lesser extent other types of product standards—appears to lag well behind customs in many countries. LPI survey respondents rate the activities of such agencies as a major factor leading to additional, sometimes redundant,
paperwork and inspection processes in the lowest performing countries. A major challenge for the international
•
community is how to help the lowest performing countries beneit from an increasingly open global trading system. hese countries need to make substan-tial improvements in logistics compe-tence, processes, and business practices, which may be diicult to attain given numerous other priorities. he challenge is compounded by the fact that many of these countries are landlocked and oten depend on transit countries that have low logistics performance themselves. To escape the resulting multiplicative ef-fects on trade costs, enhancing regional cooperation and implementing eicient transit systems on trade corridors is critical.
While Connecting to Compete 2010
high-lights priority areas for increased policy atten-tion, the report ofers an optimistic message. Lo-gistics professionals assess the trends in loLo-gistics and trade facilitation in their country of work to be generally positive. he use of increasingly standardized information technology solutions in logistics is widespread worldwide, and cus-toms reform has progressed in most countries, irrespective of their level of performance.
trade logistics performance
is directly linked with
important economic
outcomes, such as trade
expansion, diversiication
of exports, and growth
The 2010 Logistics Performance Index
S
From awareness to implementation
International trade is moved by a network of increasingly global logistics operators who deal with a number of functions in the international supply chains: ocean shipping, air freight, land transport, warehousing, and third party logis-tics. Globalization has made the demand for logistics services more sophisticated, pushing for integration and diversiication of services to help operate uninterrupted supply chains. Key
segments of the logistics industry3 are
domi-nated by 25 large corporations, especially in the maritime, port, and air freight segments.4 But
the industry remains much less concentrated in traditional subsectors that are more local in nature and have low costs of entry, such as trucking or “traditional” freight forwarding and customs brokerage. In global logistics the physi-cal movement of goods is supported by a chain of service providers who should work together seamlessly.
he ease with which exporters can connect to this logistics network5 depends on domestic
fac-tors such as infrastructure, trade procedures, and the market for trade-related support services. In-ternational companies trying to implement con-sistent standards worldwide ind that the level of service they can achieve depends on local oper-ating conditions in each country. A recent trade
facilitation audit in a Mediterranean country6
found that leading express carriers were not per-mitted to operate 24/7, own bonded facilities, or employ their own brokers—all basic prerequisites for delivering courier or parcel service.
Facilitating trade and transport is essential for countries to compete in the global market-place: traders need to be able to move goods and services across borders on time and with low transaction costs. Extensive recent research
evidence confirms this link. As measured by the World Bank’s Logistics Performance Index (LPI), trade logistics performance is directly linked with important economic outcomes, such as trade expansion, diversiication of exports, and growth (see appendix 5 for more details).
Countries wishing to improve trade logistics may need to reform and modernize border man-agement institutions, change transport regula-tion policy, and, in some cases, invest signii-cantly in trade-related infrastructure. he key issue—highlighted by the 2007 LPI—is that a trade supply chain is only as strong as its weak-est link. Determining where the weakweak-est links are and addressing them through targeted de-velopment interventions has therefore become a major element of the trade facilitation and lo-gistics agenda.
Until recently, policymakers and private sector stakeholders have not had the data they needed to identify trade constraints or create con-stituencies for reform. he LPI ills that gap. he irst edition (2007) helped intensify the dialogue between policymakers and the private sector in several countries about logistics bottlenecks and facilitating international trade and transporta-tion at the country or subregional level.
In the two years since the irst LPI, several countries have launched programs promoting improvements in logistics performance. Rather than separately addressing issues such as border procedures, port performance, international transit, or investment in services, more countries are implementing comprehensive programs to address the weakest links in their macro-supply chain and stimulate cooperation between public agencies and private stakeholders.
logistics. It prepared an action plan addressing the costs of international trade (port facilita-tion), as well as the unique logistics costs of a large archipelago. Vietnam has embarked on a similar process.
With the LPI, the World Bank aims to focus attention on an issue of global importance and provide a platform for dialogue among govern-ment, business, and civil society. By showing countries how they compare with their competi-tors and illuminating the costs of poor logistics performance, the LPI indicators can continue to serve as a catalyst, helping policymakers and the private sector build the case for reform— and helping countries break out of the vicious circle of “logistics unfriendliness.”
Logistics performance in 2010: what’s new?
he World Bank conducts the LPI survey every two years. he core approach remains the same as
in 2007: in the irst (international) part respon-dents assess six key dimensions of logistics per-formance in eight important overseas markets; in the second (domestic) part they provide detailed data on the logistics environment in their own country, including a mix of qualitative and quan-titative time and cost data (see box 1.1). hanks to increased private sector involvement in the LPI survey, country coverage for the interna-tional LPI has increased from 150 to 155.11
Although the LPI represents a useful bench-mark of a country’s logistics performance, the LPI survey also collects important and detailed data on domestic logistics and the time and cost burdens of import and export transactions. Country coverage for the domestic LPI has increased to nearly 130 countries. hese data allow practitioners, analysts, and policymakers to examine the determinants of logistics perfor-mance in individual countries. Used jointly, the international and domestic data can identify supply chain bottlenecks. Comparison of index
the World Bank’s Logistics Performance Index (LPI) summarizes the performance of countries in six areas that capture the most important aspects of the current logistics environment:
Eficiency of the customs clearance process.
•
Quality of trade and transport-related infrastructure.
•
Ease of arranging competitively priced shipments.
•
Competence and quality of logistics services.
•
Ability to track and trace consignments.
•
Frequency with which shipments reach the consignee within
•
the scheduled or expected time.
these areas range from traditional issues (customs procedures and infrastructure quality) to new concerns (tracking and tracing shipments, timeliness in reaching a destination, and the compe-tence of the domestic logistics industry).7 None of these areas alone can ensure good logistics performance. their selection is based on the latest theoretical and empirical research8 and on extensive inter-views with professionals involved in international freight logistics.9 the LPI uses standard statistical techniques to aggregate the data into a single indicator10 (see appendix 4 for a detailed description of the way in which the LPI is calculated). this approach makes it possible to conduct meaningful comparisons across countries, re-gions, and income groups, as well as to undertake country-speciic diagnostic work.
Because these vital aspects of logistics performance can best be assessed by operators on the ground, the LPI relies on a struc-tured online survey of logistics professionals from the companies
responsible for moving goods around the world: multinational freight forwarders and the main express carriers. Freight forward-ers and express carriforward-ers are in a privileged position to assess how countries perform. And their views matter, directly affecting the choice of shipping routes and gateways and inluencing irms’ deci-sions about production location, choice of suppliers, and selection of target markets. their participation is central to the quality and credibility of the LPI project, and their continuing involvement and feedback have been essential in further developing and reining the survey in this second edition of the LPI. Nearly 1,000 logistics pro-fessionals from international logistics companies in 130 countries participated in this edition of the LPI survey, a 25 percent increase from 2007—and a testament to the interest the LPI has generated in the private sector.
the LPI survey consists of two major parts offering two dif-ferent perspectives: international and domestic. the international LPI provides qualitative evaluations of a country, in the six areas described above, by its trading partners—logistics professionals working outside of the country. the domestic LPI provides both qualitative and quantitative assessments on the country by logistics professionals working inside it, including more detailed information on the logistics environment, core logistics processes, institutions, and performance time and cost data. this additional information on different aspects of logistics was used to interpret the LPI as well as validate and crosscheck the information underlying it.
the LPI questionnaire is available at www.worldbank.org/lpi.
the World Bank aims
to focus attention on an
issue of global importance
and provide a platform
for dialogue among
government, business,
and civil society scores across countries should therefore only be
a starting point for using the LPI.
New features of the LPI survey
he LPI survey has been reined in light of feed-back on the 2007 survey from users, policy-makers, and logistics professionals. There is very little change in the irst (international) section, in which respondents assess the same six key dimensions of logistics performance in eight important overseas markets as they did in 2007—thus maintaining a comparable way for computing the LPI. But the revised survey (conducted in 2009) collects extensive new information in the second (domestic) section— such as more detail about the customs clearance process—and increases the quality and scope of the quantitative physical performance indicators that can help support sound policymaking.
Expanded information includes:
Time/cost data for import and export
•
transactions.
Customs administration and procedures.
•
Border security measures (from an
ad-•
ditional question in the international section).
Quality data for infrastructure and
ser-•
vice providers.
he major innovation of the revised survey is the import and export time/cost data. Re-spondents self-identiied as having experience in export pre-carriage (between the seller’s factory and port or airport, excluding international ship-ping), export carriage (by land, between the sell-er’s factory and buysell-er’s warehouse), import on-carriage (between port or airport to the buyer’s warehouse), or import carriage (by land, between the seller’s factory and buyer’s warehouse).
hese distinctions enabled the LPI to iden-tify logistics concerns for speciic types of ship-ping, including important diferences between moving goods by land and by sea or by air. For example, respondents describing the export of a full load from their home country provided separate time and cost data for the two portions of the supply chain in their home country (ig-ure 1.1): export pre-carriage between the seller’s factory and port or airport and export carriage
by land between the seller’s factory and buyer’s warehouse.12
he revised survey instrument also provides extensive new details on the customs clearance process in the domestic section of the LPI, al-lowing a more nuanced analysis of particular aspects of customs and the clearance process. In addition to assessing clearance time and rat-ing the eiciency of customs as in 2007, respon-dents also assessed customs valuation methods; methods for determining whether or not ship-ments will be physically inspected; use of elec-tronic submission, pre-arrival clearance, and post-clearance audit procedures; and the trans-parency of customs procedures and administra-tion, including the extent of industry consulta-tion, advance notiication of regulatory changes, and availability of review or appeal procedures.
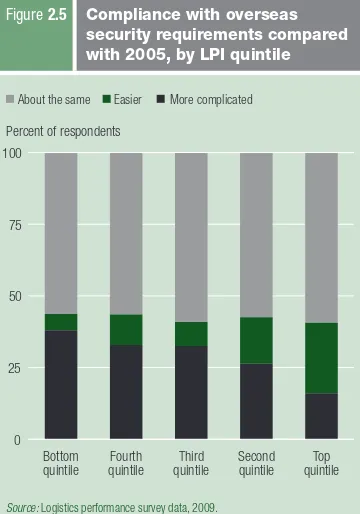
Relecting the important role now played by border security requirements, a new question on cargo security in the international part of the survey is designed to help assess the extent to which these measures constrain international supply chains. For each of the eight major trad-ing partners of their home country, respondents indicate whether it has become easier or more complicated to comply with cargo security re-quirements, such as screening and provision of advance information. he base year for compar-ative purposes is 2005.
The 2007 LPI focused on the quality of two types of infrastructure—transport and telecommunications—and the competence of
Source: Authors.
(shipper) (free carrier atFOB port of loading or equivalent)
DDP
having an LPI lower by
one point—such as 2.5
rather than 3.5—implies
two to four additional
days for moving
imports and exports
between the port and a
company’s warehouse
a range of logistics service providers. he 2010 LPI expands coverage in these areas in two ways. First, infrastructure data now separately iden-tify ports, airports, road, rail, warehousing, and transloading facilities, and information and communications (ICT) infrastructure. Second, respondents are now asked to assess both the competence and quality of core logistics service providers, such as transport operators, distribu-tors, freight forwarders, customs and border agencies, and shippers. Focusing on quality of service in addition to the competence of service providers provides important additional infor-mation on the determinants of overall logistics performance (box 1.2).
Key findings from the 2010 LPI
As in 2007, the 2010 LPI shows that high-income countries dominate the top logistics rankings (table 1.1). he list of countries in the global top 10 is very similar to the 2007 top 10.14 Most of them can be seen as key players in
the logistics sector, occupying important places in a variety of global and regional supply chains. he results mirror the openness of these coun-tries to international trade and investment as part of their successful economic development strategy.
By contrast, the 10 lowest performing coun-tries (table 1.2) are almost all from the low- and lower middle-income groups, geographically concentrated in Africa. In most cases, they
can be regarded as heavily marginalized from regional and global supply chains. Tables 1.3 through 1.5, which present the top 10 perform-ers by income group, largely reinforce these assessments.
How do the LPI scores and rankings relate to logistics performance on the ground? Using additional country-speciic information gath-ered in the survey, it is possible to give an idea of the average association between LPI scores and performance in particular areas. For example, having an LPI lower by one point—such as 2.5 rather than 3.5—implies two to four additional days for moving imports and exports between the port and a company’s warehouse. It also implies a rate of physical inspection that is 25
percentage points higher.15 hese indings show
the ways in which the LPI can be used to help identify bottlenecks and supply chain reliability problems in practice.
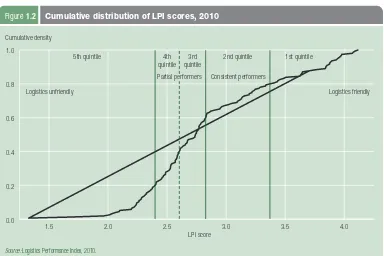
Figure 1.2 shows the cumulative distribu-tion of LPI scores, with vertical lines indicating the quintile boundaries.16 his report will oten
present the components of the LPI by quintiles (containing equal numbers of countries) to fa-cilitate reading the results. he ith (bottom) quintile contains the countries with the lowest LPI scores, the irst (top) quintile those with the highest score).
he distribution of LPI scores suggests four types of country logistics environments,
in-troduced in the 2007 edition of Connecting to
Compete: logistics unfriendly, or severely logis-tics constrained countries, such as least devel-oped countries (bottom quintile); partial per-formers, such as the low- and middle-income countries facing similar constraints (fourth and third quintiles); consistent performers, such as countries achieving better logistics performance than their income group (second quintile); and logistics friendly, high performers, for the most part high-income countries (top quintile). he challenges faced by these diferent groups will be discussed in sections 2 and 3.
The “logistics gap” persists
LPI scores are on average about 45 percent higher for high-income countries than for low-income countries (igure 1.3). his gap is to be the LPI combines quantitative and qualitative assessments within dual international
and domestic perspectives on logistics performance. Part 1 of the survey (international) relies on qualitative indicators—private sector experts rating performance of their trad-ing partners on the basis of their own opinions and experience—across a range of in-dicators on various dimensions of logistics performance. In contrast, part 2 (domestic) contains both qualitative assessments of the domestic logistics environment and quan-titative data on performance of domestic supply chains and core logistics processes (time, cost) by international professionals located in the country evaluated.
hallward-Driemeier and Aterido show that irm-level qualitative data correlate strongly with quantitative measures of the business environment, whether taken from within a survey (such as in the LPI) or from outside sources.13 this conirms that qualitative measures of constraints can capture meaningful variations across countries and within countries and therefore relect a real assessment of actual conditions on the ground and how important they are to the irm.
Economy
2010 LPI 2007 LPI LPI
rank
LPI score
% of highest performer
LPI rank
LPI score
% of highest performer
Germany 1 4.11 100.0 3 4.10 97.1
Singapore 2 4.09 99.2 1 4.19 100.0
Sweden 3 4.08 98.8 4 4.08 96.4
Netherlands 4 4.07 98.5 2 4.18 99.6
Luxembourg 5 3.98 95.7 23 3.54 79.5
Switzerland 6 3.97 95.5 7 4.02 94.5
Japan 7 3.97 95.2 6 4.02 94.8
United Kingdom 8 3.95 94.9 9 3.99 93.8
Belgium 9 3.94 94.5 12 3.89 90.7
Norway 10 3.93 94.2 16 3.81 88.1
Source: Logistics Performance Index, 2007 and 2010.
Table 1.1 Top 10 logistics performers 2010
Economy
2010 LPI 2007 LPI LPI
rank
LPI score
% of highest performer
LPI rank
LPI score
% of highest performer
Somalia 155 1.34 10.9 127 2.16 36.3
Eritrea 154 1.70 22.4 124 2.19 37.2
Sierra Leone 153 1.97 31.2 144 1.95 29.9
Namibia 152 2.02 32.8 126 2.16 36.3
Rwanda 151 2.04 33.4 148 1.77 24.3
Cuba 150 2.07 34.3 n/a n/a n/a
Guinea-Bissau 149 2.10 35.4 116 2.28 40.0
Iraq 148 2.11 35.5 n/a n/a n/a
Nepal 147 2.20 38.6 130 2.14 35.7
Sudan 146 2.21 38.7 64 2.71 53.6
Source: Logistics Performance Index, 2007 and 2010.
Table 1.2 Bottom 10 logistics performers 2010
1.5 2.0 2.5 3.0 3.5 4.0
0.0 0.2 0.4 0.6 0.8 1.0
Source: Logistics Performance Index, 2010.
Figure 1.2 Cumulative distribution of LPI scores, 2010
Cumulative density
5th quintile 4th quintile
3rd quintile
2nd quintile 1st quintile
Logistics unfriendly Logistics friendly
Consistent performers
Economy
2010 LPI 2007 LPI LPI
rank
LPI score
% of highest performer
LPI rank
LPI score
% of highest performer
China 27 3.49 79.9 30 3.32 72.8
Thailand 35 3.29 73.6 31 3.31 72.5
Philippines 44 3.14 68.8 65 2.69 52.9
India 47 3.12 67.9 39 3.07 64.9
Tunisia 61 2.84 58.9 60 2.76 55.3
Honduras 70 2.78 57.1 80 2.50 47.0
Ecuador 71 2.77 57.0 70 2.60 50.1
Indonesia 75 2.76 56.5 43 3.01 63.0
Paraguay 76 2.75 56.3 71 2.57 49.2
Syrian Arab Republic 80 2.74 55.9 135 2.09 34.1
Source: Logistics Performance Index, 2007 and 2010.
Table 1.4 Top 10 logistics performers 2010, lower middle-income countries
Economy
2010 LPI 2007 LPI LPI
rank
LPI score
% of highest performer
LPI rank
LPI score
% of highest performer
Vietnam 53 2.96 63.1 53 2.89 59.2
Senegal 58 2.86 59.8 101 2.37 42.8
Uganda 66 2.82 58.4 83 2.49 46.7
Uzbekistan 68 2.79 57.5 129 2.16 36.3
Benin 69 2.79 57.4 89 2.45 45.3
Bangladesh 79 2.74 56.0 87 2.47 46.1
Congo, Dem. Rep. 85 2.68 53.8 n/a n/a n/a
Madagascar 88 2.66 53.2 120 2.24 39.0
Kyrgyz Republic 91 2.62 52.0 103 2.35 42.3
Tanzania 95 2.60 51.4 137 2.08 34.0
Source: Logistics Performance Index, 2007 and 2010.
Table 1.5 Top 10 logistics performers 2010, low-income countries
Economy
2010 LPI 2007 LPI LPI
rank
LPI score
% of highest performer
LPI rank
LPI score
% of highest performer
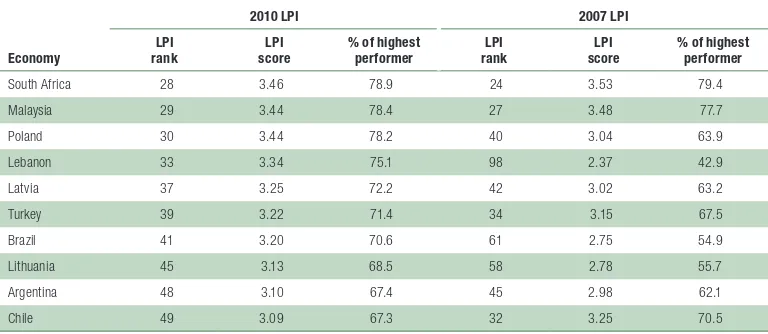
South Africa 28 3.46 78.9 24 3.53 79.4
Malaysia 29 3.44 78.4 27 3.48 77.7
Poland 30 3.44 78.2 40 3.04 63.9
Lebanon 33 3.34 75.1 98 2.37 42.9
Latvia 37 3.25 72.2 42 3.02 63.2
Turkey 39 3.22 71.4 34 3.15 67.5
Brazil 41 3.20 70.6 61 2.75 54.9
Lithuania 45 3.13 68.5 58 2.78 55.7
Argentina 48 3.10 67.4 45 2.98 62.1
Chile 49 3.09 67.3 32 3.25 70.5
Source: Logistics Performance Index, 2007 and 2010.
Policy has a strong
inluence on logistics
sector performance
expected. Low-income countries face severe constraints on infrastructure quantity and qual-ity, as well as human, technical, and inancial capacity. hese factors all negatively afect per-formance in a sector that is complex on a techni-cal level and requires a mix of public and private inputs to function eiciently.
Income alone does not explain logistics performance
Despite this logistics gap, country income alone does not account for the wide variety of performance levels across countries. Logis-tics performance varies considerably within income groups (tables 1.3–1.5 and igure 1.3). his assessment is reinforced by grouping LPI scores into ive equal-sized groups (quintiles) and examining the distribution of countries by quintiles across income groups (igure 1.4). Most high-income countries are in the top 20 percent of LPI performers, but other country income groups display considerably more dis-persion. Upper and lower middle-income coun-tries, for example, are distributed across all ive of the 2010 LPI quintiles—with scores ranging from the bottom group of logistics performers to the top. Even low-income countries have LPI scores across four of the ive quintiles. Vietnam, a low-income country, has an LPI score broadly comparable with those of some upper
middle-income countries and suiciently high to place it in the second 20 percent of logistics perform-ers worldwide.
Plotting an average relation between coun-try income and logistics performance makes it possible to identify over- and underperformers in the logistics sector (figure 1.5). An over-performer is a country with a higher LPI score than would be expected based solely on its in-come level, an underperformer a country with a lower than expected LPI score. Excluding high-income countries, the 10 most signiicant overperformers are Bangladesh, China, Demo-cratic Republic of Congo, India, Madagascar, Philippines, South Africa, hailand, Uganda, and Vietnam. he 10 most signiicant under-performers are Botswana, Croatia, Eritrea, Fiji, Gabon, Greece, Montenegro, Namibia, Russian Federation, and Slovenia. he existence of these two groups, as well as the general dis-persion in performance within income groups, suggests that policy has a strong inluence on lo-gistics sector performance.
A number of countries stand out (see ig-ure 1.5). Algeria, for example, has an LPI score of 2.36, ranking it 130 out of 155 countries. his is a low level of performance relative to its upper 1
Note: Vertical rules show minimum/maximum range.
Source: Logistics Performance Index, 2010.
Figure 1.3 2010 LPI score, average and
Top quintile, highest performance Second quintile, high performance
Percent
Third quintile, average performance Fourth quintile, low performance Bottom quintile, lowest performance
Source: Logistics Performance Index, 2010.
Figure 1.4 Distribution of country performance across
the overwhelming majority
of statistically signiicant
LPI changes are positive
middle-income status. Comparatively low logis-tics performance is a feature of many oil export-ing countries, possibly representexport-ing a signiicant drag on their broader economic integration and diversiication agendas.
China, in contrast, is a lower middle-income country with an LPI score (3.49) far higher than would be expected based solely on its income level, ranking it in the top 20 percent of logis-tics performers on par with such high-income countries as the Czech Republic. Of course, it is important not to overinterpret this result. Be-cause LPI survey respondents have much more experience with a country’s main international gateways than with its smaller or more remote border crossings, a high LPI score does not nec-essarily indicate uniformly strong performance within a large and diverse country.
Least developed countries with higher scores, such as Uganda (see section 2) or
Mada-gascar,17 also underscore the impact of
proac-tive trade and transport facilitation policies even in poor countries. Both have been rela-tively successful, despite post-conlict environ-ments, in improving their customs or trade infrastructure.18
Logistics performance is (slowly) improving
Results for the 2010 LPI are close to those for the 2007 LPI. he correlation between the two
LPI scores is just over 90 percent, with the rank correlation only slightly weaker at 87 percent.
A number of changes at the level of indi-vidual country ranks and scores might appear to be large at irst glance, but the LPI is subject to sampling error because of its survey method-ology. A vital part of the LPI dataset is the es-timated conidence interval for each country’s score (box 1.3). Only in cases where the coni-dence intervals for 2007 and 2010 do not over-lap can we conclude that a statistically signii-cant change has taken place.
Based on this criterion of nonoverlapping conidence intervals, 26 countries have
statisti-cally signiicant LPI changes.19 he
overwhelm-ing majority (25) of these changes are positive, indicating that overall logistics performance has improved (igure 1.6). Evident across all devel-oping country income groups, this pattern sug-gests that very little backsliding is occurring.20
he majority of these improvements (15 out of 25) are concentrated among lower middle-21 and
upper middle-income22 countries. Eight
low-income countries show statistically signiicant
improvements in their performance,23 but only
two high-income economies do so.24
Among the countries showing statistically signiicant improvement, Colombia has imple-mented key reforms, such as an interagency single window, has approved a national logistics
4 5 6 7 8 9 10 11 12
Note: Fitted values are based on an ordinary least squares regression using data for all countries. Underperformers (black diamonds) are defined as the non-high income countries with the 10 smallest residuals. Overperformers (black circles) are defined as the non-high income countries with the 10 largest residuals. Other oil-producing countries are represented by triangles.
Source: Logistics Performance Index, 2010, and World Bank 2008b.
Figure 1.5 LPI overperformers and underperformers in 2010, relative to income per capita
Log of GNI per capita (US$)
Philippines Thailand
action plan, and is setting up a logistics observa-tory to assess its performance at a ine level and monitor the impact of reforms. Brazil is follow-ing a similar track to address “Custo Brasil.”
Other countries are introducing reforms. In 2009 Tunisia established a national logistics council—involving the lead government agen-cies and the private sector and reporting to the
Prime Minister —to implement a comprehensive action plan building on earlier successes, nota-bly in port facilitation. Some key components of the action plan dealing with border procedures, ports, and logistics services were included in the competitiveness program designed with the Eu-ropean Union, the World Bank, and the Afri-can Development Bank. Morocco has developed a similar program.
It is not a coincidence that overachievers among emerging economies have followed the same strategy as top high-income countries, which have also outlined or are currently devel-oping advanced national logistics policies to en-hance their competitiveness. Germany, ranked irst in the 2010 LPI, issued a Freight Transport and Logistics Masterplan in 2008. Similar doc-uments are being drated in a number of other countries, such as Sweden and Finland, ranked 3 and 12 in the 2010 LPI.
Policymakers clearly recognize the impor-tance of trade facilitation and logistics and are making visible eforts to put in place the struc-tures needed to boost performance. Since its launch in 2007, the LPI and its component in-dicators have gained rapid acceptance, used by policymakers and professionals at the national, regional, and global levels (box 1.4).
Another change since the 2007 version
Source: Logistics Performance Index, 2007 and 2010.
Figure 1.6 Number of countries with a statistically significant change in the LPI from 2007 to 2010, by income group
Significant LPI increase Significant LPI decrease
Number of countries
Although representing the most comprehensive and comparable data source currently available on country logistics and trade facilitation environments, the LPI and its components have their own domain of validity. First, the experience of international freight forwarders sur-veyed may not represent the broader logistics environment in poor countries, where they tend to co-exist with more traditional operators. the two groups’ interactions with government agencies, as well as the service levels they offer, might differ signiicantly. In most developing countries, agents or afiliates of international networks tends to serve large companies and operate at different levels of performance than traditional trading networks, including in terms of time and costs.
Second, in the case of landlocked or island countries, the LPI may capture access problems outside the country being assessed— for example, transit dificulties. the low rating of a landlocked coun-try such as Rwanda might not give full justice to its efforts to reform and facilitate trade because it is dependent upon long international
transit routes (through tanzania or Kenya, plus Uganda), the efi-ciency of which is dependent upon others.
As an additional aid to interpretation, LPI scores are presented with approximate conidence intervals (appendix 4). these ranges are designed to take into account the sampling error created by LPI’s survey-based dataset. they make it possible to provide upper and lower bounds for a country’s LPI score and rank.25 Conidence intervals tend to be broader for the third and fourth quintile. It is important to pay close attention to conidence intervals before concluding that a change in score or a difference between two scores is signiicant. As shown in igure 1.6, only when the lower bound of a country’s 2010 LPI score is higher than its 2007 upper bound can it be concluded that there has been a statistically signiicant improvement in performance.
For these reasons, excessive reliance on the exact ranking may not be as relevant for policymakers as the country’s wider performance group or the existence of statistically signiicant improvements.
the 2007 and 2010 LPI.34 he relative score is
higher in 2010 across all quintiles, consistent with a gradual convergence of logistics perfor-mance, because all countries are now perform-ing better compared with the country with the highest score (igure 1.7). Logistics performance appears to have improved in all groups, except for the top 20 percent. Although this develop-ment is potentially signiicant from the point of view of developing country competitiveness and integration with the world economy, it is impor-tant not to overstate it. he gap between the top performing countries and the lowest perform-ing countries remains large and will require sub-stantial time and resources to close.
he assessment of widespread, if gradual, improvement in the logistics environment is confirmed by other qualitative assessments from the LPI survey. Consider the percentage of survey respondents in each LPI quintile who
2007 2010
Percent
Source: Logistics Performance Index, 2007 and 2009.
Figure 1.7 LPI score as percentage of highest LPI score, by LPI quintile, 2007 and 2010
At the global level, a number of prominent reports have made ex-tensive use of 2007 LPI data. the World Economic Forum’s Global Enabling Trade Report 2009 uses LPI data in its composite Enabling trade Index to capture important aspects of supply chain perfor-mance affecting the extent of international economic integration. the World Bank’s Global Monitoring Report 2008 uses the LPI to highlight the importance of trade logistics for developing country competitiveness and the ways in which the sector can help coun-tries reap the beneits of globalization and ight poverty. the United Nations Industrial Development Organization’s Industrial Develop-ment Report 2009 emphasizes the important role that logistics can play in helping poor countries become more competitive in breaking into new sectors and markets.
Another important policy application of the LPI, the United States Agency for International Development’s Estimating the Global In-Country Supply Chain Costs of Meeting the Millennium Development Goals by 2015,26 notes that supply chain performance can be an important determinant of a country’s ability to meet some health-related aspects of the Millennium Development Goals, be-cause they require the eficient and cost-effective distribution of medicines and medical supplies. Using data from the LPI and other sources, the authors analyze logistics costs across 49 International Development Association countries and develop a costing model designed to aid practitioners and policymakers in assessing the investments required to support achievement of the Millennium De-velopment Goals by 2015.
A variety of regional policy initiatives have also made extensive use of the LPI. For example, a recent assessment of the Greater
Mekong Subregion’s East-West Economic Corridor used the LPI to highlight important cross-country divergences in performance and the need to pay particular attention to reforms in Myanmar and Laos.27 the Economic Commission for Latin America and the Caribbean used the LPI as a benchmarking and diagnostic tool in analyzing the transport system challenges facing landlocked countries in South America.28 the Asia-Paciic Economic Coop-eration Secretariat highlighted the importance of the LPI’s holistic approach to assessing performance and its strong links to evolving commercial practices in the sector.29 helble and colleagues used LPI data in constructing measures of transparency in the trading environment, which they show can constitute a major source of trade gains in the Asia-Paciic region.30 And the World Economic Forum’s Africa Competitiveness Report 2009 used LPI data and the Enabling trade Index to highlight how the logistics sector con-strains export performance in a number of African countries.31 the LPI can also be used to diagnose particular supply chain con-straints in the regional context, as did Raballand and Macchi to show that the quality of transport services in Africa is low com-pared with other regions.32
As Daniel Ikenson of the Cato Institute concluded in 2008, “suc-cessful participation in the global economy will be increasingly de-termined by whether a country maintains high-quality, reliable trade infrastructure, whether competition is permitted to lourish in the logistics services industries, and whether the regulatory environ-ment is conducive to the relatively frictionless moveenviron-ment of goods and services through the supply chain.”33
Percent of respondents
Bottom quintile (lowest performance)
Fourth quintile (low performance)
Third quintile (average performance)
Second quintile (high performance)
Top quintile (highest performance)
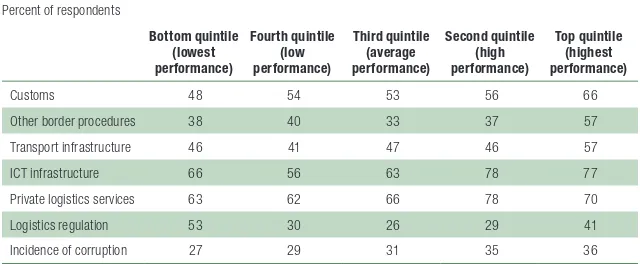
Customs 48 54 53 56 66
Other border procedures 38 40 33 37 57
Transport infrastructure 46 41 47 46 57
ICT infrastructure 66 56 63 78 77
Private logistics services 63 62 66 78 70
Logistics regulation 53 30 26 29 41
Incidence of corruption 27 29 31 35 36
Source: Logistics performance survey data, 2009.
Table 1.6 Respondents indicating an improved or much improved logistics environment since 2005, by LPI quintile say that particular elements of the logistics
the quality of services
sector regulation can be
an important determinant
of sector performance
he Logistics Performance Index (LPI) survey contains detailed information on countries’ logistics environments, core logistics processes and institutions, and performance time and cost data. In the domestic LPI, respondents assess the logistics environment in the country where they work. his information can be used to analyze the major determinants of overall logistics per-formance, focusing on four main groups of fac-tors: infrastructure, services, border procedures and time, and supply chain reliability. Country performance in these areas tends to be a strong determinant of overall logistics performance.
Infrastructure
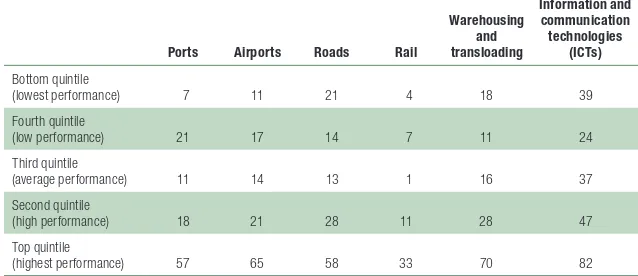
Two pronounced trends emerge in the percent-age of LPI survey respondents who consider that infrastructure in their country is of high or very high quality, averaged across LPI quintiles (table 2.1). First, satisfaction with infrastructure quality is much higher among top- performing countries than in the other four quintiles. Diferences among the four other groups are
relatively small compared with the diference between them and the top performers, espe-cially for infrastructure such as logistics facili-ties (warehousing) or airports that are depen-dent on management quality or public–private partnerships. Infrastructure quality appears to be a widespread constraint on logistics perfor-mance in developing countries.
Second, satisfaction is not constant across infrastructure types included in the LPI survey. In all groups, survey participants view the qual-ity of information and communication tech-nologies (ICT) infrastructure as superior to that of other types of infrastructure, with two or three times more respondents indicating that ICT infrastructure is high or very high quality compared with other infrastructure. In con-trast, rail infrastructure appears to be a prob-lem: rail is rated as being of high or very high quality by at most half as many survey respon-dents as in other areas—frequently far fewer. Evident across all performance groups, this pat-tern suggests systematic dissatisfaction with rail infrastructure. Road infrastructure appears to be slightly less of a problem across performance groups than other types of infrastructure, but road quality is of higher concern in the third and fourth quintile of performance.
Services
he quality and competence of core logistics service providers is also an important aspect of overall country performance. he quality and competence of freight forwarders35 tends to
be signiicantly higher than that of other ser-vice providers in all LPI performance quintiles (table 2.2). here is a higher correlation between quality of services and overall level of logistics performance than is the case for infrastructure,
Unbundling logistics performance
Ports Airports Roads Rail
Warehousing
(lowest performance) 7 11 21 4 18 39
Fourth quintile
(low performance) 21 17 14 7 11 24
Third quintile
(average performance) 11 14 13 1 16 37
Second quintile
(high performance) 18 21 28 11 28 47
Top quintile
(highest performance) 57 65 58 33 70 82
Source: Logistics performance survey data, 2009.
an observation consistent with the indicators on level of service (see igures 2.7 and 2.8 later in the section). Countries in the second quin-tile acknowledge an intermediate level of ser-vice quality, but there is less diference between countries in the three bottom quintiles.
Also important, in the air and maritime transport sectors survey respondents are signii-cantly more satisied with service providers than with infrastructure quality (compare tables 2.2 and 2.1), suggesting an important ongoing role for development of air and maritime transport infrastructure. But the low ranking for rail ser-vices is almost the same as for rail infrastructure, highlighting that survey respondents consider the two components to be very close. Rail qual-ity is assessed as low even in the top-perform-ing group, consistent with long-term trends in Europe of shiting from rail freight to trucking.
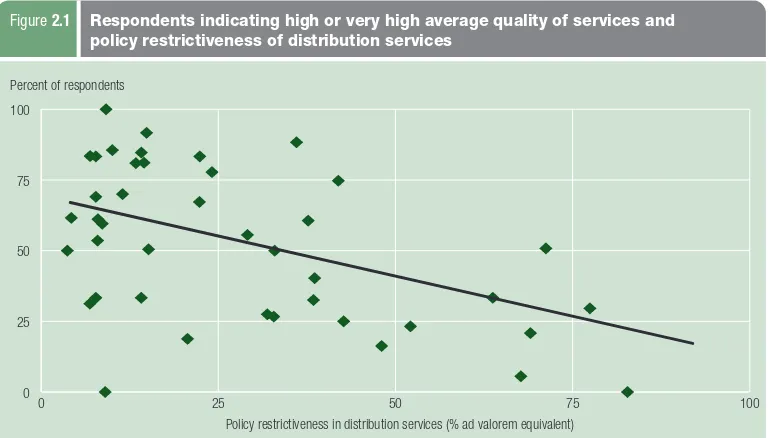
he quality of services sector regulation can be an important determinant of sector perfor-mance. Regulations supporting competition by lowering entry barriers and reducing the in-cidental costs falling on service providers can encourage quality upgrading and cost efective-ness. Figure 2.1 demonstrates this point, using data on trade restrictiveness in the wholesale and retail distribution sector (measured as the percentage markup over marginal cost induced
by trade-related regulations) as a proxy for the quality of regulation in core logistics sectors. Regulatory data were collected by an Organisa-tion for Economic Co-operaOrganisa-tion and Develop-ment survey and aggregated into a single index using standard econometric methods.
he downward sloping itted line in igure 2.1 indicates that more restrictive regulation—which imposes higher costs on operators—is associated with signiicantly lower average quality and com-petence of service providers. Policymakers there-fore have considerable scope to boost the scores reported in table 2.2 by implementing regulatory reform in core logistics services sectors.
Percent of respondents
Road transport
Rail transport
Air transport
Maritime transport and ports
Warehousing, transloading, and distribution
Freight forwarders
Bottom quintile
(lowest performance) 22 4 34 24 11 41
Fourth quintile
(low performance) 11 5 29 37 19 32
Third quintile
(average performance) 19 1 38 28 27 40
Second quintile
(high performance) 32 10 56 49 41 58
Top quintile
(highest performance) 66 31 76 71 67 75
Source: Logistics performance survey data, 2009.
Table 2.2 Respondents indicating high or very high competence and quality of service in listed sectors, by LPI quintile
0 25 50 75 100
0 25 50 75 100
Percent of respondents
Note: Policy restrictiveness is measured in percent ad valorem equivalent terms, the percentage difference between the cost of services at the border and their price within the domestic market. Measured in this way, the restrictiveness of services policies is expressed in an analogous manner to the ad valorem tariff in goods markets. Distribution is used as a proxy for the logistics sector because detailed data on logistics policies are not available.
Source: Logistics performance survey data, 2009, and Dihel and Shepherd 2007.
Figure 2.1 Respondents indicating high or very high average quality of services and policy restrictiveness of distribution services
there is a generally
higher level of satisfaction
with customs than with
other border agencies
Border procedures and time
he LPI includes several indicators of border procedures and time.
Import and export time
A useful outcome measure of logistics perfor-mance is the time taken to complete trade trans-actions. he median import lead time, as mea-sured by the LPI survey (let scale of igure 2.2), shows that lead time for port or airport supply chains is nearly twice as long in low performance countries as in high performance ones. For land supply chains the contrast is even stronger: lead time in low performance countries is more than ive times longer. hese times are strongly corre-lated with distance in both cases, with a correla-tion coeicient of 0.67 for port and airport sup-ply chains and 0.62 for land supsup-ply chains. his association suggests that geographic hurdles, and possibly internal transport markets, continue to pose substantial diiculties in those countries.
Of course, geography and speed en route are not the only factors that can afect import lead times. here is scope for reducing time across all dimensions of the border process (time to clear goods as opposed to lead time, which also includes transport), especially on the import side. Ongoing eforts at border management re-form need to focus on the prevalence of physi-cal inspection, proliferation of procedures, and red tape in low performance countries. In all
performance groups, the time taken to clear goods through customs is a relatively small fraction of total import time, but that time in-creases signiicantly when goods are physically inspected (see igure 2.2, right scale). Core cus-toms procedures converge strongly across all per-formance groups, but physical inspection—and even multiple inspections of the same shipment by diferent agencies—are much more common in low performance countries (table 2.3).
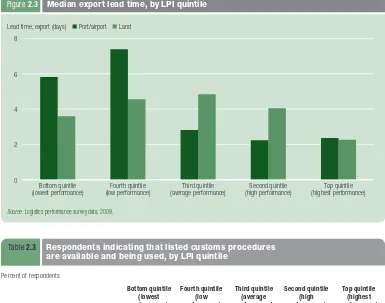
Export supply chains typically face fewer procedural burdens than imports, evidenced by the shorter lead time to exports than to imports (igure 2.3).
Customs is not the only agency involved in border management; collaboration among all border management agencies—including stan-dards, sanitary, phytosanitary, transport, and veterinary agencies—and the introduction of modern approaches to regulatory compliance are especially important. Evidence points to more streamlined processes by customs agencies, across performance groups (tables 2.3 and 2.4).
A corollary of the gradual convergence of customs procedures worldwide is that other border agencies are seen to be an increasingly serious constraint on supply chain performance in many countries. here is a generally higher level of satisfaction with customs than with other border agencies, such as quality and stan-dards inspection agencies and even more so with health or sanitary and phytosanitary agencies
0 Median lead time, import (days) Port/airport Land Average clearance time (days)
Clearance time with physical inspection
Clearance time without physical inspection
Source: Logistics performance survey data, 2009.