允許學生個人 非營利性的圖書館或公立學校合理使用
本基金會網站所提供之各項試題及其解答
重版
系統地複製或大量重製這些資料的任何部分,必
須獲得財團法人臺北市九章數學教育基金會的授權許
可
Page 2 of 8
Experiment 1
Measuring the Vitamin C Content in Various Samples
Vitamin C is an essential nutrient for humans and certain animal species. Vitamin C refers to the number of vitamers that contain vitamin C activity in animals, including ascorbic acid and its salts, and some oxidized forms of the molecule like dehydroascorbic acid. Ascorbate and ascorbic acid are both naturally present in the body when either of these is introduced into the cells, since the forms interconvert according to the pH. Vitamin C is a water soluble vitamin, and is essential for growth and development. Fruits and vegetables contain vitamin C, and some have more than others. Since iodine reacts quickly with vitamin C, a color change will be seen after the iodine has oxidized the entire vitamin C content. A color change is noted by a final reaction with starch. The number of drops can, then, be calculated into an estimated concentration of the amount of vitamin C.
Objectives
1. To measure the amount of vitamin C and the pH level in various samples of orange.
2. To find the correlation between the amount of vitamin C and the pH level.
You will need
1. Ascorbic acid solution as the basic standard (Plastic test jar A) 2. Commercial orange juice (Plastic test jar B)
3. Lemon water (Plastic test jar C)
4. Half fresh orange inside plastic test jar D, 5. Starch solution (Plastic test jar E)
6. Iodine (Plastic test jar F) 7. Plastic test jar G
8. 4 glass test tubes, with the following label; A, B, C, D. The test tubes have already 9. marked for volumes equal to 4 ml.
10.Pipettes
Page 3 of 8
What to do
1. Using the pH indicator stick, measure the pH level of samples in plastic test jar A, B, and C, by dipping it into the liquid sample and observing the color that appears. For an indicator, you can only see where its range is based on pH color standard.
Write down the results into the table on the answer sheet.
2. Add to the plastic test jar G, 10 drops of the starch solution from plastic test jar E
by pipette. Then, using the other pipette, add iodine drop by drop, and shake gently until the color changes to the shade of blue-black. Set this plastic jar aside as a positive control for later comparison.
3. Pour the Ascorbic acid solution (in plastic test jar A) to the mark indicated in Test Tube A. Add 20 drops of the starch solution. Using the other pipette, then, add iodine drop by drop and shake gently until the color changes to the shade of blue-black. Note the number of drops when the color changes (You will use the data as the standard)
4. Pour the commercial orange juice to the mark indicated in Test Tube B. Add 20 drops of the starch solution. Then, using the other pipette, add the iodine drop by drop, and shake gently until the color changes to blue-black. Note the number of drops when the color changes.
5. Repeat of step 4 for Test Tube C (lemon water).
6. To get the orange juice from the fresh oranges, squeeze the fruit and the juice out of the oranges into the plastic test jar D.
7. Using the pH indicator stick, measure the pH level of samples in plastic test jar D
with the same procedure as step 1.
8. Pick out the seeds, before pour into the Test Tube D. Repeat of step 4 for Test Tube D (fresh orange juice).
9. Calculate the vitamin C concentrations in all of the solutions using the following formula:
Use this as an example:
It took 44 drops of iodine solution to change the color of vitamin C solution. It took
Number of iodine drops in the sample solutions
Number of iodine drops in ascorbic acid solution =
Page 4 of 8
12 rops of iodine solution to change the color of the juice.
Vitamin C in the juice = 12/44, Vitamin C in the juice = 0,272 mg/ml
10. Write down the vitamin C concentration into the table on the answer sheet (8 points)
Questions:
1. Which sample has the highest pH level? Explain your answer! (1.5 points)
2. Which sample contains the lowest concentration of vitamin C? Explain your answer! (1.5 points)
3. Based on your experiment results, explain the correlation between vitamin C and pH level of your sample solutions! (2 points)
4. Vitamin C should be consumed every day. The average dose required for adults is 60-90 mg/day. How many milliliters of commercial orange juice (Test Tube B) must be consumed by adults, according to your data? (3points)
Page 5 of 8
Experiment 2
Play with Springiness Oscillations
Introduction:
There are so many matters that could be able to do oscillatory motion. Oscillation is base of wave motion. Every wave motion must be had oscillatory motion. However, not every oscillatory motion to be a wave motion. A spring able to do oscillatory motion. The motion could be made in either horizontally or vertically motion. In this experiment you are going to observing the vertically oscillatory motion of spring to avoid friction forces from floor. We neglect all air resistance.
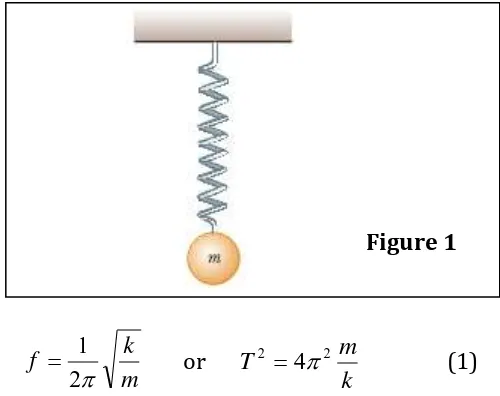
A ball is connected to a light spring suspended vertically, as shown in Figure 1. When displaced downward from its equilibrium position and released, the ball oscillates up and down. The frequency of oscillation will be affected by mass of ball and how the degree of spring stiffness. Mathematically, it can be formulated as:
m stiffness of the spring is also associated with number of turns.
The physics experiment test is divided into two parts. In this experiment, you will use the springs provided to observe the oscillatory motion to measure some oscillation parameters which are to determine the unknown mass of a material and to determine the spring constant, k.
Page 6 of 8
Materials and Provided Apparatus:
1. Springs (with N = 30, 40, 50, and 80 turns) 2. Retort Stand and clamp
3. Stopwatch 4. A hunger of load
5. Masses (3 pieces of plastic mass each 2 g) 6. A 30 cm ruler
Part 1: To determine mass of matter
In this part, you use 4 different springs and only mass of hunger, without the other mass of plastics. Period of spring oscillations are varied by using the number of spring coils.
Set-Up:
Figure 2
Retort Stand
Hunger of Load Spring
Mass
Spring
Stopwatch
Page 7 of 8
Procedure:
1. Suspend a spring vertically on the retort stand and clamp as shown in Figure 2. 2. Hung an unknown mass of hunger, M, at the end of spring.
3. Initiate the motion of mass by pulling the hunger from equilibrium and releasing it from rest. Observe oscillatory motion that happened.
4. Measure the duration for 20 oscillations by using stopwatch. Calculate the period of oscillation.
5. Repeat the step 1 until step 4 for the other spring.
6. Plot your 4 data in provided millimeter block paper to make a curve of square period of oscillation, T2, versus number of spring coils, N.
7. Make a straight line.
Questions:
1. If we get the value N is equal to 100/k,
k
N 100, from equation (1) and your curve, calculate the mass of unknown hunger! (6 points) 2. According to your experiment, what is the correlation between the stiffness
Page 8 of 8
Part 2: To determine the spring constant,
k
The instrument set up is similar to the Part 1.
Procedure
:
1. In this part, use only spring of N = 80 turns.
2. Use your result of mass of hunger in Experiment 1 to determine the constant of spring of 80 turns.
3. Do not use Hoke’s Law to determine the constant of spring!
4. Suspend a spring of 80 turns vertically on the retort stand and clamp as shown in
Figure 2.
8. Hung the calculated mass of hunger, M, at the end of spring.
9. Initiate the motion of mass by pulling the hunger from equilibrium condition and releasing it from rest. Observe oscillatory motion that happened.
10. Measure the duration for 20 oscillations by using stopwatch. Calculate the period of oscillation.
11. Add the mass of load by putting a piece of plastic of 2 g into the hunger. The mass of load now is m.
12. Repeat the step 9 until step 11 for the other two remain pieces of plastic.
13. Plot your data in provided millimeter block paper to make a curve of square period of oscillation, T2, versus mass of load, m.
14. Make a straight line.