Received August 2nd, 2011, Revised November 10th, 2011, 2nd Revision May 7th, 2012, Accepted for publication June 30th, 2012.
Copyright © 2012 Published by LPPM ITB & PII, ISSN: 1978-3051, DOI: 10.5614/itbj.eng.sci.2012.44.2.3
A Buffer Stock Model to Ensure Price Stabilization and
Availability of Seasonal Staple Food under Free Trade
Considerations
Wahyudi Sutopo1, Senator Nur Bahagia2, Andi Cakravastia2 & T.M.A. Arisamadhi2
1 Department of Industrial Engineering, Sebelas Maret University,
Surakarta 57126, Indonesia
2 Department of Industrial Engineering, Bandung Institute of Technology (ITB),
Bandung 40132, Indonesia Email: [email protected]
Abstract. The price volatility and scarcity have been became a great problem in the distribution system of seasonal staple food produced by agro industry. It has salient supply disparity during the harvest and planting season. This condition could cause disadvantages to the stakeholders such as producer, wholesaler, consumer, and government. This paper proposes a buffer stock model under free trade considerations to substitute quantitative restrictions and tariffs by indirect market intervention instrument. The instrument was developed through buffer stock scheme in accordance with warehouse receipt system (WRS) and collateral management system. The public service institution for staple food buffer stock (BLUPP) is proposed as wholesaler’s competitor with main responsibility to ensure price stabilization and availability of staple food. Multi criteria decision making is formulated as single objective a mixed integer non linear programming (MINLP). The result shows that the proposed model can be applied to solve the distribution problem and can give more promising outcome than its counterpart, the direct market intervention instrument.
Keywords: BLUPP; buffer stocks; indirect market intervention; MINLP; price stabilization; staple food availability; warehouse receipt system.
1
Introduction
domestic supply has several weaknesses such as a low level of sugarcane productivity per hectare, a low level of sugar plant efficiency, and the price distortion in the global market [6-7].
The three causes mentioned above, that can cause price volatility and scarcity, will bring disadvantages and market risks to all stakeholders such as producer, wholesaler, consumer, and government [1-2], [4-6]. The producer is forced to sell staple food at the lowest price in excess supply periods. Conversely, the consumer has to deal with the scarcity of staple food and price hikes in excess demand periods. On the other hand, the wholesaler suffers a larger procurement cost in the harvest season and lack of stock in the planting season. Thus, the government is not really success to ensure food security for people and welfare for business entities involved in the sugar distribution system.
There were many models of direct market intervention (DMI) to tackle price volatility and scarcity problems. The government in each country could implement diverse approaches such as floor ceiling prices [1-2], [4-6], [8-9], buffer funds [10-14], export or import taxes [15-17], and subsidies [18-19]. Unfortunately, since countries involved in general agreement on trade and tariff (GATT), each country must reduce the instruments of DMI in accordance with GATT principles to minimize barrier and quantitative restrictions in international trade [20]. Therefore, this situation forced each government to explore a new instrument that conforming to GATT principles in free market (FM). None of the papers cited above provides appropriate model to solve the case study by considering the three causes of salient supply disparity in the sugar distribution in Indonesia, i.e. supply shortage, expensive price, and price distortion in global market.
This paper is organized as follows. Section 1 describes the background of the research, including the problems in real system, and indicates the research gap. The IMI approach is presented in Section 2. Section 3 contains the mathematical model to solve the IMI instrument. The solution method and analysis are explained in Section 4. And finally in Section 5, the conclusion and future research are delivered.
2
The Indirect Market Intervention Approach
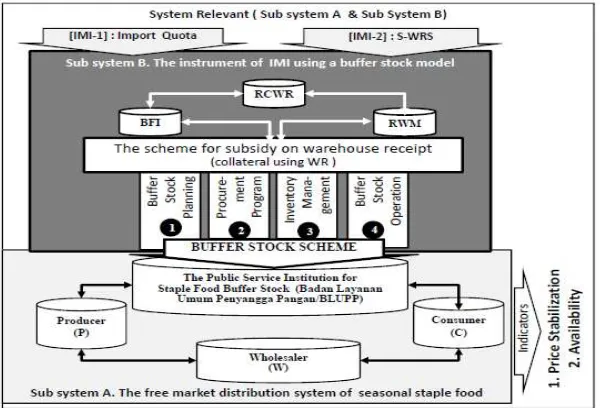
Figure 1 (sub system A) describes the distribution system of seasonal staple food. There is no damage when the staple food is being stored in warehouse and it cannot be replaced by substitute products. The current distribution system consists of three main structural entities namely producer (P), wholesaler (W), and consumer (C). In harvest season, producer sells staple food to wholesaler and wholesaler sells them to consumer. The purchasing price and selling price are set by the basic laws of supply and demand. In planting season, only wholesaler sells staple food to consumer and it is often that wholesaler with excess inventory will speculate the market by increasing price. In the proposed system, a new entity namely BLUPP (the public service institution for staple food buffer stock) is recommended as wholesaler’s competitor. The performance of distribution system is measured by price stability and availability.
Figure 1 (sub system B) shows the instrument of IMI using a buffer stock model. The staple food distribution system will be intervened by IMI instrument where the government indirectly influences the market supply and demand equilibrium in intervened market (IM). The BLUPP develops buffer stock scheme in accordance with WRS and CMS as IMI instrument namely the scheme for subsidy on warehouse receipt system (S-WRS). There are three institutions involved for implementing the S-WRS i.e. Registered Warehouse Management (RWM), Bank or Financial Institutions (BFI), and Registration Center for Warehouse Receipt (RCWR) [23-24]. The RWM refers to the management that operates the warehouse as a business entity which keeps, maintains, and supervises the staple food stored by owner and authorizes to issue a warehouse receipt (WR). The WR means a document which is a proof of stapel food ownership stored in RWM, issued by RWM manager. The BFI means a commercial bank or a financial company that finances and administers the funding of S-WRS. The RCWR means a legal business entity that administers WR and its derivatives.
Indirect market intervention (IMI) approach is summarized in system relevant (sub system A & sub system B). The proposed model assumes that total production is lower than total consumption. Consequently, BLUPP is permitted to import staple food in accordance with quota to anticipate the market shortage (IMI-1). BLUPP has privilege to access the S-WRS (IMI-2) in order to perform its responsibility. BLUPP gives WR to BFI for accessing loan. In turn, this action would not only lead to the increasing of selling price, but also give the BLUPP cash to cover its operational cost. The BLUPP then can obtain back their pawned from RWM and sell them under profitable selling price, by returning their loan to BFI along with administration and interest charge. The financial facilities are not given to BLUPP directly, but it given to BFI as an attractive interest rate on S-WRS to reduce the quantitative restrictions and tariffs. In this paper, BLUPP receives loan from bank or financial institution to perform its responsibilities to guarantee the availability and to stabilize the price in the consumer market. Interest cost is incurred as the operational cost burden. Attractive S-WRS determined by government plays role as source of additional income for BLUPP to perform its activities while assuring profit gain. Hence, it is clear that S-WRS only affects BLUPP profit directly, and S-WRS rate doesn’t influence the price competition in the market directly.
past 5 years, the maximum buying price for consumer is 9,600 IDR. Hence, consumer can expect the reasonable price below 9,600 IDR. Reasonable price for producer is price that can cover the producer’s costs with additional profit margin. The producer’s cost is 7,000 IDR; hence the reasonable price for producer must be above 7,000 IDR.
The price must be determined in high enough to cover the seller's costs and a reasonable margin. The non-speculative wholesaler expects all stocks can be sold with reasonable profit. Reasonable profit for wholesaler is the price that high enough to cover the seller's costs in reasonable margin. Using this fact, we can assume that reasonable price for consumer ≥ reasonable price for wholesaler ≥ reasonable price for producer. BLUPP can execute its responsibility with minimum cost and reasonable profit. As a result, the government can keeps away the staple food crisis and enhances welfare for business actors.
3
The Buffer Stock Model Formulation
Before presenting mathematical formulation, the following are the assumptions and notations.
3.1
Assumptions
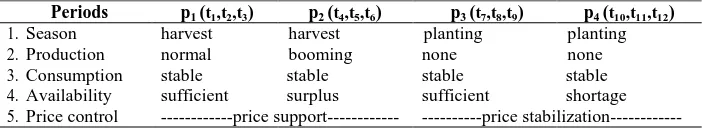
The buffer stock model formulation in this paper is developed based on the following assumptions. Table 1 lists some relevant market situation along the planning horizon of supply and demand. The length of the planning horizon is 12 months (t1 to t12) and can be divided as 4 periods, starts with the beginning of harvest season, the end of harvest season, the beginning of planting season, and ends with the end of planting season. In indirect market intervention (IMI), the market price is determined by the theory of supply and demand and buffer stock schemes organized by BLUPP. In harvest season, BLUPP affects the amount of staple food in market by determining both the amount of staple food guaranteed as WR and the amount directly sold to the market. Conversely, the BLUPP can manipulate the market’s availability in planting season when they obtain back their pawned from the RWM and sell them to market. This phenomenon represents short-term supply and demand problem so that could be solved by implementing IMI instruments (IMI-1 and IMI-2).
plants, or applying innovative production technique for the last 5 years. Hence, we can conclude that the quantity of staple production can be considered deterministic.
Domestic demand is assumed proportional to number of population, i. e. calculated by the multiplication of per capita consumption and number of population. Since the population growth can be acquired from authorized reliable source (BPS) and the number is commonly small (2-4%), we can assume that the quantity of sugar consumption also follow the same growth. Using the same analogy for sugar production, i. e. the quantity can be well predicted, the rationale for sugar production can be applied to sugar consumption, hence both can be assumed as deterministic. This model also assumes that production quantity is smaller than consumption as reflected by real condition in Indonesia.
Table 1 List of market assumptions in a free market.
Periods p1 (t1,t2,t3) p2 (t4,t5,t6) p3 (t7,t8,t9) p4 (t10,t11,t12)
1.Season harvest harvest planting planting
2.Production normal booming none none
3.Consumption stable stable stable stable
4.Availability sufficient surplus sufficient shortage
5.Price control ---price support--- ---price stabilization---
3.2
Objective Function
The proposed model has four stakeholders, each has different criterion. The criterion of producer, BLUPP, and wholesaler is total benefit while the consumer criterion total cost. Producer expects maximum benefit from its activities. The total benefit of producer ( P
TB ) is calculated from total revenue obtained from selling staple food during harvest period, deduced by total production cost. Thus, this can be expressed as:
6 1
BLUPP objective is to maximize its benefit ( B
TB ) in (2). The first two terms of
12 6 6
Eq. (3) states the wholesaler objective in its staple food business activities. The wholesaler total benefit ( W
TB ) is calculated from total revenue for selling staple
food to consumer as expressed in the first term of equation, subtracted by total cost for buying staple food from producer as stated in the second term of minimize total cost for consuming staple food for whole periods. This objective is expressed in (4). The first term of the objective depicts the consumer total (importance). The objective function is finally expressed as follows:
Max Z TBP TBW TCC TBB (5)
3.3
Constraints Set
Eqs. (6) and (7) are used to determine producer selling price and consumer buying price under free market. From (6), it can be inferred that price will drop when staple food availability in market is high. Hence (8) is introduced as intervention price in order to protect producer from price plunge. Conversely, consumer will face price rise when consumption is higher than staple food availability, and (9) is utilized to ensure that consumer will not suffer heavily by price hike. These two conditions are controlled by using price indicators as expressed in (10) and (11) respectively.
1 0 ln , 1,..., 6 inventory of staple food is used for every period owned by wholesaler in (14), whereas the accumulative wholesaler ownership of the staple food at certain period in (15) is used to determine the consumer intervention buying price.
1 , 1,...,6
Equation (16) states that the amount of staple food availability, i.e. staple food produced by producer, is equal to the amount of staple food purchased by BLUPP and wholesaler. BLUPP then will determine the amount of staple food directly sold to consumer and guaranteed to the S-WRS. These expressions are reflected in (17) and (18) respectively. To ensure the staple food availability in market during the harvest season, equation (19) is enforced stating that BLUPP must sell the amount of staple food directly to customer to ensure the availability in market, along with the amount of staple food imported, and the amount of staple food sold by wholesaler.
1 , 1,...,6
necessary amount staple food. Wholesaler also couldn’t purchase additional staple food for its merchandise, hence the amount of staple sold by wholesaler during this period only from the total amount of staple food purchased in price support period minus the amount of staple food that have already sold to customer during period 1 up to 6. These conditions are expressed in (20). Equation (21) is used to ensure that total amount of staple food sold to consumer during period 7 through period 12 by BLUPP equals to total amount of staple food guaranteed in the S-WRS during period 1 up to 6. The same mechanism is applied in (21) to ensure that total amount of staple food sold by wholesaler to market must equal to total amount purchased from producer in
In this section, the solution method and the numerical examples are presented, and analyze them to illustrate the capabilities of proposed model.
4.1
The Solution Method
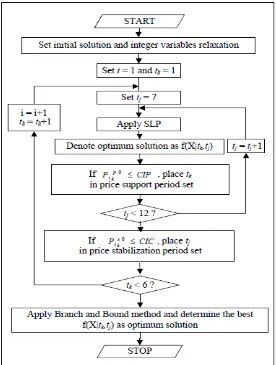
Figure 2 Solution procedure for solving MINLP using sequential linier programming and branch-and-bound methods.
Hereafter, the price support period is refered as period 1 up to 6 and period 7 up to 12 as the price stabilization period. Let tkand tjdenote the elements of price
algorithm assigns the corresponding values in intervention period set, and the intervention price in (8) and (9) are applied. The last step of iteration is to use branch-and-bound method for binary variables. This process is repeated until all values in price support and stabilization sets are enumerated.
In order to verify the solution, we investigate the convexity of the objective functions. All objectives function in (1)-(4) can be classified as linear and non-linear. Linear function is convex or concave in nature, so no further investigation needed. For non-linear function in objective functions, readers can see that all non-linear functions are in Z f X,Y terms, which is multiplication of two decision variables. It can be found in most optimization literatures that such function is quasi concave forX,Y 0. Putting it up all together, we conclude that all objective functions are concave, hence the solution is optimum.
4.2
Numerical Examples and Analysis
In this section, numerical examples are used to test the proposed model. MINLP formulation is solved using Sequential Linear Programming (SLP) and branch-and-bound methods by Lingo 9 solver. Table 2 shows the parameters, price functions, and S-WRS lending interest rate that are used in numerical examples. BLUPP receive loan from Bank and Financial Institution (BFI) and must pay the loan along with its rate in which called SRG rate. All unit cost and price measurements are in Indonesian domestic rupiahs (IDR). Table 3 shows the supply and demand of the staple food for one planning period, i.e. 12 periods. Supply and demand unit are in thousands tons. Supply and demand of staple food is based on staple food production and consumption in 2010 [26].
Table 2 Parameters, price functions parameters, and S-WRS lending interest rate.
cp ch cd Pt0p0 ci pi CIP CIC
7,000 200 400 8,500 300 5,000 7,800 9,600
c d in iwr cwr cr
3 9 0.0117 0.0042 30 0.8
profit is the main objective, then producer will suffer because producer’s price couldn’t compete with import.
Table 3 Staple food supply and demand data.
Period 1 2 3 4 5 6 7 8 9 10 11 12
s t
q (x103 tons) 240 280 480 630 470
d t
q (x103 tons) 200 230 230 260 280 280 260 230 240 240 240 210
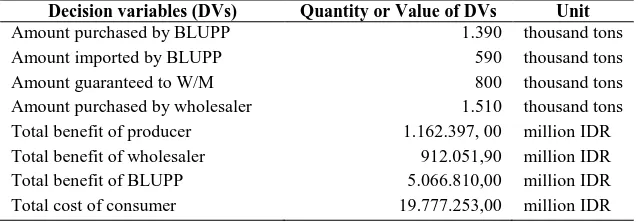
Total supply of staple food for 1 year period is 2,850 tons. Wholesaler purchased 1,510 tons, while BLUPP purchased the rest of the staple food supply 1,390 tons. BLUPP sold the staple food directly to consumer 540 tons, and guaranteed the rest of it in the S-WRS. In price stabilization period, BLUPP redeemed the staple food in order to fulfill consumer demand in that period. Hence, total cost of consumer is decrease up to 30% compared with previous system as proposed by Sutopo, et al. [6]. It is clear that BLUPP gains more benefit than wholesaler because selling imported good, receive revenue from selling domestic good, and benefit from S-WRS schema.
Table 4 Decision variables and its performance criteria for each stakeholder.
Decision variables (DVs) Quantity or Value of DVs Unit
Amount purchased by BLUPP 1.390 thousand tons
Amount imported by BLUPP 590 thousand tons
Amount guaranteed to W/M 800 thousand tons
Amount purchased by wholesaler 1.510 thousand tons
Total benefit of producer 1.162.397, 00 million IDR
Total benefit of wholesaler 912.051,90 million IDR
Total benefit of BLUPP 5.066.810,00 million IDR
Total cost of consumer 19.777.253,00 million IDR
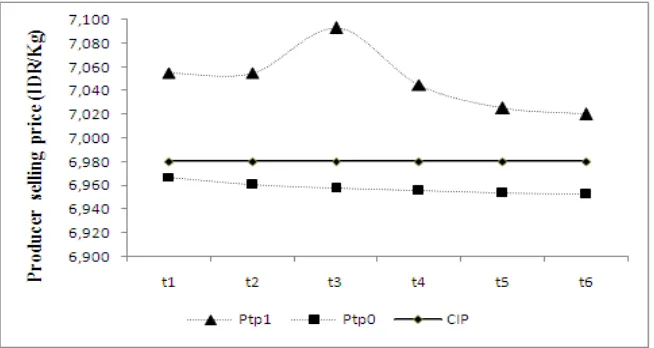
Hereafter the staple food selling price is refered as the price that faced by the producer to sell staple food to BLUPP and wholesaler, and the staple food buying price as the price transacted by consumer to buy staple food from BLUPP and wholesaler. The non-intervention selling price and non-intervention buying price are defined as the price affected by supply and demand theory as in (6) and (7), and the intervention price as the price intervened by BLUPP as part of indirect intervention mechanism to control price stability as in (8) and (9).
alert system to check whether the staple food selling price lies below CIP and must be intervened or the selling price lies above CIP and no intervention is required. When the non-intervention selling price lies beyond CIP due to excessive supply, BLUPP buy staple food so that it will decrease as the selling price reach the steady state and lies above CIP.
Figure 3 describes the indirect intervention mechanism in the price support program period. Note that non-intervention selling price lies below CIP. Hence, BLUPP must determine the quantity of staple food bought from producer such that the selling price increases and reaches the steady state above CIP. In period 1 up to 6 when supply excess occurred, producer will suffer potential benefit loss due to price plunge which causes the selling price lies below CIP. In order to protect producer from this potential loss, BLUPP purchases the staple food by using intervention price which is greater than CIP as in (8). As the result, the selling price reaches equilibrium state and lies above CIP as the staple food supply decreases. Moreover, this brings advantage to producer because it receives revenue by using intervention price which is greater than by using non-intervention price.
Figure 3 The impact of BLUPP accessing the S-WRS to support producer selling price during in the harvest season.
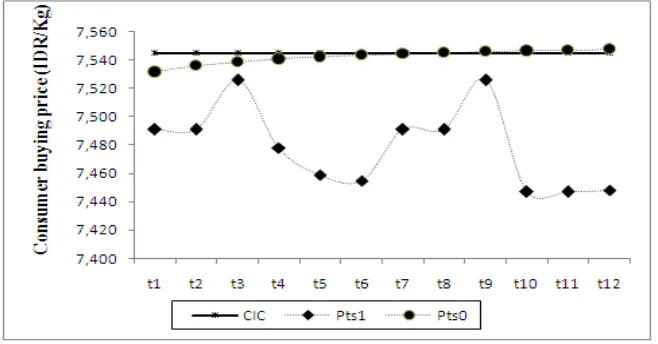
Moreover, this brings advantages for consumer because BLUPP’s indirect intervention in staple food market will make the buying price decrease as the staple food supply increase. As a result, consumer spends less money to buy the staple food using the intervention price which is smaller than CIC.
Indirect intervention mechanism in buying price is described in Fig. 4. For period 1 until 7, non-intervention buying prices lie beyond CIC. Thus, no intervention is required and customer buys staple food by using non-intervention buying price in (7). However, indirect non-intervention is required for period 8 until period 12. The staple food shortage in these periods causes price soaring, hence BLUPP intervenes the market by sold its staple food stored in W/S so that the buying price decreases as the supply increases. Hence, consumer uses the buying price as in (9) in these periods.
Figure 4 The impact of BLUPP accessing the S-WRS to stabilize consumer buying price during the harvest and planting season.
All above numerical results describe the indirect intervention mechanism as part of the BLUPP responsibilities to ensure staple food availability and price stabilization. Hence, the following propositions are developed based on mathematical formulation and numerical results:
Proposition 1 (Price stabilization formulation). The proposed model can be
Proof. The proof is trivial. First, a formal proof for producer price support
P respectively. Since (1) is concave, then is always greater than . If intervention is not conducted, producer will face potential loss in the amount of - . However by indirect intervention (4) is monotonous decreasingly, is always smaller than . If intervention is not conducted, consumer will expedite additional consumption cost in the amount of - . BLUPP’s indirect intervention will make consumer to reduce consumption cost in the amount of - .
Proposition 2 (Staple food availability formulation). The proposed model
can be applied to secure staple food availability throughout horizon planning by implementing buffer stock model which considers the expectations of the stakeholders in staple food industry.
Proof. During the harvesting period (season), staple food availability is greater than consumption. Producer sells staple food to BLUPP and wholesaler, and subsequently BLUPP and wholesaler sell it to consumer. Since its availability is greater than its demand, there will be remaining staple food owned by BLUPP or/and wholesaler. Equation (16)-(18) reflects this condition. However during planting period (season) when producer cannot provide the staple food supply, the remaining staple food owned by BLUPP and wholesaler isn’t sufficient to cover the consumption. BLUPP imposes import to overcome this condition. The amount of import must exceed the shortage. This condition is reflected in (20)-(23). Hence, the proposed model can determine the quantity of the staple food sold by producer, bought by wholesaler and BLUPP, and imported by BLUPP which satisfies the quantity of staple food consumed by consumer for entire planning period.
Proposition 3 (BLUPP responsibility). The main responsibility of BLUPP is
to ensure staple food availability while expecting the benefit from its market activities.
availability, BLUPP expects to gain profit. However, BLUPP can also suffer profit loss. Let’s assume BLUPP only sells the staple food from import, i.e.
BLUPP doesn’t buy the staple food from producer. Thus (2) become:
1
B s OI OI
t t t i i
TB P Q Q p c (25)
Notice that (25) can have negative, zero, or positive value depends on staple food selling price, its price in the global market, and import cost per unit. If the staple food selling price is greater than sum of staple food price and import cost per unit, (25) will be positive. Conversely, (25) will be negative if the previous condition contradicts.
To illustrate the proposition 3, equation (17) is replaced with the following expression:
6 6
1 1
PB s
t t
t Q t q (26)
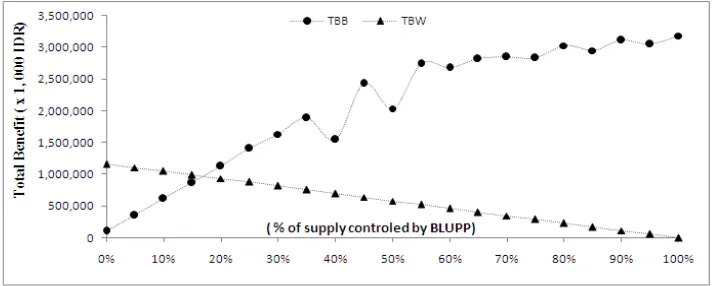
with ranges from 0, which means BLUPP doesn’t get any staple food supply from producer, up to 100% which means BLUPP totally control of the staple food supply.
Figure 5 The relationship between staple food supply control and total benefit.
can be explained by the fact that the objective function of BLUPP is not pure linear, while the objective of the wholesaler is linear.
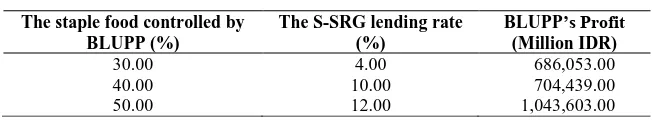
Table 5 The BLUPP benefit.
The staple food controlled by BLUPP (%)
The S-SRG lending rate (%)
BLUPP’s Profit (Million IDR)
30.00 4.00 686,053.00
40.00 10.00 704,439.00
50.00 12.00 1,043,603.00
Sensitivity analysis is conducted to depict effect of staple food controlled by BLUPP and S-SRG lending rate to BLUPP benefit (Table 5). This means that BLUPP will get large benefit if the interest rate is small. Conversely, the BLUPP will gain smaller benefit if interest charge is high. This model can provide same recommendations related to the staple food controlled by BLUPP, the rate of S-SRG, and the estimation of BLUPP’s profit.
5
Conclusions
A buffer stock model has been developed in accordance with warehouse receipt and collateral management system for solving the scarcity and price fluctuation of seasonal staple food. The S-WRS facilities and direct access to market are privileges given to BLUPP in order to perform its responsibility to ensure price stabilization and availability of seasonal staple food under free trade considerations. MINLP approach was used to determine the decision variables of buffer stock scheme as an indirect market intervention policy. The numerical analysis showed that the model can be used to determine the stock level and the amount of import, and to solve buffer stock problem considering the interest of stakeholders.
Further research is needed to extend the model which considers the dynamic of global market price that can influence the domestic price. Other features can be added to make the model more realistic in order to represent the real system closely such as stochastic factors in supply, demand, and prices. Goal programming, stochastic programming, dynamic programming, and robust optimization, to name a few, can be considered as the alternative approaches to describe the model extensively. The feasibility study of BLUPP stucture is required to support government to implement the proposed model.
Acknowledgement
Nomenclature
The following notations are used to develop the proposed model:
W t
BIQ = the wholesaler’s inventory in the beginning of period-t
c = a natural log. parameter of price function
d
c = distribution cost of wholesaler per unit
h
c = credit ratio by collateral value
wr
c = administration cost to get the WR
CIC = crisis indicator for consumer of the selling price
CIP = crisis indicator for producer of the purchasing price
n
i = normal lending interest rate
wr
i = S-WRS lending interest rate
C t
IQ = cumulative staple food sold by wholesaler
i
p = staple food price in the global market
0
q = market’s availability in period t
C
Q = amount of BLUPP and consumer transaction
OI t
Q = import quota
PB t
Q = amount of producer and BLUPP transaction
PW t
Q = amount of producer and wholesaler transaction
WC t
Q = amount of wholesaler and consumer transaction
WR t
Q = the amount of staple food guaranteed in the S-WRS
WRR t
t Volatility Target, IJLT, 3(2), pp. 149-160, 2009.
[3] Isma’il, N.M., Improvement of Industry Competitiveness National Sugar, Institute for Science and Technology Studies Journal, 2(1), pp. 3-14,
Price Stabilization using Buffer Stock in Duopoly-Like Market with
Consider Exp. of Stakeholders, ASOR Bulletin, 29(4), pp. 60-72, 2010.
[6] Sutopo, W., Nur Bahagia, S., Cakravastia, A. & Arisamadhi, TMA., A Buffer Stocks Model for Stabilizing Price of Staple Food, Proc. of ICMEEM, pp. 2129-2134, 2010.
[7] van der Mensbrugghe, D., Beghin, J.C. & Mitchell, D., Modeling Tariff Rate Quotas in a Global Context: The Case of Sugar Markets in OECD
Countries, www.card.iastate.edu, (Accessed on 1 Sept. 2010).
[8] Chand, R., Government Intervention in Food grain Markets in the New Context, First Edition, Chandu Press, pp. 77-98, 2003.
[9] Jamhari, Rice Market Liberalization and Price Stability in Indonesia, Tohoku Journal of Agricultural Research, 54(3-4), pp. 23-36, 2004. [10] Labys, W.C., Survey of Latest Development-Commodity Price
Stabilization Models: A Review & Appraisal, Journal of Policy Modeling, 2(1), pp. 121-126, 1980.
[11] Nguyen, D.T., Partial Price Stabilization and Export Earning Instability, Oxford Economic Papers, 32(2), pp. 340-352, 1980.
[13] Newbery M.G.D. & Stiglitz, E.J., Optimal Commodity Stock-Piling
Rules, Oxford Economic Papers, 34(3), pp. 403-427, 1982.
[14] Athanasioua, G., Karafyllis, I. & Kotsiosa, S., Price Stabilization Using Buffer Stocks, Journal of Economic Dynamics & Control, 32(1), pp. 1212-1235, 2008.
[15] David, C.C., Food Policy-Its Role in Price Stability and Food Security, Journal of Philippine Dev., 43(1), pp. 171-189, 1997.
[16] Khan, N.P., Government Intervention in Pakistan's Wheat and Cotton Sectors: Concepts, Policies and Implications, Asian Journal of Plant Sciences, 1(4), pp. 492-494, 2002.
[17] Dorosh, P.A., Dradri, S. & Haggblade, S., Regional Trade, Government Policy and Food Security: Recent Evidence from Zambia, Food Policy,
34(1), pp. 350–366, 2009.
[18] Jha, S. & Srinivasan, P.V., Food Inventory Policies under Liberalized Trade, International Journal Production Economics, 71(1), pp. 21-2, 2001.
[19] Adao, B., Correia, I. & Teles, P., Ensuring Price Stability with An Interest Rate Rule, Economic Bulletin, pp. 57-64, 2007.
[20] Ayenagbo, K., Kimatu, J.N., Jing, Z., Nountenin, S. & Rongcheng, W.,
Analysis of The Importance of GATT and Its Contribution to International Trade, J. of Economics and Int. Finance, 3(1), pp. 13-28, 2011.
[21] Nur Bahagia, S., Sistem Persediaan, ITB Press, pp. 15-20, 2006.
[22] Höllinger, F., Rutten, L. & Kiriakov, K., The Use of Warehouse Receipt
Finance in Agriculture in Transition Countries, FAO, 2009,
http://www.fao.org/tc/tci, (Accessed on 01 Jan. 2011).
[23] Law Number 9 of 2006 the Republic of Indonesia Concerning on System
on Warehouse Receipt, http://www.resigudang.com, (Accessed on 03
Aug. 2010).
[24] Regulation of the Finance Minister Number 171/Pmk.05/2009 on Scheme
for Subsidy on Warehouse Receipt, http:// www.resigudang.com,
(Accessed on 05 Aug. 2010).
[25] Rao, S.S., Engineering Optimization: Theory and Practice, 4th Edition, John Wiley & Sons, Inc, 2009, pp. 287-393.
[26] Sutopo, W., Buffer Stocks Models to Ensure Price Stabilization and
Availability of Seasonal Staple Food, PhD Dissertation, Dept. of