Connecting
to
Compete
2016
Trade Logistics in the
Global Economy
LPI score, 2016 (1 is the lowest score; 5 is the highest score)
Connecting to Compete 2016
Trade Logistics in the Global Economy
The Logistics Performance Index and Its Indicators
Jean-François Arvis
The World Bank
Daniel Saslavsky
The World Bank
Lauri Ojala
Turku School of Economics
Ben Shepherd
Developing Trade Consultants
Christina Busch
The World Bank
Anasuya Raj
The World Bank
Tapio Naula
© 2016 he International Bank for Reconstruction and Development/he World Bank 1818 H Street NW
Washington, DC 20433 Telephone: 202-473-1000 Internet: www.worldbank.org E-mail: [email protected]
All rights reserved
he indings, interpretations, and conclusions expressed herein are those of the authors and do not necessarily relect the views of the Executive Directors of the International Bank for Reconstruc-tion and Development/he World Bank or the governments they represent.
he World Bank does not guarantee the accuracy of the data included in this work. he boundar-ies, colors, denominations, and other information shown on any map in this work do not imply any judgment on the part of he World Bank concerning the legal status of any territory or the endorse-ment or acceptance of such boundaries.
Rights and Permissions
he material in this publication is copyrighted. Copying and/or transmitting portions or all of this work without permission may be a violation of applicable law. he International Bank for Reconstruction and Development/he World Bank encourages dissemination of its work and will normally grant permission to reproduce portions of the work promptly.
For permission to photocopy or reprint any part of this work, please send a request with complete information to the Copyright Clearance Center Inc., 222 Rosewood Drive, Danvers, MA 01923, USA; telephone: 978-750-8400; fax: 978-750-4470; Internet: www.copyright.com.
All other queries on rights and licenses, including subsidiary rights, should be addressed to the Oice of the Publisher, he World Bank, 1818 H Street NW, Washington, DC 20433, USA; fax: 202-522-2422; e-mail: [email protected].
If you have any questions or comments about this report, please contact:
Global Trade Unit he World Bank
1818 H Street NW, Mailstop MC3-300, Washington, DC 20433 USA Telephone: 202-473-8922
E-mail: [email protected] Web site: http://lpi.worldbank.org
Foreword
Anabel González, Senior Director, Trade & Competitiveness
Global Practice, The World Bank Group
I am pleased to introduce the ith edition of
Connecting to Compete: Trade Logistics in the
Global Economy. he Connecting to Compete
series features the Logistics Performance Index (LPI), a comprehensive measure of the eiciency of international supply chains. Its irst version was published in 2007, and it has since been updated every two years.
Logistics organizes the movement of goods through a network of activities and services op-erating at global, regional, and local scale. Logis-tics encompasses more than freight transporta-tion. Traders delegate increasingly sophisticated tasks to networks of specialized service provid-ers. Eicient logistics connects people and irms to markets and opportunities and helps achieve higher levels of productivity and welfare.
Crucially, logistics is not only a private en-deavor, but also a public policy concern. he performance and reliability of supply chains de-pend on an array of interventions, ranging from trade facilitation at the border to infrastructure and regulations and to urban planning and skills. Empirical evidence conirms that logis-tics- and connectivity-related interventions have the highest potential to reduce the cost of trade and to boost integration in global value chains.
Today, policy makers know that logistics mat-ters and that they can improve the eiciency of the supply chains connecting their countries in-ternally and exin-ternally. As a former government oicial, I can conirm that the previous editions of the LPI, indeed, contributed to this awareness by proposing a synthetic understanding of the in-tricate reality of supply chain networks.
After almost 10 years, the LPI remains highly relevant. The Connecting to Compete
report has initiated and facilitated numerous policy reforms around the globe. But the LPI should not be overinterpreted beyond its role
as a global benchmark. It is not a substitute for in-depth country diagnoses. For this, the World Bank and others have proposed thorough and adequate methodologies such as the Trade and Transport Facilitation Assessment. he increas-ing availability of data, includincreas-ing big data, opens new opportunities to disentangle supply chains in speciic country contexts and at detailed in-dustry or geographical levels.
Building on a rich set of information, the re-port shows that improving logistics performance is a complex, unfinished, cross-cutting, and evolving agenda. he priorities depend on coun-try performance. Countries with the worst per-formance are dealing with comparatively basic trade and transport facilitation reforms, which the World Bank and partner agencies support in many places. Middle- and high-income econo-mies are dealing with new concerns, which the
Connecting to Compete report echoes:
sustain-able logistics, distribution and urban logistics, skill development and training, and domestic and international connectivity bottlenecks.
Any effective action in logistics policies should be the result of coordinated eforts be-tween the private and public sectors. In this re-gard, the support of the International Federation of Freight Forwarders Associations (FIATA) to undertake this new edition of the Connecting to
Compete report has been invaluable.
I sincerely hope the LPI and this biennial re-port will continue to provide useful knowledge to policy makers, private sector executives, and others interested in how to make supply chains work more eiciently for the beneit of all.
Anabel González Senior Director
I have been asked to make comments on the new publication of the Logistics Performance Index in my role as President of FIATA. his is a much needed tool for decision makers to consider when decisions on logistics capac-ity and qualcapac-ity need to be made. he LPI is unique as a tool of decision making since it expresses the perception of operators on the ground; this is oten as important as hard sta-tistical data.
FIATA, in representing freight forward-ers and logistics service providforward-ers globally, is pleased to have been a part of the development of this 2016 edition, and we are grateful to the LPI team for their continued trust, which is now spanning a number of years.
The LPI is instrumental in the policy choices of governments, nongovernmental or-ganizations, and private enterprises worldwide, and the visibility of the freight forwarding and logistics sector as an intrinsic arm of global trade and commerce is crucial. here is no trade without logistics, and poor logistics oten means
poor trade. We must remember that moving goods across borders is not the be-all and end-all of logistics performance, which requires the integration of many elements throughout the entire supply chain.
he challenge is to ensure that the LPI and all the insight into markets it contains reaches decision makers not only in the public sector but also in the private sector to avoid that the public sector caters for misconceived private de-mand; in this regard the role of large and global organizations such as FIATA is crucial.
We trust the 2016 Logistics Performance Index will be well received by policy makers and private sector decision makers alike. FIATA is proud to congratulate those members who re-plied by providing necessary information and is grateful to the World Bank for the opportunity to contribute to this priceless initiative.
Huxiang Zhao
President, International Federation of Freight Forwarders Associations (FIATA)
Foreword
This report has been prepared by the World Bank’s Global Trade Team under the guid-ance of Anabel González (Senior Director) and José Guilherme Reis (Practice Manager). The project leaders were Jean- François Arvis (jarvis1@ worldbank.org) and Daniel Saslavsky ([email protected]). Authors included Professor Lauri Ojala (Turku School of Eco-nomics, University of Turku; lauri.ojala@ utu .i), Ben Shepherd (Principal, Developing Trade Consultants; [email protected]), Ana-suya Raj ([email protected]), Christina Busch (cbusch@ worldbank.org), and Tapio Naula (tapio.naula@ tradelogistics.i). Carolina Monsalve and Kamal Siblini were peer reviewers for this edition’s project concept note.
he LPI survey would not have been pos-sible without the support and participation of the International Federation of Freight Forwarders Associations (http://iata.com/), namely, Marco Sorgetti, FIATA’s Director General and CEO. National freight forward-ing associations and a large group of small, medium, and large logistics companies world-wide were also instrumental in disseminating the survey. he survey was designed with Fin-land’s Turku School of Economics, University of Turku (http://www.utu.i/en/), which has
worked with the World Bank since 2000 to de-velop the concept.
The authors are also grateful to external colleagues for their support and contributions in reaching out to forwarding associations and providing inputs for the report, including Ruth Banomyong (hammasat University, hailand), Nicolette Van der Jagt (CLECAT, European Association for Forwarding, Transport, Logis-tics, and Customs Services), and Cesar Lavalle (ILOS Brazil). Jan Havenga (Department of Logistics, Stellenbosch University, South Af-rica) provided inputs on the Logistics Barom-eter South Africa. Daniel Cramer of BlueTun-dra.com designed, developed, and maintained the LPI survey and results websites under the guidance of the core team. Scott Johnson of the World Bank Information Solutions Group helped the team distribute the survey. he re-port has been edited, designed, and laid out by Communications Development Incorporated.
Foreword by Anabel González iii Foreword by Huxiang Zhao iv Acknowledgments v
LPI ranking and scores, 2016 x
Summary and key findings 1
1. The 2016 Logistics Performance Index 5
Introduction 5
Features of the 2016 survey 6
Key indings of the 2016 international LPI 7
Logistics performance is rising, and performance is heterogeneous 9 Trends over the past four LPI editions 13
2. Unbundling logistics performance 17
Infrastructure 17 Services 18
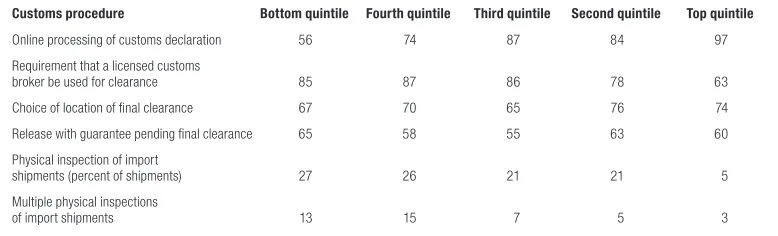
Border procedures and time 18
3. The way forward: New challenges in trade facilitation and logistics 27
Complexity of reforms: Moving away from the border? 27
Trade and transport facilitation remains a priority for poorly performing countries 27 Comprehensive logistics strategies are being developed in middle- and high-income countries 29 A data-driven reform agenda 30
Raising competencies under competitive pressure 30
More networks: he logistics industry response to the decline in impacts on trade growth 31 Logistics skills, competencies, and training 33
Managing the footprint and sustainability of logistics 35
Notes 37
Appendix 1. International LPI results 38
Appendix 2. Domestic LPI results, by region and income group 42 Appendix 3. Domestic LPI results, time and cost data 45
Appendix 4. LPI results across four editions (2010, 2012, 2014, and 2016) 51 Appendix 5. The LPI methodology 55
Appendix 6. Respondent demographics 59
References 61
Boxes
1.1 Using the LPI 6
1.2 How precise are LPI scores and ranks? 7
1.3 LPI results: Consistent within but not necessarily between regions? 11 1.4 Connectivity, logistics networks, and logistics performance 16 2.1 Timeliness and global value chains 25
3.1 Trade facilitation reforms: East Africa’s Northern Corridor 28 3.2 Major new international initiatives address logistics issues 29 3.3 France Logistique 2025 30
3.4 South Africa: Letting the (large) logistics data speak 31
Figures
Figure 1 LPI score as percentage of highest LPI score, by LPI quintile averages, 2007, 2010, 2012, 2014, and 2016 1 1.1 Cumulative distribution of LPI scores 10
1.2 LPI component scores, by LPI quintile 10
1.3 Percentage change in LPI scores, customs, infrastructure, and quality of logistics services, 2014–16 12 1.4 Average LPI scores and minimum-maximum ranges, by income group 13
1.5 LPI overperformers and underperformers 14
1.6 LPI scores as a percentage of the best performer, LPI 2010–16 14 1.7 Weighted aggregate international LPI scores, 2010–16 15
2.1 Respondents rating trade and transport infrastructure quality improved or much improved since 2012, by LPI quintile 18 2.2 Median import lead time and average clearance time, by LPI quintile 19
2.3 Median export lead time, by LPI quintile 20 2.4 Median export lead time, by income group 21
2.5 Red tape afecting import and export transactions, by LPI quintile 22
2.6 Respondents reporting shipments oten or nearly always cleared and delivered as scheduled, by LPI quintile 14 2.7 Respondents reporting shipments oten or nearly always cleared and delivered as scheduled, by region 25 2.8 Shipments not meeting company quality criteria, by LPI quintile 26
3.1 Respondents reporting low or very low availability of qualiied personnel, by employee group and LPI quintile 34 3.2 Respondents reporting low or very low availability of qualiied personnel, by employee group and region 34 3.3 he demand for green logistics 35
A6.1 2016 LPI survey respondents, by World Bank income group 59 A6.2 2016 LPI survey respondents, by World Bank region 59
Tables
1 Top 10 average and bottom 10 average LPI scores, 2007–16 2 1.1 Top 10 LPI economies, 2016 8
1.2 Bottom 10 LPI 2016 economies 8
1.3 Top-performing lower-middle-income economies 8 1.4 Top-performing upper-middle-income economies 9 1.5 Top-performing low-income economies 9
1.6 Deviation of each component from the overall LPI score, by quintile 12
1.7 Respondents reporting an improved or much improved logistics environment since 2012, by LPI quintile 13 1.8 Economies with statistically signiicant changes in LPI scores 15
2.6 hree border agencies: respondents rating quality and competence high or very high, by LPI quintile 21 2.7 Respondents reporting that shipments are oten or nearly always delayed, by delay category and LPI quintile 23 A5.1 Methodology for selecting country groups for survey respondents 56
Economy
Germany 1 4.23 100.0 Luxembourg 2 4.22 99.8 Sweden 3 4.20 99.3 Netherlands 4 4.19 98.8 Singapore 5 4.14 97.4 Belgium 6 4.11 96.4 Austria 7 4.10 96.0 United Kingdom 8 4.07 95.2 Hong Kong SAR, China 9 4.07 95.1 United States 10 3.99 92.8 Switzerland 11 3.99 92.6 Japan 12 3.97 92.1 United Arab Emirates 13 3.94 91.2 Canada 14 3.93 90.8 Finland 15 3.92 90.5 France 16 3.90 89.9 Denmark 17 3.82 87.3 Ireland 18 3.79 86.6 Australia 19 3.79 86.6 South Africa 20 3.78 86.0 Italy 21 3.76 85.4 Norway 22 3.73 84.7 Spain 23 3.73 84.5 Korea, Rep. 24 3.72 84.2 Taiwan, China 25 3.70 83.6 Czech Republic 26 3.67 82.9 China 27 3.66 82.5 Israel 28 3.66 82.5 Lithuania 29 3.63 81.6 Qatar 30 3.60 80.6 Hungary 31 3.43 75.3 Malaysia 32 3.43 75.2 Poland 33 3.43 75.2 Turkey 34 3.42 75.1 India 35 3.42 75.0 Portugal 36 3.41 74.7 New Zealand 37 3.39 74.0 Estonia 38 3.36 73.3 Iceland 39 3.35 72.7 Panama 40 3.34 72.5 Slovak Republic 41 3.34 72.4 Kenya 42 3.33 72.3 Latvia 43 3.33 72.1 Bahrain 44 3.31 71.7 Thailand 45 3.26 69.9 Chile 46 3.25 69.7 Greece 47 3.24 69.4 Oman 48 3.23 69.3 Egypt, Arab Rep. 49 3.18 67.7 Slovenia 50 3.18 67.7 Croatia 51 3.16 67.0 Saudi Arabia 52 3.16 66.8 Kuwait 53 3.15 66.7
Economy
Brazil 55 3.09 64.7 Malta 56 3.07 64.1 Botswana 57 3.05 63.4 Uganda 58 3.04 63.3 Cyprus 59 3.00 62.0 Romania 60 2.99 61.8 Tanzania 61 2.99 61.7 Rwanda 62 2.99 61.6 Indonesia 63 2.98 61.5 Vietnam 64 2.98 61.3 Uruguay 65 2.97 61.2 Argentina 66 2.96 60.8 Jordan 67 2.96 60.7 Pakistan 68 2.92 59.6 Peru 69 2.89 58.7 Brunei Darussalam 70 2.87 58.0 Philippines 71 2.86 57.5 Bulgaria 72 2.81 56.0 Cambodia 73 2.80 55.8 Ecuador 74 2.78 55.1 Algeria 75 2.77 54.9 Serbia 76 2.76 54.6 Kazakhstan 77 2.75 54.3 Bahamas, The 78 2.75 54.2 Namibia 79 2.74 54.1 Ukraine 80 2.74 53.8 Burkina Faso 81 2.73 53.7 Lebanon 82 2.72 53.2 El Salvador 83 2.71 52.9 Mozambique 84 2.68 52.2 Guyana 85 2.67 51.7 Morocco 86 2.67 51.6 Bangladesh 87 2.66 51.6 Ghana 88 2.66 51.5 Costa Rica 89 2.65 51.1 Nigeria 90 2.63 50.5 Dominican Republic 91 2.63 50.4 Togo 92 2.62 50.1 Moldova 93 2.61 50.0 Colombia 94 2.61 50.0 Côte d’Ivoire 95 2.60 49.7 Iran, Islamic Rep. 96 2.60 49.6 Bosnia and Herzegovina 97 2.60 49.5 Comoros 98 2.58 49.0 Russian Federation 99 2.57 48.7 Niger 100 2.56 48.4 Paraguay 101 2.56 48.4 Nicaragua 102 2.53 47.5 Sudan 103 2.53 47.4 Maldives 104 2.51 46.9 Papua New Guinea 105 2.51 46.8 Macedonia, FYR 106 2.51 46.8 Burundi 107 2.51 46.8
Economy
Mali 109 2.50 46.6 Tunisia 110 2.50 46.4 Guatemala 111 2.48 45.8 Honduras 112 2.46 45.3 Myanmar 113 2.46 45.2 Zambia 114 2.43 44.3 Benin 115 2.43 44.3 Solomon Islands 116 2.42 43.9 Albania 117 2.41 43.8 Uzbekistan 118 2.40 43.5 Jamaica 119 2.40 43.4 Belarus 120 2.40 43.4 Trinidad and Tobago 121 2.40 43.3 Venezuela, RB 122 2.39 43.1 Montenegro 123 2.38 42.8 Nepal 124 2.38 42.7 Congo, Rep. 125 2.38 42.7 Ethiopia 126 2.38 42.7 Congo, Dem. Rep. 127 2.38 42.6 Guinea-Bissau 128 2.37 42.5 Guinea 129 2.36 42.1 Georgia 130 2.35 41.9 Cuba 131 2.35 41.7 Senegal 132 2.33 41.2 São Tomé and Príncipe 133 2.33 41.1 Djibouti 134 2.32 41.0 Bhutan 135 2.32 41.0 Fiji 136 2.32 40.8 Libya 137 2.26 39.2 Bolivia 138 2.25 38.8 Angola 139 2.24 38.5 Turkmenistan 140 2.21 37.6 Armenia 141 2.21 37.4 Liberia 142 2.20 37.3 Gabon 143 2.19 36.9 Eritrea 144 2.17 36.3 Chad 145 2.16 36.1 Kyrgyz Republic 146 2.16 35.8 Madagascar 147 2.15 35.8 Cameroon 148 2.15 35.7 Iraq 149 2.15 35.6 Afghanistan 150 2.14 35.4 Zimbabwe 151 2.08 33.6 Lao PDR 152 2.07 33.1 Tajikistan 153 2.06 32.9 Lesotho 154 2.03 31.8 Sierra Leone 155 2.03 31.8 Equatorial Guinea 156 1.88 27.3 Mauritania 157 1.87 26.8 Somalia 158 1.75 23.2 Haiti 159 1.72 22.2 Syrian Arab Republic 160 1.60 18.5
Logistics performance both in international trade and domestically is central to the eco-nomic growth and competitiveness of countries, and the logistics sector is now recognized as one of the core pillars of economic development. Policy makers not only in the best perform-ing countries, but also in emergperform-ing economies, increasingly see the need to implement coher-ent and consistcoher-ent policies to foster seamless and sustainable supply chain operations as an engine of growth.
Eicient logistics connects irms to domes-tic and international markets through reliable supply chain networks. Conversely, countries characterized by low logistics performance face high costs, not merely because of trans-portation costs but also because of unreliable supply chains, a major handicap in integrating and competing in global value chains. Supply chains are complex, but their performance is largely dependent on country characteristics, especially the sot and hard infrastructure and institutions that logistics requires to operate well, such as imports, regulations, procedures, and behaviors.
Now in its ith edition, the Logistics Per-formance Index (LPI) embodies the experience of logistics professionals worldwide and tries to capture the complexity of supply chains in synthetic indicators that are comparable across countries. he LPI has provided valuable infor-mation for policy makers, traders, and other stakeholders, including researchers and aca-demics, on the role of logistics for growth and the policies needed to support logistics in areas such as infrastructure planning, service pro-vision, and crossborder trade and transport facilitation.
Logistics performance converges at the top, but the gap is widening between the worst and best performers
he results of Connecting to Compete 2016 point to Germany as the best performing country, with an LPI score of 4.23, and Syria as the low-est, with a score of 1.60 (equivalent to 19 per-cent of Germany’s score on a scale from 1 to 5). he converging trend between the top and worst performers that appeared in the previous LPI surveys (2007, 2010, 2012, and 2014) seems to have slightly reversed. he average scores in each quintile reveal that the gap between the top 2 quintiles and the countries at the bottom in performance is widening again (igure 1).
The modest convergence since 2007 was explained in the 2014 report by a perceived
Summary and key findings
Percent
Source: Logistics Performance Index 2007, 2010, 2012, 2014, and 2016.
30 40 50 60 70 80 90
Top quintile Second quintile Third
quintile Fourth quintile Bottom quintile
2007 2010 2012 2014 2016
improvement in trade-supporting infrastruc-ture in low- and middle-income countries and, to less extent, in their logistics services and their customs and border management. his explana-tion may still be largely valid in the majority of ranked countries. In 2016, however, the widen-ing of the gap between the top and the bottom was ampliied by the highest average scores ever among the top countries (4.13 in 2016) and the lowest average scores among countries at the bottom since 2007 (1.84 in 2007; 1.91 in 2016) (table 1).
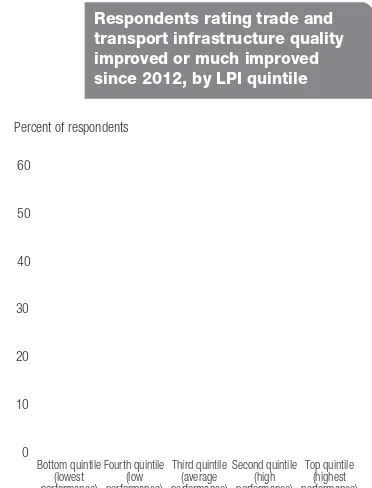
he difering pace of progress is also seen in the ratings on the quality of domestic trade and transport infrastructure. In the domestic section of the LPI questionnaire, respondents were asked to assess the extent of improvements in these areas since 2014. While about 60 per-cent of the respondents in the top 2 quintiles rated the situation in 2016 as improved or much improved, only about a third in the bottom quintile and fewer than half in the third and fourth quintiles shared this view.
Logistics performance captures more than income, as observed since the irst LPI report in 2007. International supply chains are orga-nized across groups of regional trading coun-tries. Provisions for services and trade facilita-tion initiatives are designed and implemented regionally. Reflecting on these mechanisms, the LPI data show that performance is quite consistent within integrated subregions. For instance, Western and Central Africa shows lower performance than Southern Africa or than East Africa, which has engaged in signii-cant improvement in trade corridor eiciency. North African and Middle Eastern developing countries are doing comparatively worse than their income level would indicate, due to lack of integration, political unrest, and security chal-lenges. In South Asia, lack of integration means
that the good logistics performance of India does not improve that of its neighbors. Mean-while, East Asian economies have performed consistently well across LPI editions.
Supply chain reliability and service quality are key objectives across all performance groups
Logistics irms have a strong incentive to pro-vide predictable deliveries in both the developed and the developing world. Supply chain reli-abilitycontinues to be a major concern among traders and logistics providers. In a global envi-ronment, consignees require a high degree of certainty on when and how deliveries will take place. his is much more important than the speed of the delivery. Predictability also carries a premium, which many shippers are willing to pay. In other words, supply chain predictability is a matter not merely of time and cost, but also of shipment quality. In the top LPI quintile, only 13 percent of shipments fail to meet com-pany quality criteria, the same proportion as in 2014. By comparison, nearly three times more shipments in the bottom quintile (over 35 per-cent) fail to meet company quality criteria. his inding again illustrates that, in supply chain eiciency and reliability, the logistics gap is real and persistent.
Infrastructure development continues to accomplish much in assuring basic connectiv-ity and access to gateways for most develop-ing countries. his has also been consistently observed in the LPI since 2007. he perceived quality of certain types of infrastructure also seems to follow a similar pattern across all LPI editions. he quality of information and com-munications technology (ICT) infrastructure is again rated highest across all respondents, and here the gap between lowest and highest
Indicator 2007 2010 2012 2014 2016
Top 10 average 4.06 4.01 4.01 3.99 4.13 Bottom 10 average 1.84 2.06 2.00 2.06 1.91
Source: Logistics Performance Index 2007, 2010, 2012, 2014, and 2016.
performers is narrowing the most. By contrast, satisfaction with rail infrastructure remains low. he widest gap in satisfaction is with ware-housing and transloading infrastructure: while 65 percent of the respondents in the top LPI quintile regarded the quality of these as high or very high, only 13 percent in the bottom quintile had the same view. Ratings on other types of infrastructure vary by region.
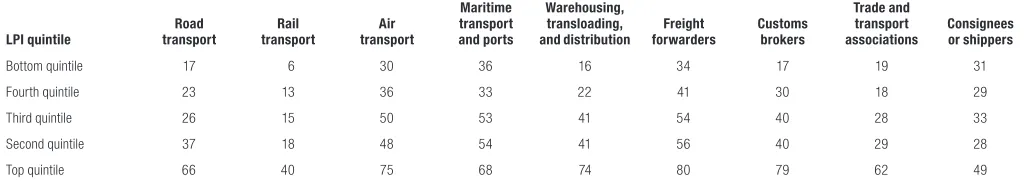
Trade logistics services are provided under diferent environments globally. As in 2014, we see that the quality of services provided by logistics irms is oten perceived as better than the quality of the corresponding infrastructure the irms operate. his may partly be explained by the respondent base, that is, freight forward-ers and logistics irms rating their own services. Nonetheless, the pattern that emerges from re-sponses across LPI editions is rather uniform: the more international operations, such as air and maritime transport and services, tend to receive high scores even if infrastructure bottle-necks exist. Railroads, meanwhile, continue to show low ratings almost everywhere. Low-in-come countries still score poorly on road freight services.
Service quality differs substantially at similar levels of perceived infrastructure qual-ity. his indicates that even high-quality hard infrastructure cannot substitute or replace operational excellence, which is based on the professional skills of service providers, well-functioning soft infrastructure, and smooth business and administrative processes. his is explored in section 3.
Trade and transport facilitation is critical for lower performers
Efficient clearance procedures at the border are critical to eliminating avoidable delays and to improving supply chain predictability. To achieve this, governments need to facilitate trade, while safeguarding the public against harmful activities ranging from health hazards to crime and terrorism. Realizing these two objectives — facilitating trade and safeguard-ing the public interest — is a challenge for policy makers and authorities, especially in countries
with a low performance record, where delays and unexpected costs are more common. As in previous editions, this edition inds that border clearance times tend to be longer in countries with less friendly logistics environments.
he 2016 results (section 2) imply that trade facilitation tools and principles have taken hold in many countries thanks to growing awareness and international initiatives to support trade fa-cilitation reforms in developing countries. Co-ordination among government control agencies continues to require attention, including the need to introduce best practices in automation (for example, single windows) and risk manage-ment in non–customs control agencies, which have been less open to reform. Accordingly, cus-toms agencies have again obtained much higher LPI ratings than the other agencies rated in the domestic part of the LPI, such as sanitary and phytosanitary control agencies and those en-forcing the quality or technical standards of goods.
Yet, the implementation of trade and trans-port reform is lagging in the logistically con-strained countries that are most in need of at-tention from the international community. Moreover, their neighbors also oten face seri-ous governance challenges (for example, con-lict-ridden or postconlict countries and fragile states). Many landlocked developing countries and small island states also fall into this cat-egory because their connectivity with global markets may be severely challenged by their eco-nomic size or geography. Long overdue and still mostly unresolved implementation challenges, such as troubled regional transit regimes, seri-ously hamper these countries. he realization of sensible facilitation policies remain key for fu-ture progress given that many now have a basic connective infrastructure.
the sot trade and transport facilitation reforms with a significant impact were implemented even before hard infrastructure projects were completed. he sot reforms provided a greater, more rapid return on investment relative to hard infrastructure.
Logistics friendlier countries face complexity, new policy concerns, and competitive pressure
he LPI results since 2007 have shown that higher service quality is driving logistics per-formance in emerging and richer economies. Yet, the development of services, as in third- or fourth-party logistics, is a rather complex policy agenda not least because the provision of these more advanced services cannot be created from scratch or developed purely domestically. In logistics-friendly countries, manufacturers and traders already outsource much of their basic transport and logistics operations to third-party providers and focus on their core business, while managing more complex supply chains. The more such advanced services are available at a reasonable price-cost ratio, the more shippers will outsource their logistics. he current envi-ronment for international trade — structurally slower growth patterns relative to before the 2008–09 inancial crisis — puts a lot of pressure on the industry, which is also pushing for qual-ity and innovation.
he 2016 survey conirms that the policy agenda is becoming more complex. he demand for environmentally friendly logistics solutions, or green logistics, is gradually becoming a com-mon feature in most advanced logistics environ-ments (section 3). Two-iths of survey respon-dents acknowledge this is a major concern in the top performance quintile. he 2016 survey introduced a new set of questions on skills and the logistics labor force. he results highlight a shortage of skilled labor, though there are difer-ences across countries and job proiles.
here is thus an expanding need for con-sistent strategies that cut across the numerous policy dimensions, especially in high- and mid-dle-income countries. Policy makers in large emerging or developed economies have to deal
not so much with border issues, such as in low performance countries, but with the internal performance of domestic supply chains (a real-ity not well captured in the main LPI index). Comprehensive strategies increasingly focus not merely on looking at the sources of costs, but on steering a sector with a large footprint in the economy and with links to concerns about the environment, jobs, land use, urban planning, and other issues.
A growing number of countries follow this route, which is rarely easy. he implementation of reforms involving many stakeholders can be slow. Except in low performing countries, short-term, high-impact interventions (the low hanging fruits) are likely to have already been implemented. Countries successful in introduc-ing far-reachintroduc-ing changes have been those com-bining regulatory reform with investment plan-ning, interagency coordination, and incentives for operators. Detailed, accurate data are needed for policy making and monitoring. he growing availability of large datasets or even big data is a new opportunity that so far is being seized only by a few countries, such as Canada and South Africa.
* * *
Logistics performance depends on the availabil-ity to traders of reliable supply chains and pre-dictable service delivery. Global supply chains are becoming more complex, and the safety, social, environmental, and other regulations afecting traders and operators are becoming more demanding. Eicient management and information technology (IT) solutions in both the private and public sectors are vital tools of the trade in high-quality logistics. he ability to manage logistics processes in today’s global busi-ness environment is a crucial factor in national competitiveness.
The 2016 Logistics Performance Index
France is among the highest performing econ-omies in terms of logistics. his is a determin-ing factor of our competitiveness. It represents 10 percent of national GDP, 200 billion euro turnover, and 1.8 million jobs. Our coun-try is particularly known for the quality of its workforce, its inrastructure network, its equipment, and the availability of land. But this position cannot be taken for granted, and France needs to further progress to become a world leader. Ranked only 13th in global logistics (LPI World Bank) behind its clos-est neighbors, logistics underperformance is costing our economy between 20 billion and 60 billion euro.
Communiqué of the French Government March 20161
his quote is just one recent example of a major economy viewing logistics as a policy concern and developing a comprehensive approach involving public agencies and the private sec-tor. It follows the experience of many other advanced economies (for example, Canada, Finland, Germany, and the Netherlands) and emerging and developing economies such as China, Indonesia, Mexico, Morocco, South Africa, hailand, and Turkey.
Logistics refers to a series of services and activities, such as transportation, warehous-ing, and brokerage, that help to move goods and establish supply chains across and within borders. Although these services and activities are carried out by private irms for the beneit of private irms, service delivery and the ei-ciency of supply chains depend on public sec-tor provisions and interventions in a number of domains. Logistics uses publicly funded or
regulated infrastructure. International trade is processed by border agencies. Services and logistics activities are regulated with iscal, en-vironmental, safety, land use, and competition objectives. Since the irst edition of this report, in 2007, it has become widely recognized that these attributes are captured in the concept of logistics performance. Logistics performance varies across economies and is inluenced by policies.
he quote from France also encapsulates the two main objectives of current logistics strate-gies in all types of economies. First, logistics is an input to much of the economy, that is, in-dustry, commerce, and so on. he performance of logistics impacts productivity in other sec-tors. his is most oten presented in negative language in terms of average costs of logistics. Furthermore, logistics can be a sector of devel-opment in and of itself, where countries with high global or regional connectivity expect to play the role of a logistics and trade hub, such as the Netherlands in Europe and Dubai or Singa-pore in Asia.
his report is organized in three sections. he irst one introduces the LPI and its main index and trends across countries. Section 2 un-bundles the patterns of domestic policies and endowments and shows how performance var-ies across a number of dimensions. he third and inal section looks at implementation and emerging policy challenges.
Features of the 2016 survey
he 2016 LPI survey follows the same method-ology as the previous four editions of
Connect-ing to Compete: a standardized questionnaire
with two parts, international and domestic. In the international questionnaire, respondents evaluate six core pillars of logistics performance
in up to eight of their main overseas partner countries (box 1.1). In the domestic question-naire, respondents are asked to provide qualita-tive and quantitaqualita-tive data on the logistics envi-ronment in the country in which they work.
In 2016, more than 7,000 country assessments were made by logistics professionals, in line with the past two editions (box 1.2). Moreover, this edition covers 160 countries in the international LPI, whereas the domestic LPI covers more than 125 countries. his year’s survey attempts to cap-ture new trends in logistics practices worldwide, such as insights into logistics skills and the chal-lenges in recruiting qualiied staf for the indus-try. As in previous versions of the report, this edi-tion includes a quesedi-tion on the extent of demand for environmentally friendly logistics solutions.
The World Bank’s LPI analyzes countries in six components: • The efficiency of customs and border management
clearance
• The quality of trade and transport infrastructure • The ease of arranging competitively priced shipments • The competence and quality of logistics services • The ability to track and trace consignments
• The frequency with which shipments reach consignees within scheduled or expected delivery times
The components have been chosen based on theoretical and empirical research and on the practical experience of logistics pro-fessionals involved in international freight forwarding. The igure maps the six LPI indicators to two main categories:
• Areas for policy regulation, indicating main inputs to the sup-ply chain (customs, infrastructure, and services)
• Supply chain performance outcomes (corresponding to LPI indicators of time and reliability: timeliness, international shipments, and tracking and tracing)
The LPI uses standard statistical techniques to aggregate the data into a single indicator.a (See appendix 5 for a detailed
descrip-tion of how the LPI is calculated.) This single indicator can be used to compare countries, regions, and income groups. It can also be used for country-level work.
Because operators on the ground can best assess the vital as-pects of logistics performance, the LPI relies on a structured online survey of logistics professionals from the companies responsible for moving goods around the world: multinational freight forward-ers and the main express carriforward-ers. Freight forwardforward-ers and express carriers are best positioned to assess how countries perform. And their views matter because thes operators directly affect the choice of shipping routes and gateways, thereby inluencing the decisions
of irms on production location, choice of suppliers, and selection of target markets. Their participation is central to the quality and credibility of the LPI, and their involvement and feedback have been essential in developing and reining the survey in this ifth edition of the LPI. In 2016, 1,051 logistics professionals participated in the survey for the LPI.
Input and outcome LPI indicators
Supply
See the 2016 LPI questionnaire at http://lpi.worldbank.org/.
a. In all ive editions of the LPI (2007, 2010, 2012, 2014, and 2016), statistical aggregation has produced an overall index that is close to the simple average of country scores across the six LPI components.
Key indings of the 2016 international LPI
Once more, high-income economies solidify their past performance by occupying the top 10 positions of the ranking in 2016 (table 1.1). his empirical regularity has been present in all edi-tions of the LPI. In fact, the composition of the top 15 on the list of best performing countries has only changed marginally since 2014 and even 2010. his is not surprising. hese coun-tries have been traditionally recognized as dom-inant players in the supply chain industry, with a global footprint in transportation and logistics services provision.
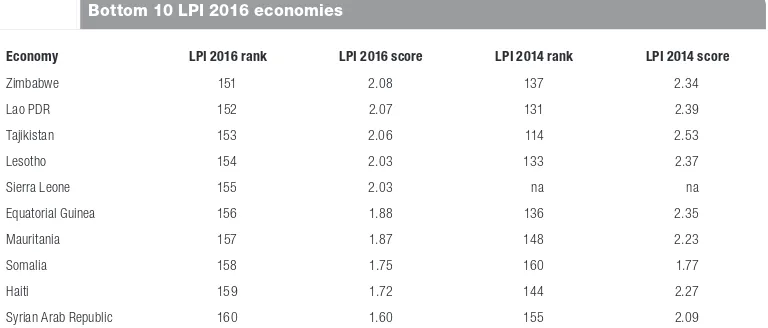
he bottom 10 countries in the ranking are composed of low-income and lower-middle-in-come countries (table 1.2). Generally speaking, these are either fragile economies afected by armed conlict, natural disasters, and political unrest, or landlocked countries that are natu-rally challenged by economies of scale or geogra-phy in connecting to global supply chains.
The lower-middle-income group contin-ues to be led by large economies such as India and Indonesia and emerging economies such as Kenya and Vietnam (table 1.3).
Meanwhile, the top-performing upper-middle-income economies show mixed perfor-mance, although the overall group composition remains similar to previous editions, with South Africa and China leading the group (table 1.4).
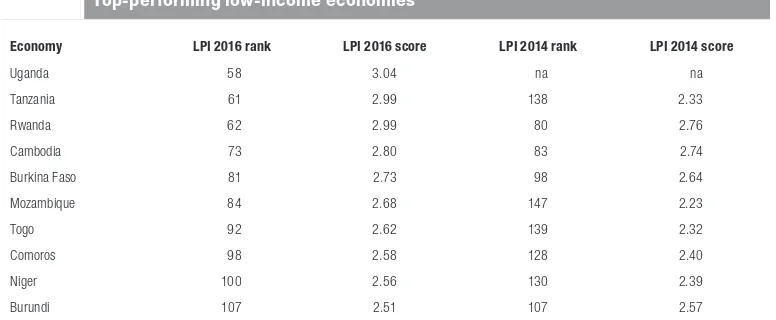
Within the low-income group, East African countries are leading the performance in this year’s edition (table 1.5).
Figure 1.1 presents the cumulative distribu-tion of LPI scores. he vertical lines represent the boundaries of LPI quintiles: ive groups con-taining the same number of countries rated in the LPI. he bottom quintile includes countries with the lowest LPI scores, and the top quintile, those with the highest scores. As in the past, in the third and fourth quintiles, the range of scores is similar. his means that country LPI scores are closer to each other, and any altera-tion in the country’s performance (and that of
Although the LPI and its components now offer the most compre-hensive and comparable data on country logistics and trade facilita-tion environments, they have a limited domain of validity. First, the experience of international freight forwarders might not represent the broader logistics environment in poor countries, which often rely on traditional operators. International and traditional operators might differ in their interactions with government agencies and in their service levels. Most agents and afiliates of international net-works in developing countries serve large companies and perform at different levels, including in time and cost, relative to traditional trading networks.
Second, for landlocked countries and small island states, the LPI might relect access problems outside the country assessed, such as transit dificulties. The rating of a landlocked country, such as Lao PDR, might not adequately relect local trade facilitation reform efforts, as these still depend on international transit routes mainly through Thailand and Vietnam.
To account for the sampling error created by the LPI’s sur-vey-based dataset, LPI scores are presented with approximate 80 percent conidence intervals (see appendix 5). These intervals
yield upper and lower bounds for a country’s LPI score and rank.a
Conidence intervals must be examined carefully to determine whether a change in score or a difference between two scores is statistically signiicant. An improvement in a country’s perfor-mance should be considered statistically signiicant only if the
lower bound of the 2016 LPI score exceeds the upper bound of the 2014 score.
Because of the LPI’s limited domain of validity and the need for conidence intervals to account for sampling error, a country’s exact ranking might be less relevant to policy makers than its proximity to others in a wider performance group or its statistically signii-cant improvements. Still, a close examination of the distribution of changes in ranking indicates that these behave similarly across all ive editions of the index.
One should thus interpret especially the ranks and changes in ranks from one LPI edition to another with caution. In the aggregate data in the past four LPI surveys, 46 countries scored 70 percent or more of the top performer. For these countries, the average dif-ference per rank position was 0.021 score points. For the next 53 countries scoring 50–69 percent of the top performer, the average difference per rank was only 0.011 score points. In the 40–49 per-cent range with 48 countries, the average difference per rank was a mere 0.006 score points. This means that countries at similar per-formance levels may have substantially different ranks, especially in the middle and lower range.
a. Upper bounds for LPI ranks are calculated by increasing a country’s LPI score to its upper bound while maintaining all other country scores constant and then recalculating LPI ranks. An analogous procedure is adopted for lower bounds.
Economy LPI 2016 rank LPI 2016 score LPI 2014 rank LPI 2014 score
Germany 1 4.23 1 4.12 Luxembourg 2 4.22 8 3.95
Sweden 3 4.20 6 3.96
Netherlands 4 4.19 2 4.05 Singapore 5 4.14 5 4.00 Belgium 6 4.11 3 4.04 Austria 7 4.10 22 3.65 United Kingdom 8 4.07 4 4.01 Hong Kong SAR, China 9 4.07 15 3.83 United States 10 3.99 9 3.92
Source: Logistics Performance Index 2014 and 2016.
Table 1.1 Top 10 LPI economies, 2016
Economy LPI 2016 rank LPI 2016 score LPI 2014 rank LPI 2014 score
Zimbabwe 151 2.08 137 2.34 Lao PDR 152 2.07 131 2.39 Tajikistan 153 2.06 114 2.53 Lesotho 154 2.03 133 2.37 Sierra Leone 155 2.03 na na Equatorial Guinea 156 1.88 136 2.35 Mauritania 157 1.87 148 2.23 Somalia 158 1.75 160 1.77 Haiti 159 1.72 144 2.27 Syrian Arab Republic 160 1.60 155 2.09
na is not applicable.
Source: Logistics Performance Index 2014 and 2016.
Table 1.2 Bottom 10 LPI 2016 economies
Economy LPI 2016 rank LPI 2016 score LPI 2014 rank LPI 2014 score
India 35 3.42 54 3.08 Kenya 42 3.33 74 2.81 Egypt, Arab Rep. 49 3.18 62 2.97 Indonesia 63 2.98 53 3.08 Vietnam 64 2.98 48 3.15 Pakistan 68 2.92 72 2.83 Philippines 71 2.86 57 3.00 Ukraine 80 2.74 61 2.98 El Salvador 83 2.71 64 2.96 Guyana 85 2.67 124 2.46
Source: Logistics Performance Index 2014 and 2016.
its neighbors) generates larger changes in the ranking relative to those countries in other quintiles (box 1.3).
As in past LPI reports, LPI scores are broken down into four categories, consistent with the score quintiles, used in all editions of
Connect-ing to Compete, as follows:
• Logistics-unriendly: includes countries with
severe logistics constraints, such as the least developed countries (bottom LPI quintile).
• Partial performers: includes countries with a
level of logistics constraints most oten seen in low- and middle-income countries (third and fourth LPI quintiles).
• Consistent performers: includes countries
rated better on logistics performance than
most others in their income group (second LPI quintile).
• Logistics-friendly: includes top
perform-ers, mostly high-income countries (top LPI quintile).
Logistics performance is rising, and performance is heterogeneous
With the ith edition of the LPI, a number of trends observed in previous reports repeat themselves. here are still marked diferences by component and quintile (igure 1.2). he per-formance of border agencies and infrastructure is the lowest among all quintiles, but especially so in the worst performing countries. On the
Economy LPI 2016 rank LPI 2016 score LPI 2014 rank LPI 2014 score
South Africa 20 3.78 34 3.43 China 27 3.66 28 3.53 Malaysia 32 3.43 25 3.59 Turkey 34 3.42 30 3.50 Panama 40 3.34 45 3.19 Thailand 45 3.26 35 3.43 Mexico 54 3.11 50 3.13 Brazil 55 3.09 65 2.94 Botswana 57 3.05 120 2.49 Romania 60 2.99 40 3.26
Source: Logistics Performance Index 2014 and 2016.
Table 1.4 Top-performing upper-middle-income economies
Economy LPI 2016 rank LPI 2016 score LPI 2014 rank LPI 2014 score
Uganda 58 3.04 na na
Tanzania 61 2.99 138 2.33 Rwanda 62 2.99 80 2.76 Cambodia 73 2.80 83 2.74 Burkina Faso 81 2.73 98 2.64 Mozambique 84 2.68 147 2.23 Togo 92 2.62 139 2.32 Comoros 98 2.58 128 2.40 Niger 100 2.56 130 2.39 Burundi 107 2.51 107 2.57
na is not applicable.
Source: Logistics Performance Index 2014 and 2016.
other hand, the timeliness component seems to outperform the rest and is generally viewed by logistics professionals as the least problem-atic pillar. However, the diference is greatest again among countries that show a dismal over-all score.
We have also examined which of the six components of the international LPI are above the overall index and which are below (table 1.6) as an indication of the performance of each
pillar. A positive entry indicates that a compo-nent score is higher than a group’s overall inter-national LPI score and vice versa for a negative entry.
A number of features stand out. Customs and border agencies continue to underperform systematically in comparison with the other components of the LPI. Infrastructure exhibits a similar behavior as in previous occasions, with the highest quintile only showing a positive
1.50 2.00 2.50 3.00 3.50 4.00 4.25 0.0
0.2 0.4 0.6 0.8 1.0
Source: Logistics Performance Index 2016.
Figure1.1 Cumulative distribution of LPI scores
Cumulative density
LPI score Third quintile
Top quintile
Logistics friendly Bottom quintile
Partial performers
Consistent performers Second quintile
Logistics unfriendly
Fourth quintile
2.0 2.5 3.0 3.5 4.0 4.5
Top quintile Second quintile
Third quintile Fourth quintile
Bottom quintile LPI score
Source: Logistics Performance Index 2016.
Figure1.2 LPI component scores, by LPI quintile
As observed in previous editions of the report, logistics perfor-mance, as captured by the LPI, transcends the overall level of de-velopment and income. Geography matters, too. The crossborder nature of many logistics activities, such as trucking or freight for-warding, means that logistics performance is driven in part by subregional connectivity patterns. The performance of a regional gateway may diffuse across regional borders. As the example of East Africa shows (featured in this report), consistent improvement in integration and corridor performance beneits several countries.
The standard regional groupings (Sub- Saharan Africa, Eastern Europe and Central Asia) represent clear hemispheric blocs, yet are too large to reveal much about performance convergence or heterogeneity within and between subregions.
In an attempt to reach a iner attribution of performance, re-gions were subdivided as shown in the igure, and LPI score vari-ance was decomposed in two: on one hand, the varivari-ance explained
by variations in performance within subgroups and, on the other
hand, variance explained by variability between subgroups. Overall,
total variance in LPI scores can be explained majorly (64 percent) by variance across subregions.
While this is an intuitive and expected result, it is also indica-tive of the coordinated movement in the rank that regional blocs can experience relative to neighboring subregions, and it shows that subregional convergence in scores merits further analysis. While certain positive regional developments could explain such performance premiums in speciic parts of the world (for instance, elimination of border formalities within corridors), other, negative occurrences (such as armed conlict and political unrest) can pres-ent a contagion phenomena not easy to avoid.
Coastal access is another important enabler of logistics per-formance. In development economics generally and in trade and
transport facilitation in particular, much attention has been paid to the disadvantaged position of low- and middle-income landlocked countries. Lack of access to the sea poses persistent challenges to the growth and development of landlocked developing coun-tries and has been the main factor hindering their ability to bet-ter integrate with the global trading system. The transit of export and import goods through the territory of at least one neighboring state and frequent change of transport mode lead to high transac-tion costs and reduced internatransac-tional competitiveness. The issue of landlocked developing countries has also generated much policy work such as the 2003 Almaty Program of Action under the United
Nations and the Vienna Program of Action 2014–24.a
The trade logistics handicap is illustrated by the average overall LPI scores for 2010–16 of landlocked and coastal countries across World Bank regions. This comparison shows a rather consistent pattern, where coastal countries score better than their landlocked peers at similar income levels. In the upper-middle-income group, this difference in Europe and Central Asia was 0.31 score points. The difference was even larger among lower-middle-income econo-mies in South Asia (0.52 score points). In Sub- Saharan Africa, how-ever, several landlocked countries performed better than coastal ones: by 0.20 points in the low-income group and by 0.14 points in the upper-middle-income group. Only Sub- Saharan African coun-tries in the lower-middle-income group followed the familiar pat-tern, with a 0.20 point lead by coastal countries over landlocked countries. Among high-income countries of the Organisation for Economic Co-operation and Development (OECD), the difference between landlocked (3.69) and coastal countries (3.71) was almost insigniicant (0.02 points) (see igure).
a. World Bank and UN-OHRLLS (2014).
2.0 2.5 3.0 3.5 4.0
LPI score means, by geographical region
LPI 2016 mean
Source: Logistics Performance Index 2016.
Western Europe Southeastern Europe Gulf Cooperation Council
Middle East & North Africa East
Africa
Southern Africa
Western & Central Africa
Commonwealth of Independent States North
markup compared with the overall score. None-theless, this time around, the quality of logistics services tends to be lower than the general per-formance across all quintiles. his was not the case for the highest performing countries in the past. Moreover, the tracking and tracing com-ponent also is lower than the overall score across all three lowest quintiles. Although this can be explained by a myriad of factors, a possible in-terpretation is that, during economic down-turns, investments in technology are sometimes postponed. Another interpretation is that the requirements for tracking and tracing are more challenging than before, and today’s technical solutions no longer meet the requirements.
As observed from previous editions, average country LPI scores generally improve, although
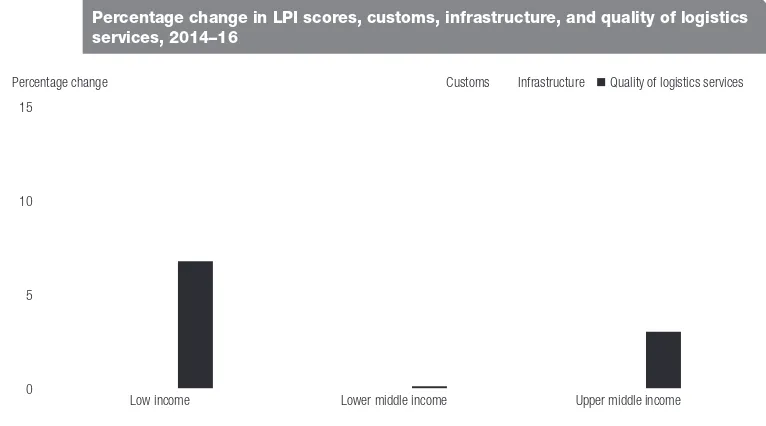
some factors and groups move faster than oth-ers. In low-income and lower-middle-income countries, average LPI scores have progressed the most rapidly in customs, infrastructure, and the quality of logistics services (igure 1.3).
Progress can be also tracked when asking re-spondents about the change in the environment for logistics since the last LPI edition. As in the past, survey respondents in better performing countries perceive more concrete improvements than in nonperforming economies (table 1.7). he contrast is the highest in absolute terms for all services (public and private) and infrastruc-ture variables relative to regulations and gover-nance variables.
Streamlining border clearance procedures and ensuring access to physical infrastructure will continue to be a priority for low-income economies. On the other hand, upper-middle-income countries have seemingly improved faster in the quality of logistics services, as in the previous 2014 edition. his continues to support the idea that middle-income countries have increasingly shited their focus toward sot reforms and less so in physical infrastructure.
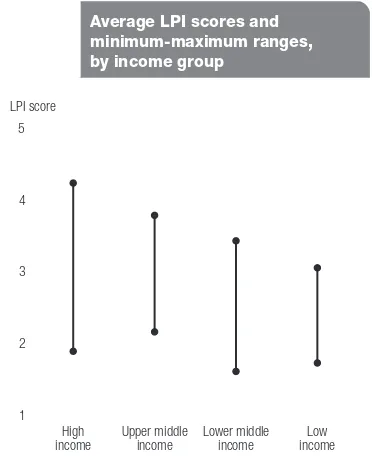
Still, a notable gap in LPI scores remains between high- and low-income countries (ig-ure 1.4). High-income countries, on average, surpass low-income countries by 45 percent in terms of LPI scores. Moreover, among the
Percentage change
Source: Logistics Performance Index 2014 and 2016.
Figure1.3 Percentage change in LPI scores, customs, infrastructure, and quality of logistics services, 2014–16
Customs Infrastructure Quality of logistics services
0 5 10 15
Upper middle income Lower middle income
Low income Percent
Quintile Customs Infrastructure
Ease of arranging international
shipments
Quality of logistics services
Tracking
and tracing Timeliness
Bottom quintile −0.13 −0.14 0.05 −0.05 −0.11 0.35
Fourth quintile −0.15 −0.19 −0.01 −0.06 −0.06 0.43
Third quintile −0.23 −0.22 0.06 −0.06 −0.01 0.42
Second quintile −0.19 −0.13 −0.03 −0.12 0.02 0.44
Top quintile −0.19 0.04 −0.16 −0.02 0.06 0.28
Note: All calculations are based on the weighted average score for the LPI and its components over 2007–14.
Source: Logistics Performance Index 2016.
top 30 performing countries, 22 are members of the Organisation for Economic Co-oper-ation and Development (OECD), almost un-changed since the 2014 report. Nonetheless, countries can still outperform their income group peers despite the performance gap. his is why income alone cannot explain why per-formance varies widely among countries in cer-tain income groups. he list of countries over-performing their income group peers includes Kenya, Rwanda, and Uganda, but also China and India (igure 1.5). Conversely, the list of countries that fare below their potential for a given level of income includes most resource-rich economies such as Equatorial Guinea, Gabon, the Russian Federation, and Trinidad and Tobago.
For the irst time in the history of the
Con-necting to Compete reports, landlocked countries
are no longer automatically the most unfortu-nate ones, as evidenced by, for instance, the per-formance of Rwanda and Uganda. Despite the mentioned variations, caution should be exerted when interpreting LPI rankings.
Trends over the past four LPI editions
The gap in relative LPI scores — the scores expressed as a percentage of the leading coun-try’s score — is quite similar to the gap revealed in past years. Nonetheless, a relatively novel result is that the average relative score perfor-mance in the three lowest quintiles shows a small decrease compared with the last three LPI editions (igure 1.6).
hus, in the past, the gap between the best and worst performing countries was smaller for countries with lower scores. In the 2016 edition, the relative lowest performer is the Syrian Arab Republic, with a score equal to 19 percent of the score of the highest performer (Germany). In 2014, the relative lowest performer was Somalia, with a score equal to 25 percent of the score of the highest performer.
he correlation between the 2014 and 2016 LPI scores is stronger than before, with 0.93 in scores, and 0.90 between ranks (whereas it was 0.91 and 0.86 between 2014 and 2012). One should keep in mind that, because the data are
survey-based, sampling errors occur. Statisti-cally signiicant changes are revealed only if the conidence intervals for the 2016 and 2014 scores do not overlap, which is only the case for the economies in table 1.8.
Following up on a feature introduced in the 2014 report, the scores of the six LPI compo-nents across the four latest surveys were used to provide a bigger, better balanced picture of country performance. his approach reduces the noise and random variation from one LPI survey to another and enhances the comparison of the 167 countries in the 2016 edition, one more than in the 2014 aggregation.
Percent of respondents
Component Bottom quintile Fourth quintile Third quintile Second quintile Top quintile
Customs 40 53 53 65 65
Other border procedures 31 37 40 54 60
Trade and transport
infrastructure 34 48 50 60 60
ICT infrastructure 41 54 67 78 73
Private logistics services 39 63 61 76 65
Logistics regulation 19 35 39 47 35
Incidence of corruption 22 36 37 41 40
ICT is information and communications technology.
Source: Logistics Performance Index 2016.
Table 1.7 Respondents reporting an improved or much improved logistics environment since 2012, by LPI quintile
1
Note: Vertical rules show minimum-maximum range.
Source: Logistics Performance Index 2016.
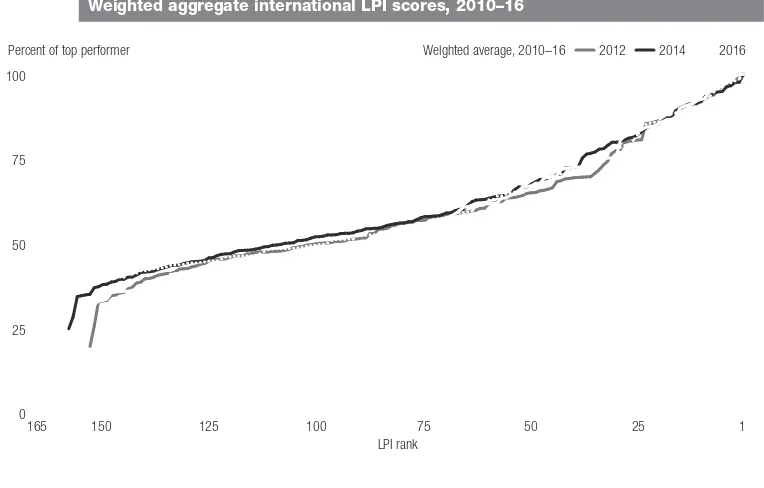
In this 2016 report, the four previous years’ scores in each component were given weights: 6.7 percent for 2010, 13.3 percent for 2012, 26.7 percent for 2014, and 53.3 percent for 2016 (the most recent data carry the most weight; ig-ure 1.7). he method is identical to the one in the 2014 report, which used the data for 2007, 2010, 2012, and 2014.
he possibility to use such weighted values is an important feature because an individual country’s score and, consequently, also its rank
can oscillate quite a lot, and the change will not be statistically signiicant. his also happened in several countries in 2014–16, especially those with a wide conidence interval in their scores, indicating more disagreement among the re-spondents. he impact tends to be ampliied if the number of observations is low, as is oten the case in smaller countries. Large traders, such as China, Germany, the United Kingdom, and the United States, had conidence intervals at 0.05 score points or below in the 2016 LPI, which is about 1 percent or less of their scores. By contrast, the Republic of Congo (conidence interval at 0.48), Morocco, and Lebanon (both at 0.41) had the largest conidence intervals in 2016, over 15 percent of their scores.
Also in this second aggregated 2010–16 LPI, Germany ranked highest at 4.17 (4.10 in the aggregated 2007–14 LPI), followed by the Netherlands 4.12 (4.05) and Singapore 4.10 (4.06). he top 3 countries are the same, even if the Netherlands and Singapore have traded places. Of the 28 European Union member states and the 34 OECD members, 14 and 22, respectively, were among the top 30 countries. he non-OECD economies in this group were Singapore (3rd); Hong Kong SAR, China (8th); United Arab Emirates (19th); Taiwan, China (23rd); South Africa (25th); China (26th); Qatar (29th; new among the top 30); and
5 6 7 8 9 10 11 12
Note: Fitted values are based on an ordinary least squares regression using data for all countries. Underperformers (black diamonds) are the non–high-income countries with the 10 smallest residuals. Overperformers (black circles) are the non–high-income countries with the 10 largest residuals.
Source: Logistics Performance Index 2016.
Figure1.5 LPI overperformers and underperformers
Log of GDP per capita (US$)
Linear regression
Source: Logistics Performance Index 2010, 2012, 2014, and 2016.
30
2010 2012 2014 2016
Malaysia (30th). All but two of the top 30 were high-income countries; Malaysia and South Af-rica are upper-middle-income countries.
Also this time, all OECD countries were in the top third. he top third in the previous 2007–14 LPI included all European Union member states, but, now, two of them, Roma-nia at 3.05 (ranked 56th) and Bulgaria at 2.96 (62nd), fall narrowly outside this category.
In the aggregated international LPI, Somalia again scores lowest at 1.67 (1.63 in the previous LPI), ranked 167th. Despite some convergence of countries’ logistics performance since the 2007 LPI, the logistics gap between high- and low-income countries remains wide. As in previ-ous LPI surveys, the countries with the weakest performance in 2016 were least developed coun-tries, especially landlocked countries or small island states, some of them also conlict-ridden. his is vividly illustrated by the Syrian Arab Re-public, which scored 2.31 and was ranked 148th of 166 countries in the 2007–14 LPI. Because of its low score and rank in the 2016 LPI, it now
occupies the second-lowest rank, 166th, at 1.94 in the aggregated 2010–16 LPI.
he convergence of performance — broadly, the range from rank 40 to 120 — means this space is crowded with countries scores only sep-arated by a few decimals (box 1.4). hus, some large changes in rank might be witnessed in this middle ground, even if the underlying score changes are only marginal.
Statistically signiicant change in LPI score, 2014–16
Low income
Lower middle income
Upper middle income
High income
Positive change Tanzania
Congo, Dem. Rep. India Kenya
South Africa China
Germany Israel Austria Switzerland Hong Kong SAR, China
Singapore United Arab Emirates
Venezuela, RB
No change 135 countries
Negative change Haiti Tajikistan Malaysia
Thailand
Source: Logistics Performance Index 2014 and 2016.
Table 1.8 Economies with statistically signiicant changes in LPI scores
0 25 50 75 100
Source: Logistics Performance Index 2010, 2012, 2014, and 2016.
Figure1.7 Weighted aggregate international LPI scores, 2010–16
Percent of top performer
LPI rank
Weighted average, 2010–16 2012 2014 2016
Since the irst edition of Connecting to Compete in late 2007, many policy packages promoting gains in logistics, trade facilitation, and transport have been labeled as connectivity. The Asia-Paciic Economic Cooperation (APEC), for example, has a supply chain connectivity initiative, while Indonesia has set up a connectivity program, as has a group of countries in Central America and the Caribbean. Yet, despite the relevance and coherence of the policies, the concept remains intuitive and often loosely deined, such that connectivity may become a catchword with too blurry a relation to such practicalities as trade facilitation and logistics.
Some clariication and formalization of the concept have been
proposed.a Trade logistics is supported by companies that operate
in networks. International transportation, shipping, or air transport takes place in complex networks structured in hubs and spokes. The connectivity of a country, or perhaps one of its ports or airports, is deined as how central this country is to those networks. Connectiv-ity partly relects geography and the global structure of transporta-tion and logistics networks. Country-speciic trade transactransporta-tion costs coming from supply chain ineficiencies increase economic distance and reduce connectivity. Hence, policies that increase logistics per-formance improve connectivity, notwithstanding network geography. Of course, connectivity is not a purely exogenous concept. Instead, it is determined by a range of factors. One is market size: larger markets create more demand for international shipments; so, container lines, which operate on a network basis, are more likely for business reasons to make such countries more central in their schedules. It is therefore not only a country’s policies and private
sector development efforts that may promote connectivity. Larger countries typically have an advantage, and smaller ones have to exert more effort to attract international transport at low cost and suficient regularity.
As one might expect, the LPI relates to other connectivity in-dicators, such as the Liner Container Shipping Connectivity Index (LSCI), published by UNCTAD. The igure below illustrates this cor-relation, but also conirms that the two indicators indeed capture tied but complementary dimensions in connectivity.
The point can also be made by taking an inverse approach, focus-ing on trade costs: trade costs are high in poorly connected peripheral countries and low in well-connected hubs. Research by the World Bank and the United Nations Economic and Social Commission for Asia and the Paciic on trade costs has shown that connectivity to maritime and air transport networks, along with logistics performance, are the main determinants of a country’s overall level of trade costs.
An additional challenge that is not addressed by existing data is internal connectivity, particularly in large countries. The LPI mea-sures performance at key international gateways in countries such as India and China, but does not address how easy or dificult it is to move goods to the hinterland. Yet such movements are important from developmental and equity standpoints. Internal trade costs likely remain high in many countries, and reducing them could make a signiicant difference to the lives of producers and consumers outside main cities.
a. Arvis and Shepherd (2011); Hoffmann and Ojala (2010).
20 40 60 80 100 120 140 160 180
1.5 2.0 2.5 3.0 3.5 4.0 4.5
Logistics Performance Index 2016
Source: Logistics Performance Index 2016.
The LPI and the Liner Shipping Connectivity Index
Liner Shipping Connectivity Index 2015
Unbundling logistics performance
he international LPI provides some prelimi-nary information on the drivers of overall logistics performance. To unbundle the survey results further, however, it is necessary to refer to the domestic LPI. his section is based on the domestic LPI, where surveyed logistics profes-sionals assess the logistics environments in the countries where they work. he domestic part thus contains more detailed information on countries’ logistics environments and core logis-tics processes and institutions. his approach looks at the logistics constraints within coun-tries, not merely at the gateways, such as ports or borders. It analyzes country performance in four major determinants of overall logistics per-formance: infrastructure, services, border pro-cedures, and supply chain reliability.
Infrastructure
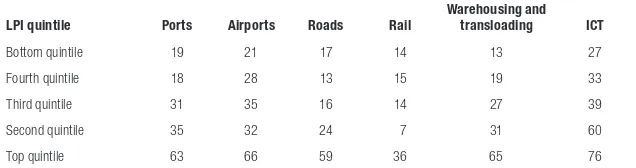
Survey respondents in top-quintile countries rated their infrastructure far more highly than others (table 2.1). Diferences among the other four quintiles are less striking, especially for roads and rail. It is important to highlight that the spread of scores is narrowest in informa-tion and communicainforma-tions technology (ICT),
which suggests that developing countries have been investing heavily in modern technologies, perhaps even leapfrogging intermediate levels in some cases. Of course, ICTs cannot replace other types of hard infrastructure, so a renewed focus on the other areas is needed.
Infrastructure, though still a constraint in developing countries, seems to be improving. Since the previous LPI survey, there is a general perception that infrastructure has improved in all performance quintiles (igure 2.1), but more so in the top-performing countries. If this per-ception relects a faster rate of infrastructure improvement from an already strong base in those countries, it might indicate persistence of the logistics gap identiied in previous edi-tions. Of particular concern is the lower igure recorded in the bottom quintile, which would be consistent with a widening gap.
Satisfaction with infrastructure quality varies by infrastructure type. As in previous years, respondents in all LPI quintiles are most satisied with ICT infrastructure. As in 2014, there is evidence of a narrowing infrastructure gap, particularly between the top and bottom quintiles where the rate of improvement seems noticeably more rapid than in the last version of this report; improvement in the middle quintiles is on a par with what has been ob-served previously. By contrast, but in line with previous reports, rail infrastructure inspires general dissatisfaction. In the bottom quintile, infrastructure generally fails to satisfy, an excep-tion to the pattern of variaexcep-tion.
Similar patterns emerge when the domestic LPI data on infrastructure are disaggregated by World Bank region, excluding high-income countries (table 2.2). he highest ratings in all regions except East Asia and the Paciic are for ICT. Ratings for other types of infrastructure
Percent of respondents
LPI quintile Ports Airports Roads Rail
Warehousing and
transloading ICT
Bottom quintile 19 21 17 14 13 27
Fourth quintile 18 28 13 15 19 33
Third quintile 31 35 16 14 27 39
Second quintile 35 32 24 7 31 60
Top quintile 63 66 59 36 65 76
ICT is information and communications technology.
Source: Logistics Performance Index 2016.