See discussions, stats, and author profiles for this publication at: https://www.researchgate.net/publication/260192349
In search of nexus between attacking
game-patterns, match status and type of ball recovery
in European Soccer Championship 2008
Conference Paper · December 2011
CITATIONS
11
READS
436
3 authors, including:
Daniel Barreira
University of Porto
30PUBLICATIONS 120CITATIONS
SEE PROFILE
Júlio Garganta
University of Porto
115PUBLICATIONS 513CITATIONS
SEE PROFILE
All content following this page was uploaded by Daniel Barreira on 19 March 2014.
In search of nexus between attacking game-patterns, match status and type of ball recovery in European Soccer Championship 2008
D. Barreira1,2, J. Garganta1,2 and T. Anguera3
1
Faculty of Sport, University of Porto, Portugal
2
Centre of Research, Education, Innovation and Intervention in Sport, Portugal
3
Faculty of Psychology, University of Barcelona, Spain
Abstract:
The current study aimed to identify patterns of the successful attacking phases according to the type of ball possession recovery and match status (winning, drawing or loosing) of winning teams participating in the EURO 2008.
This is a lag-log study, according to a follow-up, nomothetic and multidimensional design, matching field formats with a system of categories. After outlining the protocol and determining the observation reliability (Cohen’s Kappa>0.88), seven matches (fourteen observations) of the EURO 2008 were coded.
Using the Software for Visualization and Registration of the Offensive Phase in Soccer (Barreira et al., 2010), 761 attacks, 10007 multievents and 38846 events were recorded and analysed by the SDIS-GSEQ Software (Version 5.0.77, October, 1, dynamics. Unsuccessful attacks (ball out of the field or intervention of the opponent goalkeeper) showed the tendency to occur after a defensive action followed by pass, goal kick or free kick (z=2.77; z=3.67; z=4.36, respectively). When loosing (n=103), the teams showed the tendency to improve ball possession in mid offensive zones (z=2.00). When winning (n=108), teams frequently performed defence/attack transition behaviours to get closer to the opponent goal. While drawing (n=540), teams tended to vary the offensive methods to score a goal. In all the contexts of match status considered, the central offensive zone tended to be the most used to shoot.
Key-words:
Observational Methodology; Sequential Analysis; Soccer match analysis; European Championship 2008
1. Introduction
Actually, it is unanimous that the moments of changing ball possession involve behaviours, which meaning to the match needs to be known. After ball recovery, and inversely after ball lost—transition moments—both teams compete to get advantage in time and space, developing individual and collective behaviours to improve their own organization levels, and to decrease the opponent team’s balance. Although Romero Cerezo (2000) referred that transitions are moments with no organization, including chaotic behaviours, Barreira and Garganta (2007), and Barreira et al. (2010) observed that transitions could be trained to improve the patterns of play and probably reduce the game uncertainly and improve this attitude-changing efficacy.
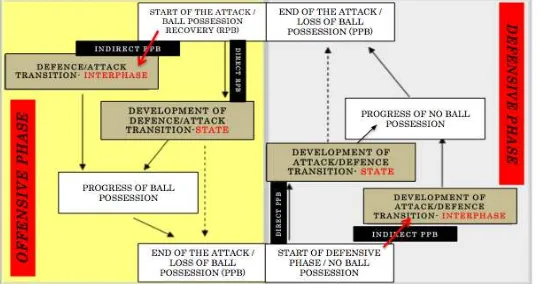
In the current study, the Organization Model of the Soccer Game, proposed by Barreira and Garganta in 2007 was used (Figure 1), to systematize the offensive and defensive phases of the game, including the transitions. In this model, two types were proposed: interphase transition, and state transition, depending on the way the ball is recovered, indirect or direct, respectively.
Figure 1.Organization Model of the Soccer Game (Barreira & Garganta, 2007)
According to Hughes and Bartlett (2002), Soccer is a “goals game”. However, the variance of the match score is not on a sufficient amount that allows identifying statistical determinants, due to the low number of goals scoring in matches (Lago & Martín, 2006).
This means that it might be more difficult to discriminate the match play patterns performed by winning teams when compared with defeated teams. Regarding the overall statistics of the World Cups, the average of goals scored per game has been decreasing, e.g., from Uruguay 1930 to Germany 2006, there was a reduction of 1.66 goals per game in average (3.89 to 2.23, respectively) (Castellano Paulis, 2009). Therefore, most studies considered that score opportunities (shots) and time of ball possession are the main tactical performance indicators to succeed in Soccer (Hughes & Bartlett, 2002).
al. (2004) observed that the duration of ball possession was related to successful performance, while Bate (1988) added that the more ball possessions a team had, the greater the chance of entering the attacking third of the field, and consequently more goal-scoring opportunities were created. Griffiths (1999) studied the winning team of the World Cup 1998—France—and found that the team was able to create more shots on goal than the opponent teams, and had the ability to retain ball possession for long periods. The author added that the French team attacked preferably through the wings, creating significantly more crosses than their opponent teams. Barreira et al. (2010), also investigating a specific team—Spain, the Euro 2008 champion—similarly observed that the team preferred the utilization of crosses from the left to the central path of the offensive sector, in contexts of numerical superiority, suggesting that in modern Soccer successful teams tend to attack preferably from wings. However, other studies found that crosses did not maintain positive relationship with finalization behaviours, as shot on goal (Hughes et al., 1988; Silva et al., 2005).
The behaviours carried out by Soccer players during matches seem to be affected by variables such as match location, match status and quality of the opposition (Taylor et al., 2008).
Some authors concluded that the final match score states only the team who won the match, but no complementary indicators to assess the performance of one player or team can be obtained (Hughes & Bartlett, 2002; Ensum et al., 2005). For instance, when considering the match outcome as a win (e.g., a 1–0 win) for a team that scored a goal in the 85th minute, no account would be taken of the fact that for 95% of the match the teams were drawing. Therefore, the present study intended to state the influence of the match status (winning, drawing, and loosing) on the attacking patterns of the most successful teams participating in the Euro 2008. Accordingly, Taylor and Williams (2002) studied the World Cup 2002 winning team, and observed a relationship between the end of the offensive phase and the type of ball possession recovery, suggesting that the ball possession recovery in the defensive area resulted in more attempts on goal than for the other teams of the tournament.
Because Soccer game is a tactical wholeness, the offensive game-patterns evidenced by a team are closely associated with defensive patterns, and vice-versa, behaving the cooperation-opposition context, as the individual and collective constraints. Soccer game is characterized by its successive alternation of states of order and disorder, stability and instability, uniformity and variety (Garganta, 2001). However, it is also possible to observe, even only by the intuition or empirical experiences, behaviours that occur with unambiguous frequency and sequentially all over the match(es). Consequently, a model of analysis that achieves the specific complexity of the Soccer game in natural contexts has been proposed for match analysis—the Observational Methodology, in particular the Sequential Analysis—. This method enables the inclusion of the temporal constraints of the Soccer game, with a continuous analysis of the team(s), match event(s), and/or player(s), etc. More than a quantification of actions, this model permits the qualification of the quantities, establishing relations of the behaviours in the context they occur.
when the attacking player took the ball out of the pressure zone, maintaining the interaction, with one of the teams being particularly registered and analysed, consequently demonstrating heterogeneous responses to the match events. Thus, this study was included in the quadrant IV: a follow-up, nomothetic and multidimensional study (F/N/M) (Anguera, 2001). The adoption of this F/N/M design led to a series of decisions being made regarding the type of data, structure of the observation instrument, data quality control, and data analysis.
2.2 Sample
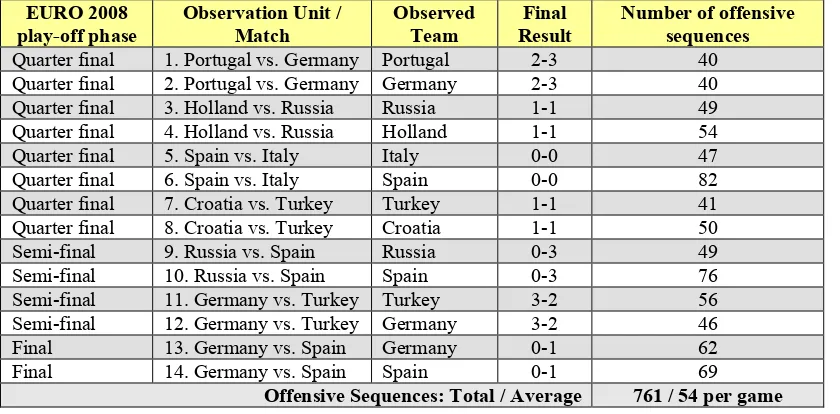
Table 1.Number of offensive sequences per match in the EURO 2008 play-off
EURO 2008
Quarter final 1. Portugal vs. Germany Portugal 2-3 40
Quarter final 2. Portugal vs. Germany Germany 2-3 40
Offensive Sequences: Total / Average 761 / 54 per game
Reliability was assessed using the EURO 2008 final match, with the respective inter-observer agreement. The first 30 minutes of the match Germany versus Spain were coded, with the reliability evaluated by the function “compute Kappa” of the SDIS-GSEQ software (version 5.0.77, October, 1, 2010, Bakeman & Quera, 1995). Bakeman & Gottman (1989) preconized that to have stability in the observations, Kappa value has to be superior to 0.75 in all the instrument’s criteria. In this study, Kappa values recorded from 0.88 to 0.98, with the lowest value (k=0.88) in criterion 6—Centre of the game—and the highest in criterion 1—Start of the offensive phase— and criterion 4–Patterns of field space position— (k=0.97 and k=0.98; respectively).
2.3 Instruments:
2.3.1 Observation instrument
One basic requirement to use the Observational Methodology is to create an ad hoc
instrument (Hernández Mendo et al., 2000). In the present study, field formats were combined with a system of categories simultaneously to answer a theoretical agreement and to follow the study particularities (Anguera, 1991). The instrument had seven criteria and a total of 80 behaviours, each of them represented by a different code:
1. Start of the offensive phase;
2. Development of defence/attack transition-state; 3. Progress of ball possession;
4. Finishing of the offensive phase;
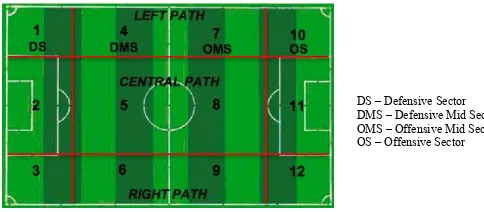
5. Patterns of field space position (Garganta, 1997) (Figure 2.) (E/ME); 6. Centre of the game/Ball position (Barreira & Garganta, 2006) (E/ME);
7. Spatial patterns of teams’ interaction, including position of the players with the ball and opponents (Castellano Paulis, 2000) (E/ME).
The first four criteria represented the behaviours, and the fifth was a structural criterion, dividing the field in 12 zones/categories (Garganta, 1997; Figure 2). The sixth and seventh criteria characterized the interactional contexts, regarding the relations of opposition and cooperation between teams and players.
Figure 2.Patterns of field space position divided in twelve zones/categories (adapt. Garganta, 1997)
Criteria 5, 6, and 7 respected the conditions of exhaustiveness and mutual exclusivity (E/ME). For the other criteria (1 to 4), it was possible to incorporate other categories to the instrument to optimize the quality and the reliability of the observation process and final product. Thus, all the behaviours that occurred in the match were possible to register, although each behaviour corresponded only to one category and code (Table 2).
Table 2.Observation Instrument (Barreira et al., 2010)
2.3.2 Recording and Analysing instruments
The Software for Visualization and Registration of the Offensive Phase in Soccer (Barreira et al., 2010) was created to reduce time spent in the observation process and errors when compared with the hand notation system. Consequently, it could improve the study reliability. Before registering the sequence, the observer categorized the match status, the competition phase, and match time. Registration software followed the analysis software language—SDIS-GSEQ software (Sequential Data Interchange Standard - Generalized Sequential Querier; Version 5.0.77 , October, 1, 2010, Bakeman & Quera, 1995). Data were exported to one Excel database, and then to the analysis software. The recording instrument included a Coding Manual, which incorporates the definitions of the codes that governed its use.
3. Results and Discussion
3.1. Ball possession recovery
To analyse the associations between ball possession recovery and the end of the attack, a retrospective analysis was used, which did not follow the conventional rules of Sacket (1979) to find out the behaviours’ patterns max-lag. To increase the significance level of the results and thus determine the associations between categories with 99% of certainty, values of z≥2.58 or ≤-2.58, to p≤0.01 or p≥-0.01, respectively, were considered.
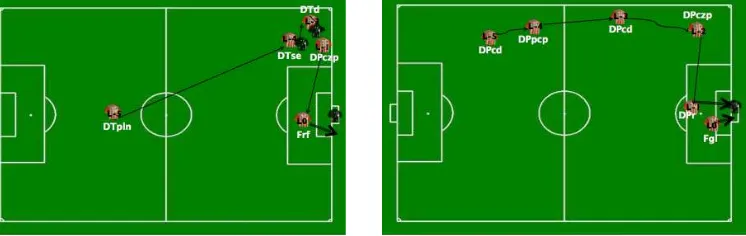
Wide shot game-patterns showed a positive relation with ball recovery by interception (z=2.82) in lag -11. Wide shots were also verified after a ball recovery by corner kick (IIc) in lag -10 (z=2.70; Figure 3) and in lag -2 (z=3.03). As illustrated in figure 4, an intervention by the opponent goalkeeper occurred after a ball possession recovery by corner kick. Then, a throw-in of the observed team in zone 10 was performed, succeeding a cross in the same zone, with an intervention of an opponent player that originated another corner kick. This was performed in zone 10, with the ball reaching the zone 11 in context of attacking line versus the opponent’s rear line. There, a shot was made, and the final wide shot occurred after a rebound, in context of no pressure in numerical equality in the centre of the game.
Figure 3.Attacking game-pattern resulting in a wide shot.
In the EURO 2008 play-off matches, the inside shot game-patterns showed a positive relation with ball recovery by throw-in, foul and opponent interception. The regaining by interception occurred immediately before the shot on goal in zone 8 or 11 (z=3.56 and z=2.59; respectively), showing that once a team recovered the ball in central offensive zones, it might have caused inside shots without scoring a goal.
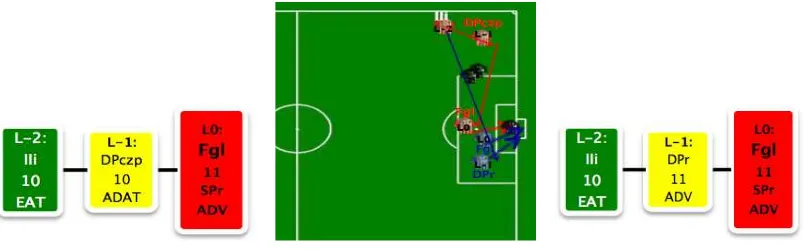
A probability of goals being preceded by a throw-in was observed (z=2.58; Figure 4). After this action, it was verified a ball progression (z=4.11) in the same lateral wing, from zone 7 to 10 (z=3.00), with a cross to the central offensive zone in interactional contexts of exterior zone versus rear line (z=3.35). On the central offensive zone, it was created a situation of attacker(s) against goalkeeper (z=6.67), which resulted in a shot with no goal scored. In the rebound, the goal was scored in a relative numerical superiority and a situation of attacker(s) against goalkeeper.
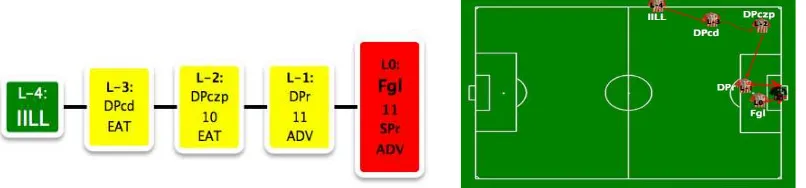
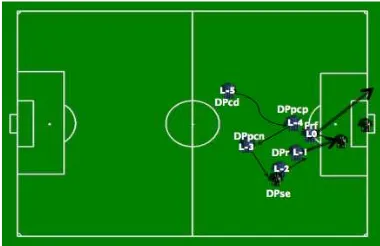
Also, it was found the probability of goals being preceded by an indirect free kick on zone 10 (z=4.86) in lag -2. Then, this set piece was performed in two ways (Figure 5): (i) passing to zone 10, followed by a cross (z=6.10); and (ii) pass to the central offensive zone, where a shot with no goal was performed (z=4.50). In both situations, the attack ended with a goal on zone 11 (z=6.19) in situations of attacker(s) against the opponent goalkeeper, with relative numerical superiority (z=2.77).
Figure 5. Goal game-patterns succeeding an indirect free kick
In the EURO 2008 play-off, a probability of a goal to occur in the central offensive zone (11), in interactional contexts of relative numerical superiority (SPr), and in situations of attacker(s) against goalkeeper (ADV) was observed.
Unsuccessful attacks (ball out of the field and intervention of the opponent goalkeeper) showed the tendency to occur after a defensive action followed by pass (z=2.77), goal kick and free kick (z=3.67 and z=4.38, respectively). It was observed that the end of the attack caused by error of the player with the ball or the opponent intervention (exception for the goalkeeper) (Fbad) was probably inhibited by ball recovery by the goalkeeper and throw-in (z=2.70 and z=2.60; respectively).
There were found relations between the types of ball possession recovery and the zones where it occurred (Figure 6).
Direction of the attack
Figure 6.Associations (positive in yellow; negative in red) between field zones and type of ball
possession recovery, regarding z values in the moment of ball recovery.
Consequently, teams probably assumed a defending strategy in which teams performed their defending behaviours in the mid-defensive zones, in particular in the central zone (5), opposing the defensive ones (2).
3.2. Match Status
When the teams were winning (n=103, observed in 5 matches), the tendency was to use behaviours of defence/attack transition after recovering the ball in defensive and mid-defensive zones. Accordingly, wide shots (figure 7) tended to be preceded by a long pass from mid-defensive zones to the left offensive one (10: z=2.62) in defence/attack transition. An opponent performed unsuccessfully and the ball carrier dribbled one opponent, and performed a positive cross to the central offensive zone (11: z=2.60), where the wide shot was performed.
However, it was found an exception to the goal patterns (figure 8). Goals tended to be preceded by an attack carried out with behaviours of development of ball possession in the left lateral wing (4: z=2.62; 7: z=2.70). A cross (z=2.59) in zone 10 was performed, resulting in an unsuccessful shot. In the rebound, the goal was scored in a situation of attacker(s) against goalkeeper.
When loosing (n=108, observed in 5 matches), teams tended to use behaviours of development of ball possession to get near to the opponent goal, except for the end of
Figure 7. Wide shot pattern when teams were
winning
Figure 8. Goal pattern when teams were
the attack with goal. In contrary to those of the winning teams, the wide shot patterns of the loosing teams (Figure 9) tended to be characterized by the use of development of ball possession behaviours. Teams tended to use the central mid-offensive zones to reach the opponent’s goal and, probably because of the numeral inferiority in these zones, the attack ended with no success.
On the other hand, opposing to the goal patterns found in the moments when teams were winning, the loosing moments were characterized by defence/attack transition behaviours. There were found two patterns of scoring goals, both finishing in the central offensive zone (11: z=3.15). The first pattern—illustrated with red arrows in figure 11—showed the utilization of the left wing, and the goal was performed after a positive cross. The second pattern—blue arrow in figure 10—presented the use of the central path, with the individual behaviours (DTcd: z=4.86; DTd: z=4.93) being chosen to reach the opponent goal.
While drawing (n=550, observed in 14 matches), teams tended to vary the offensive method to score a goal, performed positive crosses in transition state (z=5.33), and kept ball possession (z=4.57) once the ball reached the left offensive zone (z=2.23). In these contexts of match status (winning, loosing and drawing), the zone 11 tended to be used to shoot (z=2.57; z=3.15; z=4.09, respectively).
Regarding the occupation of the field, the loosing teams tended to play mainly in zone 8 (z=4.67), and finished the majority of the attacks with a shot without goal scored. On the other hand, the winning teams frequently used the offensive zones in the moments that preceded the shot, getting advantage of the opponent’s lower defensive balance. The tendency seemed to be that the team with a score disadvantage had a relative unbalance when attacking, allowing the opponents to penetrate in the defensive zone with transition behaviours. However, this study confirmed that the winning team tried not to allow the loosing team to enter in the defensive zone, pushing their offensive players to midfield zones.
4. Conclusions
The attempts to shot (goal scored, inside and outside shot) seem to be related with indirect ball possession recovery, in particular the free kick and throw-in. The direct recovery by interception appears to be linked to short duration attacks. Unsuccessful attacks occurred predominantly after a defensive action followed by pass, goal kick, or free kick.
Figure 9. Wide shot pattern when teams were
loosing
Figure 10. Goal pattern when teams were
It seems that the attacking patterns of successful teams participating in the EURO 2008 play-off were constrained by the match status. When defeated, the teams might become more offensive, even neglecting the defensive organization; whereas when winning, the foremost aim might consist in not allowing the opponents to get near the goal, and then using short duration attacks to achieve the opponent defensive zones.
In the EURO 2008 play-off games, the teams tend to assume a defending strategy and tried to perform their defending behaviours in the mid-defensive zones, in particular in the central zone (5). This tendency was mainly observed when the teams were winning, by moving defensive lines backwards, and by performing short duration attacks. Thus, teams tend to increase the aggressiveness when the opponent players achieve the mid defensive zones, trying to recover directly the ball to perform defence/attack transitions.
5. References
Anguera, M.T. (1991). Introducción. En M.T. Anguera (Ed.) Metodología observacional en la investigación psicológica (pp. 25-28). Barcelona: P.P.U.
Anguera, M.T.; Blanco, A.; Losada, J.L. (2001). Diseños observacionales, cuestión clave en el proceso de la metodología observacional. Metodología de las Ciencias del Comportamiento, 3 (2), 135-160.
Bakeman, R.; Gottman, J.M. (1989). Observación de la interacción: Introducción al análisis secuencial. Madrid: Ediciones Morata, S.A.
Bakeman, R.; Quera, V. (1995). Analyzing Interaction: Sequential Analysis with SDIS and GSEQ. Cambridge, UK: Cambridge University Press.
Barreira, D.; Garganta, J. (2007). Padrão sequencial da transição defesa-ataque em jogos de Futebol do Campeonato Português 2004/2005. Atas do 1º Congresso Internacional de Jogos Desportivos: Olhares e Contextos da Performance. Da iniciação ao rendimento. Porto: Centro de Estudos dos Jogos Desportivos, Faculdade de Desporto da Universidade do Porto [em CD-ROM].
Barreira, D.; Ribeiro, R.; Garganta, J.; Anguera, M.T. (2010). Book of Abstracts of the IV European Congress of Methodology: 27th Biennial Conference of the Society for Multivariate Analysis in the Behavioural Sciences - EAM-SMABS 2010 -, Potsdam, Germany.
Bate, R. (1988). Football chance: Tactics and strategy. In T. Reilly, A. Lees, K. Davids, & W. Murphy (Eds.), Science and football (pp. 293–301). London: E. & F.N. Spon.
Castellano Paulis, J. (2009). Conocer el pasado del fútbol para cambiar su futuro.
Acciónmotriz, Revista Digital, 2, Enero/Junio. [em linha]
http://www.accionmotriz.com/.
Ensum, R.; Pollard, R.; Taylor, S. (2005). Applications of logistic regression to shots at goal in association football. In T. Reilly, J. Cabri, & D. Araújo (Eds.), Science and football IV (pp. 211–218). London: Routledge.
Garganta, J. (1997). Modelação táctica do jogo de Futebol. Estudo da organização da fase ofensiva em equipas de alto rendimento. Dissertação de Doutoramento (não publicada). Porto: FCDEF-UP.
Garganta, J. (2001). Futebol e Ciência. Ciência e Futebol. Lecturas Educación Física y Deportes. Revista Digital, Ano 7, 40. [em linha] http://www.efdeportes.com/.
Grant, A.G.; Williams, A.M.; Reilly, T. (1999). Analysis of the goals scored in the 1998 World Cup. Journal of Sports Sciences 17, 826-827. Sport III. Ed: Hughes, M.D. Cardiff, UK: UWIC. 155-162.
Griffiths, D.W. (1999) An analysis of France and their opponents at the 1998 Soccer World Cup with specific reference to playing patterns. PhD thesis. University of Wales Institute Cardiff.
Hernández Mendo, A.; López, J.; Villaseñor, A.; Anguera, M.T. (2000). La metodología observacional en el deporte: conceptos básicos. Lecturas Educación Física y Deportes. Revista Digital, Ano 5, 24. [em linha] http://www.efdeportes.com/. Hook, C., Hughes, M.D. (2001). Patterns of play leading to shots in Euro 2000. In:
Pass.com. Ed: CPA.Cardiff: UWIC. 295-302.
Hughes, M.D. (2003). Notational analysis. In T. Reilly & M. Williams (Eds.),
Science and Soccer (pp. 245–264). London: Routledge.
Hughes, M.D.; Bartlett, R.M. (2002) The use of performance indicators in performance analysis, Journal of Sports Sciences 20, 739-754.
Jones, P. ; James, N. ; Mellalieu, S.D. (2004). Possession as a Performance Indicator in Soccer. International Journal of Performance Analysis in Sport, 4, 1, 98-102.
Lago, C.; Martin, R. (2006). Determinants of possession of the ball in Soccer. Journal of Sports Sciences, 25, 9, 969-974.
McGarry, T.; Franks, I. (2003). The science of match analysis. In V (Eds.) Science and Soccer (pp. 265 – 275). London: Routledge.
Romero Cerezo, C. (2000). Hacia una concepción más integral del entrenamiento en el fútbol. Lecturas Educación Física y Deportes. Revista Digital, Ano 5, 19. [em linha] http://www.efdeportes.com/.
Sackett, G.P. (1979). The lag sequential analysis of Contingency and Cyclicity in behavioural interaction research. In J.D.: Osofsky (eds.), Handbook of infant
development (pp. 623-649). New York: Wiley.
Silva, A.; Sánchez Bañuelos, F.; Garganta, J.; Anguera, M.T. (2005). Patrones de Juego en el Fútbol de alto rendimiento. Análisis secuencial del proceso ofensivo en el Campeonato del Mundo Corea-Japón 2002. Cultura, Ciencia e Deporte, 2 (1), 65-72.
Taylor, S.; Williams, M. (2002) A Quantitative analysis of Brazil’s performances.
Insight 3, 28-30.
Taylor, J. B.; Mellalieu, S. D.; James, N.; Shearer, D. (2008). The influence of match location, quality of opposition and match status on technical performance in professional association football. Journal of Sports Sciences, 26, 885–895.