QUANTITATIVE RISK MAPPING OF URBAN GAS PIPELINE NETWORKS USING GIS
P. Azari a*, M. Karimi a
a Faculty of Geodesy and Geomatics Engineering, K.N.- Toosi University of Technology, Tehran, Iran
([email protected]; [email protected])
KEY WORDS: Urban Gas Pipeline, Quantitative Risk, GIS, Risk Mapping
ABSTRACT:
Natural gas is considered an important source of energy in the world. By increasing growth of urbanization, urban gas pipelines which transmit natural gas from transmission pipelines to consumers, will become a dense network. The increase in the density of urban pipelines will influence probability of occurring bad accidents in urban areas. These accidents have a catastrophic effect on people and their property. Within the next few years, risk mapping will become an important component in urban planning and management of large cities in order to decrease the probability of accident and to control them. Therefore, it is important to assess risk values and determine their location on urban map using an appropriate method. In the history of risk analysis of urban natural gas pipeline networks, the pipelines has always been considered one by one and their density in urban area has not been considered. The aim of this study is to determine the effect of several pipelines on the risk value of a specific grid point. This paper outlines a quantitative risk assessment method for analysing the risk of urban natural gas pipeline networks. It consists of two main parts: failure rate calculation where the EGIG historical data are used and fatal length calculation that involves calculation of gas release and fatality rate of consequences. We consider jet fire, fireball and explosion for investigating the consequences of gas pipeline failure. The outcome of this method is an individual risk and is shown as a risk map.
1. INTRODUCTION
One of the important components of an urban infrastructure for transmission and distribution of gas is natural gas pipeline network. With growing modern cities, the usage of natural gas as a major source of energy has become more (Ma, Li et al. 2013). Natural gas network consists of three main parts:
• Gathering pipelines: The work that is done in this part is gathering and transmitting gas from production site to central collection point. It can be considered as an initial step in natural gas production.
• Transmission pipelines: This section of natural gas pipeline network undertake two tasks, firstly, it transmits gas in order to refine, process and store in the storage facilities and secondly, it transmits gas from storage facilities to consumers or distribution part.
• Distribution pipelines: Natural Gas Distribution Company is responsible for receiving gas from transmitting pipelines and distributing it to end users. The end users can be commercial consumers or residential ones.
Figure 1 shows the components of natural gas pipeline networks and their processes. The starting point of these pipelines is in production site and the ending point is in the house of consumers. Distribution pipelines pass in urban area and there are many people and building in the vicinity of them. Therefore occurring accident for distribution pipelines will cause damage to people and their property. On the other hand, the frequency of natural gas distribution networks accident is relatively higher than the other pipelines and it involves 80 percent of all the accidents that occur in natural gas pipelines (Amir-Heidari, Ebrahimzadih et al. 2014). In this paper we investigated the risk of distribution pipelines.
By increasing urbanization in large cities, the demand for natural gas as an important energy has increased. Growing demand has led to dense urban natural gas pipeline networks. So, it is important to design urban gas pipeline networks carefully (Ma, Cheng et al. 2013). It is obvious that any
infrastructure development in urban regions needs protection and maintenance. Therefore it is better to design various methods to prevent the probability of accident in urban natural gas pipeline networks. In order to better management of accidents and to precisely predict them, it is important to create risk map for pipeline network. Security of life and property in city life is another need for people. Therefore, the issue of safety and security of urban natural gas pipeline networks must be adequately investigated (Vianello and Maschio 2014). So risk mapping of urban natural gas pipeline networks is an important issue for risk analysis and preventing dangers for better management.
In this paper, a quantitative risk assessment for urban natural gas pipeline networks is implemented. In the second section of this paper, the history of risk assessment in gas pipeline networks is presented. The methodology and the steps to calculate risk and mapping are presented in section 3. In section 4 implementation results on a sample pipeline network are presented and in the last section conclusions are discussed.
2. RELATED WORKS
Many studies have been performed about risk analysis of urban natural gas pipeline networks. Jo and Ahn (2002) studied area of hazard that created from rupture of high pressure pipelines. In that study hazard distance determined between 20 meters for pipelines with low pressure and small diameter, to 300 meters for high pressure pipeline with large diameter (Jo and Ahn 2002). Jo, Park and Ahn analysed risk quantitatively and introduced fatal length and cumulative fatal length parameters. Results of their work were individual and social risk (Jo, Park et al. 2004). Jo and Ahn proposed a new approach for quantitative risk analysis and they applied the approach to a pipeline with one meter diameter and 50 bar pressure in depth of 130 cm from ground. In their study they used geometry of pipelines and population density for risk analysis (Jo and Ahn 2005). A comparison between quantitative and qualitative risk analysis has been done and implemented on small and large urban regions. In the quantitative approach many consequences are
considered so the outcome has a high precision and in the qualitative method many reasons of failure considered and it is more effective (Han and Weng 2011).
Ma et al. focused on a new method of quantitative risk assessment for urban natural gas pipeline networks based on grid difference of pipeline sections (GDPSs). They used graph concepts for creating relations between pipelines and stations. For any point of the region a number was determined as an individual risk and after that contour lines were created using ArcGIS. The results indicated that more pipelines produce more risk and it was shown in contour lines (Ma, Li et al. 2013). After that, they also presented a novel method for quantitative risk assessment for urban gas pipeline networks using geographical information systems. This method consists of three sections: calculation of failure rate, quantitative analysis model of accident consequences and determination of individual and societal risks. GIS has an important role in better management and controlling accidents (Ma, Cheng et al. 2013). In 2014, risk assessment for distribution gas network of Iran was performed. They focused on the consequences such as jet fire and explosion similar to Jo and Ahn (2005) and by the presented method, they determined individual and societal risk (Amir-Heidari, Ebrahimzadih et al. 2014).
Vianello and Maschio assess risk of distribution network of Italian, quantitatively. Their method consists of three parts: description of the system, risk identification, estimation of failure frequency and estimation of consequences. For the failure, they considered three cases as full, medium and small rupture and because of not penetrating of gas to ground level they ignored small case. They used PHAST software for simulation of accidents (Vianello and Maschio 2014).
A key problem with much of the literature in relation to risk analysis of urban natural gas pipelines is the question that how several pipelines influence on the risk value of an area. This quantitative, qualitative and hybrid. Qualitative risk assessment consists of indexing system. In this method, there are three index levels: causation index, an inherent risk index, a consequence index and their corresponding weights. The outcome of the qualitative method is a qualitative risk value and relatively presented. The quantitative method consists of a probability assessment, a consequence analysis and a risk evaluation. The outcome of this method is individual and societal risk (Han and Weng 2011). Generally, risk is defined as a mathematical function that calculates probability of a pipeline rupture and the magnitude of death (Ma, Li et al. 2013). Risk has various types such as individual risk, societal risk, economic risk and average rate of death. Individual risk and societal risk are the most important types of risk and we implemented a method to calculate individual risk for the entire pipelines in an urban pipeline networks.
Figure 1. Natural Gas Pipeline Network Components
In this paper we focus on qualitative risk assessment of urban
Figure 2. Process of quantitative risk assessment
3.1 Calculation of gas release rate
The process of leakage is an isentropic adiabatic expansion process and for any failure type, release rate from gas pipeline can be calculated by leakage models. Gas release rate from natural gas pipelines occur after rupture and it may cause dangerous accidents. In order for quantitative risk assessment of urban natural gas pipeline networks, gas release rate should be calculated. There are many methods for this calculation. In this paper we use the method presented by Ma et al. in 2013. For rupture case, Small Hole model is a model that is widely used in engineering. The amount of gas release depends on whether gas flow is sonic or subsonic. In order to determine that a gas flow is sonic or subsonic we can use equation 1 (Dong, Gao et al. 2003):
{
≤ + − �
> + − � �
(1)
Where P0 = environmental pressure in Pa
P1 = pressure inside the gas pipeline in Pa
k = adiabatic index (1.28 for natural gas) After choosing that gas has sonic or subsonic flow we can calculate gas release rate using equation 2:
{ There are numerous methods for assessment of failure rate such as AHP, Fault Tree Model, Event Tree Analysis and empirical formula based on historical observations (Ma, Cheng et al. 2013). For any of failure cause there is a failure rate that can be estimated by equation 3 (Amir-Heidari, Ebrahimzadih et al.
It should be considered that failure rate changes with changing the conditions along the pipeline and is not equal. Therefore, the first step for calculating failure rate is dividing pipeline to sections that has equal conditions. Parameters that have influence on varying condition are soil, design, age of pipeline, depth of cover and others. But considering all of these parameters in our calculation is not possible due to the lack of statistical data. So, we use historical data. In the Table 1, reasons of failure and failure rates are shown:
Failure corresponding rates of failure types (EGIG 2008)
3.3 Consequences of pipeline ruptures
Distribution network in urban region have a dense pipelines with high and low pressure. Because of flammable nature of gas in pipelines, there are many consequences that may occur in an accident. The consequences of natural gas pipeline accidents are usually: thermal radiation of fire and confined explosion.
3.3.1 Fire
One of the most important and most common adverse events that led to a serious danger to human life in the process industries is fire phenomenon. Fire contains a chemical reaction in which a combustible substance combines with oxygen and a huge amount of energy releases from this reaction. Fire phenomena include 4 types:
• Pool fire: as a result of leakage or rupture in gas pipeline, the substances in those pipelines drain outside. If the fluid is flammable, it begins to vaporize and form a gas cloud around leakage point. If this cloud fires, pool fire occurred.
• Jet fire: Drain fluid under pressure from a small opening on an equipment containing flammable materials, creates jet of fluid that when arrives to the ignition source, creates a continuous fire that is jet fire. Thermal radiation flux at a specific point is as equation 4 (Ma, Cheng et al. 2013):
= �� ℎ�
� ′ (4)
Where I = thermal radiation flux in W/m2
� = ratio of radiation heat to the heat released radiation flux at a specific point is as equation 5 (Ma, Li et al. 2013):
= � ∆�� � (5)
Where I = thermal radiation flux in W/m2 � = atmospheric transmissivity (value = 1) � = percentage of radiation for flammable gas (normally 90%)
∆ = combustion heat of natural gas in J/kg m = mass of the gas combustible gas cloud in kg
R = distance between the target and the center • Flash fire: Short-term ignitions of flammable gases
which are flammable limits are the sudden fire. The fire causes no formation of shock waves. The fire did not last long, more than a few tenths of a second.
3.3.2 Explosion
Pipeline rupture in an urban gas network has various consequences. Explosion can be considered as one of the important consequences. Pressure created by explosion can be extremely high and cause damage to people and buildings around the explosion point. Therefore its consequences should be considered in risk analysis of urban gas pipeline network. In the case of restricted and flammable vapor cloud that is mixed with air, the explosion is likely to occur. Using equation 6, we can calculate the volume of confinement that is created by explosion (Vianello 2011):
� = � × × �
+ ℎ (6)
Where L = length of pipeline
= internal diameter of pipeline ℎ = depth of pipeline under ground
3.4 Lethality rate calculation
For determining the danger for people surrounding the accident point that caused by pipeline rupture, we should calculate lethality rate for all of pipeline rupture consequences such as jet fire, fire ball and explosion. The effects of gas leakage (poisoning, thermal effect and explosion) on human beings can be shown by probability. The following probability unit function creates a relation between effects of pressure, heat and poisoning on people surrounding the accident point (Ma, Li et al. 2013):
= + ln (7)
Where a, b = empirical constant
D = dose of the load for a given exposure time
The value of is between 2 to 9 (HSE 2010). This value is a probability value and we need to present it in a percentage of lethality. Equation 8 converts probability value to a percentage of morality:
= √ �∫−∞− − (8)
Where = probability unit function
For classification of lethality we consider three levels for morality rate: 100% lethality, 50% lethality and 1% lethality. What is important to individual risk assessment is that all of consequences of pipeline accidents can be taken into account so that the result has a high degree of accuracy.
In 2013, Ma et al. received the following formula using the probability unit 7.33, 5 and 2.67 for calculation of radius of fatality 100%, 50% and 1%:
,99= . √ , , = . √ , , = . √ (9)
Where Q = mass flow rate of leakage in kg/s.
(�� ,99)
. = . ,
(�� , )
. = . ,
(�� ,)
. = . (10)
Where m = mass of gas combustible gas cloud in kg.
� � ,99
√ ��� = . ,
� � ,
√ ��� = . ,
� � ,
√ ��� = . (11)
Where � � is the TNT equivalent in kg that can be calculated by equation 12:
� �= ���∆� (12)
Where = mass of the gas involved in the explosion in kg ∆ = explosion heat of the gas in J/kg
� � = the calorific value of the standard TNT explosion source (4.2 MJ/kg)
3.5 Fatal length calculation
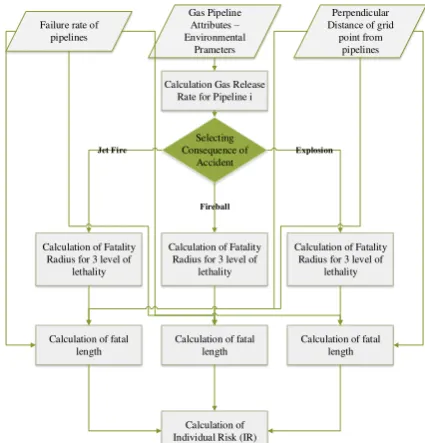
Fatal length is a weighted length in a pipeline that if an accident occur for that pipeline, person at a specific location will die because of that effect (Jo and Ahn 2005). There is a simple way to calculate fatal length. Parameters that is necessary for calculating fatal length is radius of fatality for each consequences of pipeline rupture and the perpendicular distance of specific point to pipeline. We represented the relation between those parameters in Figure 3:
Figure 3. Relation Between Pipeline Parameters and Fatality Circle
Fatal length in each lethality level for any consequence can be estimated by equations 13 (Ma, Li et al. 2013):
, −99= √( ,99) − ℎ , ,99− = √( , ) − ℎ ,
, − = √( , ) − ℎ (13)
Where i = consequence type of pipeline rupture
r = fatality radius
h = the perpendicular distance of specific point to pipeline
After calculation of fatal length for each lethality level, we should consider the average fatality of those zones. We use the following values and calculate final fatal length for every consequence similar to Ma et al. does in 2013:
� ℎ,
≈ , −99+ . ,99−
+ . , −
� ℎ,
≈ , −99+ . ,99−
+ . , −
� ℎ, �
≈ � , −99+ . � ,99−
+ . � , −
3.6 Individual risk assessment
Risk assessment is a process that
(https://www.ccohs.ca/oshanswers/hsprograms/risk_assessment. html):
• Identifies hazard and parameters of risk that create danger
• Analyses and evaluates the risk that is caused by the identified hazards
• Determines appropriate methods to get rid of those dangers or control them in case that they cannot be eliminated
In Figure 4 we show the main in risk assessment.
Figure 4. Risk Assessment Steps
There are various types of risk, such as individual risk, societal risk, economy risk and environmental risk. As stated in previous section we focus on individual risk assessment for natural urban gas pipeline network. Individual risk is defined as frequency of specific hazards that threat an unprotected person in a particular location (Jo and Ahn 2005). It is calculated by multiplying the probability of pipeline rupture by the magnitude of death at any particular position (x, y) using equation 15 (Ma, Li et al. 2013):
, = ∑ ∑ ∫ �−+ , (15)
Where � = denote accident scenario (x, y) = specific location
� = failure rate per unit length of the pipeline by accident scenario �
L = length of pipeline
= the lethality associated with accident scenario � ± = the ends of interacting section of pipeline In equation 16 we use fatal length that makes calculation easier (Ma, Li et al. 2013):
, = ∑ � ∑ � , (16)
Where � , = fatal length associated with accident scenario�.
4. RESULTS
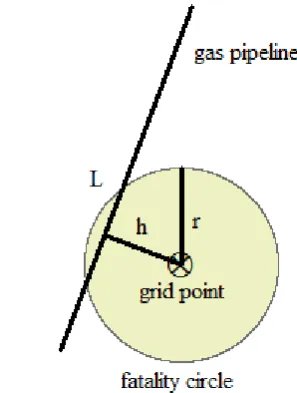
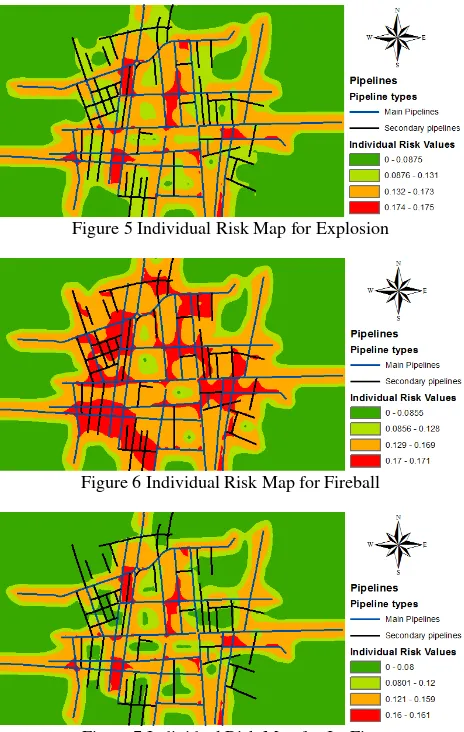
We proposed this approach in order to evaluate risk of urban gas pipeline on a small part of Tehran city. The pipeline networks consist of two types of pipeline: main pipeline with 12 inch diameter and secondary pipeline with 8 inch diameter. The gas pressure in these pipelines is different. The main pipeline has 250 psi pressure and the secondary pipeline 60 psi. In this paper we considered jet fire, fireball and explosion as the consequences of small failure of pipeline. The result of our processing is a risk map for pipelines that you can see in the Figure 5, Figure 6 and Figure 7. Blue pipelines are main ones and pipelines with black colour are secondary pipelines. In all of cases, we use regular grid points in order to determine risk of pipelines.
Figure 5 Individual Risk Map for Explosion
Figure 6 Individual Risk Map for Fireball
Figure 7 Individual Risk Map for Jet Fire hazard
identification
risk analysis
risk control
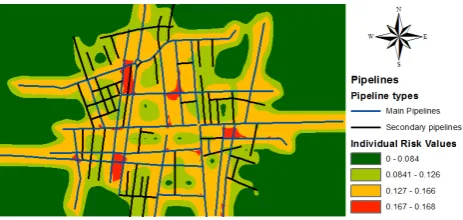
Figure 8 Individual Risk Map - All of Consequences
5. DISCUSSION AND CONCLUSION
Urban natural gas pipeline networks are vital infrastructure in large cities. The probability of occurring pipelines failure and accidents in these networks is high and therefor it is necessary to calculate risk of pipelines in order for urban planning and management. In this paper we implemented a quantitative method on a small part of the pipelines of Tehran.
All the analyses are investigated using regular grid points and the results showed that the risk value around pipelines is higher compared to the areas that are too far from pipelines. Our experiments are consistent with previous results (Jo and Ahn 2005, Ma, Li et al. 2013). In risk map for fireball we see that the values of risk are higher than the other two consequences and the values of explosion are higher than the jet fire. The probability of occurring accident when a rupture takes action is different for each consequence. This value for jet fire, fireball and explosion is 0.5, 0.3 and 0.2, respectively (Han and Weng 2011). Figure 8 shows individual risk for all of consequences by considering the probability of occurring accidents. It can be indicated that the risk around several secondary pipelines is less than around a single main pipeline. It showed that there is a relation between the pressure of pipelines and the value of risk around them. Main pipelines have larger pressure than secondary pipelines. So it is reasonable that the risk around main pipelines is larger than area of secondary pipelines. Although our work is about prediction of risk in region and visualization of it, but for validation of our result we can select several random point in our region and calculate risk value of those points by using software such as ALOHA or Phast and comparing outputs with our results of proposed method in this paper.
The current study was not specifically designed to consider direction of wind and all of consequences of accidents. Future studies on the current topic are therefore required in order to investigate the effects of all the consequences and also wind direction on risk value of urban natural gas pipeline networks.
REFERENCES
Amir-Heidari, P., M. Ebrahimzadih, H. Farahani and J. Khoubi (2014). "Quantitative Risk Assessment in Iran's Natural Gas Distribution Network." Safety Science and Technology 4: 59-72.
Dong, Y. H., H. L. Gao, J. E. Zhou and Y. R. Feng (2003). "Mathematical modelling of gas release through holes in pipelines." Chemical Engineering 92: 237-241.
EGIG, E. G. P. I. D. G. (2008). Gas pipeline incidents 7th report 1970-2007.
Han, Z. Y. and W. G. Weng (2011). "Comparison study on qualitative and quantitative risk assessment methods for urban natural gas pipeline network." Hazardous Materials 189: 509-518.
HSE (2010). "Methods of Approximation and Determination of Human Vulnerability for Offshore Major Accident Hazard Assessment." Health and Safety Executive.
Jo, Y.-D. and B. J. Ahn (2002). "Analysis of hazard areas associated with high-pressure natural-gas pipelines." Loss Prevention in the Process Industries 15: 179-188.
Jo, Y.-D. and B. J. Ahn (2005). "A method of quantitative risk assessment for transmission pipeline carrying natural gas." Hazardous Materials 123: 1-12.
Jo, Y.-D., K.-S. Park and B. J. Ahn (2004). "Risk assessment for a high-pressure natural gas pipeline in an urban area." Ma, L., L. Cheng and M. Li (2013). "quantitative risk analysis of urban natural gas pipeline networks using geographical information systems." Loss Prevention in the Process Industries 26: 1183-1192.
Ma, L., Y. Li, L. Liang, M. Li and L. Cheng (2013). "A novel method of quantitative risk assessment based on grid difference of pipeline sections." Safety Science.
Vianello, C. (2011). Risk analysis of gas distribution network, Università degli Studi di Padova.
Vianello, C. and G. Maschio (2014). "Quantitative risk assessment of the Italian gas distribution network." Loss Prevention in the Process Industries 32: 5-17.