THE DETERMINATION OF BUS SERVICE FREQUENCY
USING COST-BENEFIT APPROACH
Suwardo
Program Diploma Teknik Sipil Fakultas Teknik Universitas Gadjah Mada
Yogyakarta Tel: +62 274 7112126
Fax: +62 274 545193 [email protected]
Abstract
The determination of bus service frequency using cost-benefit approach is presented in this paper. This study was conducted in Malaysia where bus operators could provide feasible bus services using this method. The investment costs include all costs for vehicle, human resources, workshop, operational facilities, and supporting facilities while the benefits are expected from ticket fare collected and fuel subsidy. The primary data consists of passenger number, ticket fare, travel time, number of vehicles, and route length. The secondary data, provided by bus operators, include vehicle investment and operation and maintenance costs. The results indicate that this method is applicable and can be used by bus operators to provide feasible bus services with adequate frequencies.
Keywords: cost-benefit analysis, bus service, service frequency.
Abstrak
Penentuan frekuensi layanan bis dengan menggunakan pendekatan biaya-manfaat disajikan pada makalah ini. Penelitian ini dilakukan di Malaysia di mana operator bis dapat menyediakan layanan bis yang layak dengan menggunakan metode ini. Biaya investasi mencakup biaya-biaya untuk kendaraan, sumber daya manusia, bengkel, fasilitas operasional, dan fasilitas pendukung. Manfaat diharapkan datang dari tarif tiket yang dikumpulkan dan subsidi bahan bakar. Data primer terdiri atas jumlah penumpang, ongkos tiket, waktu tempuh, jumlah kendaraan, dan panjang rute. Data sekunder, diperoleh dari operator bis, meliputi biaya investasi kendaraan serta biaya operasi dan pemeliharaan. Hasil penelitian menunjukkan bahwa metode ini merupakan suatu metode yang dapat diterapkan dan dapat digunakan oleh operator bis untuk memberikan layanan bis yang layak dengan frekuensi yang memadai.
Kata-kata kunci: analisis biaya-manfaat, layanan bis, frekuensi layanan.
INTRODUCTION
Providing of bus service frequency in compliance with the business interest of bus operators and adequate bus provision to serve passenger demand is an important decision. Bus transport planners have to consider the characteristics public transport (bus system) demand and vehicle, operational, and route characteristics in determining bus service frequencies. At the same time, the bus operators have to provide the bus service operation and management based on the cost and benefit analysis of their investments. These investments include vehicle, human resources, workshop and operational facilities, and
CORE Metadata, citation and similar papers at core.ac.uk
other supporting equipment. Benefit is expected solely from ticket fare collected from passengers using the bus service.
The aim of this study is to determine bus service frequency based on the cost-benefit analysis. The work involves field data investigation, analysis, and recommendation. The study was performed by collecting field data from bus service operation. Data were collected from bus service at a corridor operating at end-to-end terminal route. The field data were collected through on board survey using GPS equipment, for recording vehicle trips, and data sheets for recording passengers’ boarding and alighting. The primary data consist of number of passengers, ticket fare, travel time, number of vehicle, and route length. The secondary data include vehicle capital cost, operation and maintenance cost obtained from bus operators.
The numbers of passenger get on and get off the bus is an important parameter for measuring the trip productivity of bus service. This is generally known by the loading profile of passengers resulted from on board survey such as boarding and alighting passengers. The passengers' loading profile shows the number of passengers on board over the time when the bus is running along the route.
Some principles characteristics of bus service are explained in the following section. These characteristics are cycle time, frequency and headway, number of fleets, load factor, and number of passengers.
Cycle time or time of circulation is thorough time for bus operation covering travel time plus layover time. Travel time is calculated from the length of route divided by the operating speed. A minimum layover and recovery time is provided at the end of each route time. The cycle time is formulated as:
(
t 1 t 2) (
t1 t2)
CT = R + R + + andV d
tR = 60× (1)
with: CT = cycle time (minutes)
tR1, tR2 = route time or travel time (two-way trip)
t1, t2 = layover or recovery time or terminal time (minutes) tR = route time or travel time (minutes)
d = route length (km)
V = operating speed (km/h)
Frequency is calculated from headway data (minutes per bus). Frequency equals to 60 divided by the headway and measured in unit of bus per hour. Since headway is measured in minutes per vehicle, then the frequency (vehicles/hour) is given as:
H
F = 60 (2)
with: F = frequency (bus/hour)
Given that:
P = number of passengers per hour
C = bus capacity (number of seats), and
F = frequency (bus/hour), thus: F C P LF × = or LF C P F × = (3) and C H P LF × × = 60 or P LF C H = 60× × (4)
The number of vehicles or fleet needed to serve a route can be determined based on the route time (Khisty et al. 2003). Thus:
v F H CT K × = (5)
Since Fv = 1 (as vehicle availability is 100%), the number of fleets is:
LF C P CT F F CT K v × × × = × × = 60 60 (6)
with: CT = cycle time (minutes)
H = headway (minutes)
Fv = factor of vehicle availability (for 100% of vehicle availability, Fv = 1) K = number of fleets (to meet with LFmax = 1.0 the value of K must
be rounded up) C = capacity of bus
LF = load factor
Load factor is the ratio between number of seats used by passengers and vehicle capacity available during bus traveling along the route. Load factor is calculated as:
K C P CT C P H C F P LF × × × = × × = × = 60 60 (7)
with: LF = load factor
H = CT/K is headway (minutes)
P = number of passengers per hour
C = capacity of vehicle (seats)
K = number of fleets (bus).
The number of passengers increases proportionally with respect to the capacity of bus, the number of fleets, and load factors. The number of passengers also depends on headway and cycle time, and can be explained as:
CT LF K C H LF C C F LF P= × × = 60× × =60× × × (8)
with: P = number of passengers per hour
H = headway (minutes)
K = number of fleets
CT = cycle time (minutes)
C = capacity of bus
LF = load factor
Cost-Benefit Analysis approach is simply applied for determining the minimum frequency of bus service. This concept can be used to evaluate the minimum requirement the bus service which is reasonable to be operated. Bus operation is beneficially operable if the net benefit is more than or equal to zero, as indicated by the formula:
0 ≥ − C B or B C ≥1 (9) with: B = Benefits C = Cost
The revenue of bus operation is gained from the ticket fare. The revenue may also come from baggage charges. In this study, the baggage charge is not taken into account for the benefit calculation. Bus service investment cost and operating cost are calculated in cost per pass-km (Ringgit Malaysia).
The operating cost per bus per day (Perak Roadways Sdn. Bhd, 2007) is RM 1,204. The calculation has considered the government subsidy (fuel price and tax). Over one year, with seven buses per day in operation, the total cost is RM 3,070,000. For practical purpose, the capital cost per passenger-kilometer and the operator’s revenue from the ticket fare are incorporated in calculation. According to Schoon (1996), the capital cost per passenger-kilometer can be estimated using the following formula:
2 length corridor passenger hour peak total cost capital km -passenger per cost capital × × = (10)
Also, the revenue of bus service is calculated as follows: 2 length corridor fare ticket frequency capacity bus factor load revenue= × × × × × (11)
DATA AND ANALYSIS
The data from on-board survey include route characteristics, bus operation characteristics, number of passengers boarding and alighting, and load factor. Parameters and other variables in operation characteristics are then determined using equations presented in previous section.
To estimate the capital cost and operating cost (cost per passenger kilometer), the equation 10 is applied WITH the unit cost of bus was taken into account in the calculation. The unit cost of bus, about RM 205,000.00, was provided by the bus operator (Perak Roadways Sdn. Bhd., 2007). With this unit cost, the total capital cost and operating cost are calculated. The operating cost is estimated in cost per passenger kilometer (daily basis). Three main cost components included are the way (lane) length, fleets, bus shelter, and stations. The calculation of the total capital cost and operating cost for this regular bus service incorporates data of main cost components, estimation, assumptions, and operating characteristics or conditions. The length of corridor (route) is 82.6 km. The operation characteristics include the average operating speed, traveled distance, cycle time, and number of fleets. For practical purpose, the number of fleets is added with 10% for spare. Bus service facilities are projected to have a number of bus shelters and bus stations. There are seven bus stations such as Ipoh, Taman Maju, Bota Kanan, Ayer Tawar, Sitiawan, Manjung, and Lumut. For the year 2007, using the given data, the estimated capital cost and the cost per passenger kilometer in this corridor are RM 5,140,000 and RM 110.92, respectively.
The revenue of bus service was estimated using equation 11. A number of factors were also taken into account, such as route length, capacity, average speed, traveled distance, cycle time, number of bus (the fleet includes 10% of spare), and load factor. Service frequency (headway) was considered as input and the number of passengers was
simulated subject to yearly growth estimation. The annual growth rate for the bus passengers was assumed to be 1.3%. The cycle time was calculated with an assumption that the layover time at terminal was 10 minute in each terminal. In this study, the ticket fare was RM 8.40 per person per trip. The number of bus (fleets) was calculated with a condition that the vehicle availability is 100% (Fv = 1). For 2007, the calculated revenue
was RM 5,449,419.
Table 1 The Number of Passengers Based on Maximum Growth Scenario
No. Year Passengers per
day Code r = 1.30% 1 2007 3,927 2007_F1.5_P3927 2 2009 4,030 2009_F3_P4030 3 2010 4,082 2010_F3_P4082 3.1 2011 4,135 3.2 2012 4,189 3.3 2013 4,243 3.4 2014 4,299 4 2015 4,354 2015_F3_P4354 4.1 2016 4,411 4.2 2017 4,468 4.3 2018 4,527 4.4 2019 4,585 5 2020 4,645 2020_F3_P4645 6 2022 4,767 2022_F4_P4767 7 2025 4,955 2025_F4_P4955 8 2030 5,285 2030_F4_P5285
RESULTS AND DISCUSSION
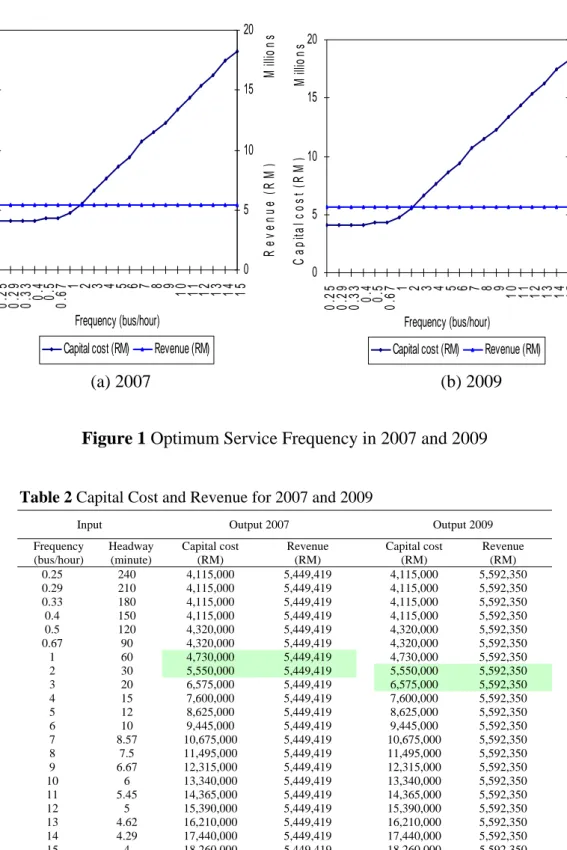
With the bus service frequency for each lane as input which, the capital cost and revenue can be determined and presented in Table 2. As the number of buses increase followed by additional facilities and other required attributes, the total capital cost obviously will also increase. On the other hand, the revenue is assumed constant because the number of passengers is assumed to be constant even when the frequency changes as it is simulated (Figure 1). It is shown that there is an intersection point at which the minimum frequency is needed to provide the bus service operation based on the cost-benefit analysis. From Table 2, for instance, by interpolation method the service frequency is obtained. In 2007, bus was operated at service frequency of one per hour (headway 60 minutes) during off peak session and two per hour (headway 30 minutes) during peak period as being highlighted.
In 2009, as the passengers increase, some new buses and additional service frequency are needed. The frequency of bus service changed to be two buses per hour (headway 30 minutes) during off peak period and three buses per hour (headway 20 minutes) during peak period, as illustrated in Table 2.
(a) 2007 (b) 2009
Figure 1 Optimum Service Frequency in 2007 and 2009
Table 2 Capital Cost and Revenue for 2007 and 2009
Input Output 2007 Output 2009
Frequency Headway Capital cost Revenue Capital cost Revenue
(bus/hour) (minute) (RM) (RM) (RM) (RM) 0.25 240 4,115,000 5,449,419 4,115,000 5,592,350 0.29 210 4,115,000 5,449,419 4,115,000 5,592,350 0.33 180 4,115,000 5,449,419 4,115,000 5,592,350 0.4 150 4,115,000 5,449,419 4,115,000 5,592,350 0.5 120 4,320,000 5,449,419 4,320,000 5,592,350 0.67 90 4,320,000 5,449,419 4,320,000 5,592,350 1 60 4,730,000 5,449,419 4,730,000 5,592,350 2 30 5,550,000 5,449,419 5,550,000 5,592,350 3 20 6,575,000 5,449,419 6,575,000 5,592,350 4 15 7,600,000 5,449,419 7,600,000 5,592,350 5 12 8,625,000 5,449,419 8,625,000 5,592,350 6 10 9,445,000 5,449,419 9,445,000 5,592,350 7 8.57 10,675,000 5,449,419 10,675,000 5,592,350 8 7.5 11,495,000 5,449,419 11,495,000 5,592,350 9 6.67 12,315,000 5,449,419 12,315,000 5,592,350 10 6 13,340,000 5,449,419 13,340,000 5,592,350 11 5.45 14,365,000 5,449,419 14,365,000 5,592,350 12 5 15,390,000 5,449,419 15,390,000 5,592,350 13 4.62 16,210,000 5,449,419 16,210,000 5,592,350 14 4.29 17,440,000 5,449,419 17,440,000 5,592,350 15 4 18,260,000 5,449,419 18,260,000 5,592,350 0 5 10 15 20 0. 2 5 0. 2 9 0. 3 3 0. 4 0. 5 0. 6 7 1 2 3 4 5 6 7 8 9 10 11 12 13 14 15 M ill io n s Frequency (bus/hour) Ca p ita l co st ( RM ) 0 5 10 15 20 M ill io n s R e v e nu e (RM )
Capital cost (RM) Revenue (RM)
0 5 10 15 20 0. 25 0. 29 0. 33 0.4 0.5 0. 67 1 2 3 4 5 6 7 8 9 10 11 12 13 14 15 M ill ions Frequency (bus/hour) Ca p ita l c o s t (RM ) 0 5 10 15 20 M ill ions R e v enue (RM )
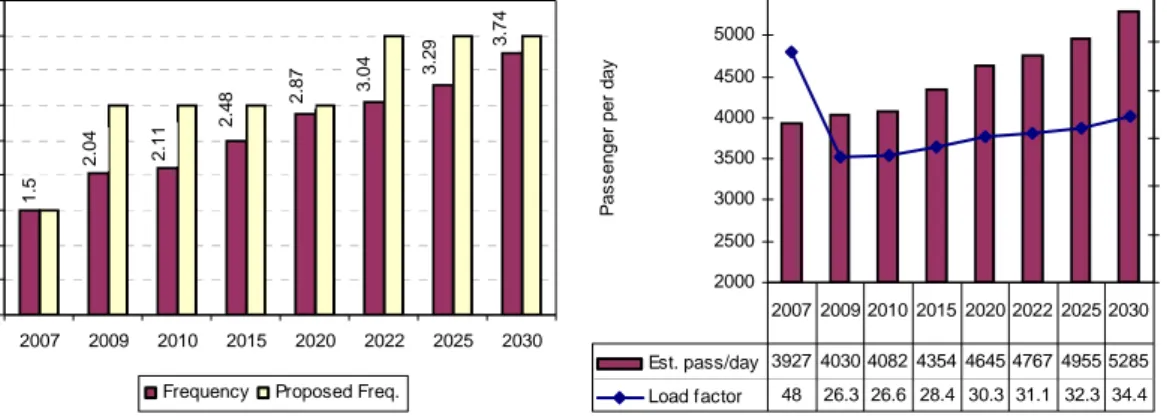
Table 3 summarized the predicted service frequency with respect to the estimated number of passengers over the period 2009-2030. During 2007-2008, the existing bus service was operated regularly and it was viewed as the base condition.
From the analysis performed, it is found that the frequency of two buses per hour (during off peak session) and three buses per hour (during peak session) are feasible over the period 2009-2021. In 2022, the bus operator has to change its service frequencies to be three and four buses per hour during off peak and peak session, respectively. This prediction is described in Figure 2.
Table 3 Capital Cost and Revenue Change Against To Frequency
No. Year Code Frequency (bus/hour) Headway (minute) Capital cost (RM) Revenue (RM) 1 2007 2007_F1.5_P3927 1 60 4,730,000 5,449,419 2 30 5,550,000 5,449,419 2 2009 2009_F3_P4030 2 30 5,550,000 5,592,350 3 20 6,575,000 5,592,350 3 2010 2010_F3_P4082 2 30 5,550,000 5,664,510 3 20 6,575,000 5,664,510 4 2015 2015_F3_P4354 2 30 5,550,000 6,041,959 3 20 6,575,000 6,041,959 5 2020 2020_F3_P4645 2 30 5,550,000 6,445,774 3 20 6,575,000 6,445,774 6 2022 2022_F4_P4767 3 20 6,575,000 6,615,071 4 15 7,600,000 6,615,071 7 2025 2025_F4_P4955 3 20 6,575,000 6,875,954 4 15 7,600,000 6,875,954 8 2030 2030_F4_P5285 3 20 6,575,000 7,333,889 4 15 7,600,000 7,333,889 (a) (b)
Figure 2 The Changes Of Service Frequency Required Regarding To Number Of Bus Passengers
1.5 3. 74 3. 29 3. 0 4 2. 87 2. 48 2. 1 1 2. 0 4 0 0.5 1 1.5 2 2.5 3 3.5 4 4.5 2007 2009 2010 2015 2020 2022 2025 2030 F requ enc y ( bus /hour )
Frequency Proposed Freq.
2000 2500 3000 3500 4000 4500 5000 5500 P a s s e ng er pe r da y 0 10 20 30 40 50 60 L oad f a c to r (% ) Est. pass/day 3927 4030 4082 4354 4645 4767 4955 5285 Load factor 48 26.3 26.6 28.4 30.3 31.1 32.3 34.4 2007 2009 2010 2015 2020 2022 2025 2030
CONCLUSION
This study intends to use the cost-benefit analysis to determine bus service frequencies from the bus operator’s point of view. The optimum service frequency is obtained in compliance with predicted number of passengers and operating cost. The results show that the cost-benefit analysis is applicable for the determination of bus service frequency. With this method, the operator can provide adequate number of buses and feasible bus services.
ACKNOWLEDGEMENT
The author would like to thank University Teknologi PETRONAS for the financial support and the permission to use library facilities provided to him. He also would like to thank the Perak Roadways Sdn. Bhd for the valuable information and support in data collection. He also appreciates his colleagues and reviewers for the useful comments, ideas, and discussions.
REFERENCES
Banks, J. H. 2002. Introduction to Transportation Engineering. 2nd ed. New York, NY: McGraw- Hill.
Blonn, J. Carlson, D., Mueller, P. and Scott, I. 2006. Transport 2020 Bus Rapid Transit: A
Cost Benefit Analysis, Madison Area Bus Advocates. Madison, WI.
Cascetta, E. 2001. Transportation Systems Engineering: Theory and Methods. Amsterdam: Kluwer Academic Publishers.
Khisty, C. J. and Lall, B. K. 2003. Transportation Engineering: An Introduction. 3rd ed. Upper Saddle River, NJ: Prentice-Hall, Pearson Education, Inc.
Kov, M., Fukuda, D., and Yai, T. 2009. Optimizing Frequency of Bus Service in
Mixed-traffic Urban Street. Proceedings of the Eastern Asia Society for Transportation
Studies. Surabaya.
Litman, T. A. 2009. Transportation Cost and Benefit Analysis: Techniques, Estimates and
Implications. 2nd Ed. Victoria Transport Policy Institute (www.vtpi.org/tca,
accessed on 4 January 2009).
Papacostas, C. S and Prevendouros, P. D. 2001. Transportation Engineering and Planning. 3rd ed. Upper Saddle River, NJ: Prentice-Hall, Inc.
Schoon, J. G. 1996. Transportation Systems and Service Policy: A Project-Based
Introduction. New York, NY: Chapman and Hall, International Thomson
Suwardo, Napiah, M, and Kamaruddin, I. 2007, Bus Operation Characteristics and
Performance Indicators as a Preliminary Study in Promoting Public Transport.
Proceeding of Sidang Kebangsaan Ke-4 Kejuruteraan Awam. University Sains Malaysia. Langkawi.
White, P. R., Turner, R. E, and Mbara, T. C. 1992. Cost Benefit Analysis of Urban Minibus