VMware vCenter Operations
Manager Essentials
Explore virtualization fundamentals and real-world
solutions for the modern network administrator
Copyright © 2014 Packt Publishing
All rights reserved. No part of this book may be reproduced, stored in a retrieval system, or transmitted in any form or by any means, without the prior written permission of the publisher, except in the case of brief quotations embedded in critical articles or reviews.
Every effort has been made in the preparation of this book to ensure the accuracy of the information presented. However, the information contained in this book is sold without warranty, either express or implied. Neither the author, nor Packt Publishing, and its dealers and distributors will be held liable for any damages caused or alleged to be caused directly or indirectly by this book.
Packt Publishing has endeavored to provide trademark information about all of the companies and products mentioned in this book by the appropriate use of capitals. However, Packt Publishing cannot guarantee the accuracy of this information.
First published: February 2014
About the Author
Lauren Malhoit
has been in the IT field for over 10 years. She's currently a technical virtualization architect specializing in virtualization and storage in the datacenter. She has been writing for TechRepublic and TechRepublic Pro for a few years as well as for VirtualizationSoftware.com. As a VMware vExpert, Cisco Champion, EMC Elect, and PernixPro member, Lauren tries to stay involved in the community. She also hosts a bi-weekly technology podcast called AdaptingIT (http://www.adaptingit.com/). Lauren has been a delegate for Tech Field Day (http://techfieldday.com/) several times as well.For my mom, the wisest person I know. Without your
About the Reviewers
in Ontario, Canada. He has held all sorts of IT posts over the last 15 years including Network Technician, Systems Administrator, Programmer Analyst, Web Developer, and Systems Engineer in all sorts of different verticals, from sales to consulting. Currently, he works as a systems analyst supporting the education market near his home in Belleville, Ontario. Mike has always had an intense passion for sharing his skills, solutions, and work with various online communities, most recently focusing on virtualization communities. He is an avid blogger at blog.mwpreston. net and participates in many discussions on Twitter: @mwpreston. It's his passion for sharing within the virtualization community that has led to Mike receiving the vExpert award for 2012 and 2013. Mike has presented at VMworld, VMUGs, and various virtualization conferences on numerous occasions, both as a customer and an overall evangelist, and has published different whitepapers and articles for various tech websites. His most recent publication was Troubleshooting vSphere Storage, Packt Publishing, November 2013. His commitment to giving back to the community has resulted in his most recent venture of becoming a Toronto VMUG co-leader. He is a VMware Certified Professional in Datacenter Virtualization on both Versions 4 and 5 of vSphere as well as a VCAP5-DCA.
Chris Wahl
has acquired over a decade of IT experience in enterprise infrastructure design, implementation, and administration. He has provided architectural and engineering expertise in various virtualization, data center, and private-cloud-based engagements while working with high-performance technical teams in tiered data center environments.Chris holds well over 30 active industry certifications, including the rare VMware Certified Design Expert (VCDX #104), and is a recognized VMware vExpert. He also works to give back to the community as both an active Master user and moderator of the VMware Technology Network (VMTN) and as a leader of the Chicago VMware User Group (VMUG).
www.PacktPub.com
Support files, eBooks, discount offers and more
You might want to visit www.PacktPub.com for support files and downloads related to your book.
Did you know that Packt offers eBook versions of every book published, with PDF and ePub
files available? You can upgrade to the eBook version at www.PacktPub.com and as a print book customer, you are entitled to a discount on the eBook copy. Get in touch with us at [email protected] for more details.
At www.PacktPub.com, you can also read a collection of free technical articles, sign up for a range of free newsletters and receive exclusive discounts and offers on Packt books and eBooks.
TM
http://PacktLib.PacktPub.com
Do you need instant solutions to your IT questions? PacktLib is Packt's online digital book library. Here, you can access, read and search across Packt's entire library of books.
Why Subscribe?
• Fully searchable across every book published by Packt
• Copy and paste, print and bookmark content • On demand and accessible via web browser
Free Access for Packt account holders
Table of Contents
Preface 1
Chapter 1: Introduction to vCenter Operations Manager
7
What is vCenter Operations Manager? 7
Benefits of troubleshooting with vC Ops 10
Benefits of capacity planning with vC Ops 12
Feature comparison of versions 13
What is vCenter Operations Manager Suite? 14 Licensing versions 14
Using vC Ops with other solutions 16
Summary 16
Chapter 2: Installing vCenter Operations Manager
17
System requirements 18
Preparing the vCenter Server 18
Deploying the vCenter Operations Manager's vApp 22
Configuring the vCenter Operations Manager 25
Chapter 3: Dashboards and Badges
39
Chapter 4: Troubleshooting Our Virtual Environment with vCenter
Operations Manager
67
Drilling in on major and minor badges 68
Troubleshooting VM performance 78
Troubleshooting network performance 88
Troubleshooting slow applications 89
Finding future risks 91
Summary 94
Chapter 5: Capacity Planning with vCenter Operations Manager
95
What-if scenarios 102
Hardware changes 104
Virtual machine changes 112 Hardware changes and virtual machine changes 116
The capacity analysis page 119
Summary 124
Chapter 6: Reports
125
Built-in reports 126
Understanding built-in reports 128
Virtual Machine Capacity Overview Report 129 Oversized Virtual Machines Report 134
Capacity Inventory and Optimization Report 135
Average/Peak Datastore Latency and Throughput Report 136
Health Score and Alert Trend Report 137
VM Average and Peak Storage Access Latency Report 139
Custom Reports 140
Summary 143
Chapter 7: vCenter Configuration Manager
145
Basic vCenter Configuration Manager installation 145VCM basic configuration 149
Connecting VCM and vC Ops 155
Using VCM metrics within vC Ops 163
Compliance 163 Change events 166
Summary 167
Chapter 8: Log Insight
169
Installing and Configuring Log Insight 169
Using Log Insight with vC Ops 178
Summary 186
Chapter 9: VMware Horizon View Integration
with vCenter Operations Manager
187
High-level installation overview 188
Configuring the Event database 190
Connecting Horizon View with vC OPS 191
Using vC OPS for View 198
Practical uses 202
Chapter 10: vCenter Infrastructure Navigator
207
Overview of Infrastructure Navigator 208
Using VIN with vC OPS 212
Summary 216
Chapter 11: EMC Storage Analytics
217
Deploying ESA 217
Using ESA with vC OPS 220
Summary 225
Preface
VMware vCenter Operations Manager is a solution that allows VMware
administrators to understand and troubleshoot their current and future VMware implementations. Upon initial investigation, vCenter Operations (vC Ops) seems like a fairly intuitive solution. However, with its many options for navigation and a very robust feature set, vC Ops can be slightly intimidating, especially if it's not something we use often.
vCenter Operations Manager Administration Essentials is a book designed to help administrators not only to install and configure vC Ops, but also learn how to use it to troubleshoot issues within the virtual environment, reclaim wasted space, understand what anomalous behavior is in their specific environment, easily monitor the VMware environment, and even produce consistent and strategic reports
to help drive educated decision making within the IT department. The focus of VMware vCenter Operations Manager Essential is to help administrators become more comfortable with the vC Ops product and use it to its full potential.
Although this book comprehensively covers how to install and use vCenter Operations Manager, it is not meant to be a replacement for any documentation published by VMware.
What this book covers
Chapter 1, Introduction to vCenter Operations Manager, provides a quick overview of how vCenter Operations (vC Ops from here on) is able to learn our environment and gives us many benefits for both troubleshooting and capacity planning.
Chapter 3, Dashboards and Badges, is where we really dive into vC Ops by getting familiar with the vC Ops GUI and dashboards. We learn about major and minor badges and how the different scores can affect our environment.
Chapter 4, Troubleshooting Our Virtual Environment with vCenter Operations Manager, is great for those of us who keep having trouble within our VMware environment. Perhaps there are some nagging issues about why we keep running out of memory resources, or maybe we have several VMs running slowly, and we'll be able to drill down and see if there's actually a problem with the data stores they're all connected to.
Chapter 5, Capacity Planning with vCenter Operations Manager, allows us to get into capacity planning here. We'll look at reports that will tell us whether our VMs are undersized or oversized as well as show what-if scenarios if we're looking to add more VMs to our environment. vC Ops takes out the guesswork for us.
Chapter 6, Reports, allows us to dive into the reports. vC Ops offers both canned reports, which can be very helpful, as well as custom reports, which can be specific to our environment. These reports are great to turn in to our director, CIO, or CTO.
Chapter 7, vCenter Configuration Manager, explains vCenter Configuration Manager. In this chapter, we'll go through an introduction to vCCM as well as how to install it. There will be real-life scenarios to help users understand the advantages gained when adding in compliance and change management using vCCM.
Chapter 8, Log Insight, explains what VMware Log Insight is and how this new product will integrate with vC Ops. It will also allow us to dive into the application and operating system to see where problems are and keep track of events. We will go through an installation of Log Insight as well as some common use cases.
Chapter9, VMware Horizon View Integration with vCenter Operations Manager, will also show us how advantageous it can be to use vC Ops within our VMware View 5.2 environment. Think of all the resources VMware View uses. It would be great to be able to drill in and pinpoint that we're having a storage issue before we start messing around with all the virtual machines.
Chapter10, vCenter Infrastructure Navigator, helps users to automatically discover application services and map them out within our environment. We can then hook it into vC Ops to get metrics on an entire application automatically.
What you need for this book
The reader should have an understanding of VMware vSphere as well as access to a VMware vSphere environment and vCenter Operations Manager. Access to VMware vCenter Configuration Manager, VMware Horizon View, VMware Log Insight, and EMC VNX storage array are also helpful but not absolutely necessary. A knowledge of the following will also be helpful for understanding this book:
• ESXi Hosts • VMware vCenter • Datastores/luns • Virtual Networking • Light Physical Networking
• Compute (CPU, Memory) within a virtual environment
In order to implement the solutions in the book, you'll need the following:
• VMware vSphere environment with at least one host • Datastore
• vCenter Installed
• Access to the vCenter network
• Downloaded version of vCenter Operations Manager
It would also be useful to have:
• VMware Horizon View
Conventions
In this book, you will find a number of styles of text that distinguish between different kinds of information. Here are some examples of these styles, and an explanation of their meaning.
Any command-line input or output is written as follows:
su – admin
URLs will appear as:
http://kb.vmware.com/selfservice/microsites/search.do?language=en_US& cmd=displayKC&externalId=2046591
New terms and important words are shown in bold. Words that you see on the screen, in menus or dialog boxes for example, appear in the text like this: "Clicking the Next button moves you to the next screen."
Warnings or important notes appear in a box like this.
Tips and tricks appear like this.
Reader feedback
Feedback from our readers is always welcome. Let us know what you think about this book—what you liked or may have disliked. Reader feedback is important for us to develop titles that you really get the most out of.
To send us general feedback, simply send an e-mail to [email protected], and mention the book title via the subject of your message.
You can reach the author, Lauren Malhoit, on her site www.adaptingit.com under the Contact page as well as via her Twitter handle @Malhoit. If you are looking to read more from Lauren, she also writes for TechRepublic.com
(http://www.techrepublic.com/) and SoftwareVirtualization.com.
Customer support
Now that you are the proud owner of a Packt book, we have a number of things to help you to get the most from your purchase.
Downloading the color images of this book
We also provide you a PDF file that has color images of the screenshots/diagrams used in this book. The color images will help you better understand the changes in the output. You can download this file from: https://www.packtpub.com/sites/ default/files/downloads/6961EN_coloredimages.pdfErrata
Although we have taken every care to ensure the accuracy of our content, mistakes do happen. If you find a mistake in one of our books—maybe a mistake in the text or the code—we would be grateful if you would report this to us. By doing so, you can save other readers from frustration and help us improve subsequent versions of this book. If you find any errata, please report them by visiting http://www.packtpub. com/submit-errata, selecting your book, clicking on the erratasubmissionform link, and entering the details of your errata. Once your errata are verified, your submission will be accepted and the errata will be uploaded on our website, or added to any list of existing errata, under the Errata section of that title. Any existing errata can be viewed by selecting your title from http://www.packtpub.com/support.
Piracy
Piracy of copyright material on the Internet is an ongoing problem across all media. At Packt, we take the protection of our copyright and licenses very seriously. If you come across any illegal copies of our works, in any form, on the Internet, please provide us with the location address or website name immediately so that we can pursue a remedy.
Please contact us at [email protected] with a link to the suspected pirated material.
We appreciate your help in protecting our authors, and our ability to bring you valuable content.
Introduction to vCenter
Operations Manager
In this chapter, we'll cover:• What is vCenter Operations Manager? • Benefits of troubleshooting with vC Ops • Benefits of capacity planning with vC Ops • Feature comparison of different versions • What is vCenter Operations Manager Suite? • Licensing versions
• Using vC Ops with other solutions
What is vCenter Operations Manager?
As we can see from the following screenshot, the default dashboard offered in all the licensed versions of vC Ops above the Foundation edition holds a lot of information. We get an idea of the three major metrics, or badges, that vC Ops tells us about: Health, Risk, and Efficiency. Dashboards such as the one shown in the following screenshot can quickly give us an insight into the things that are happening in our environment and visually point out any errors or issues inside our environment that may have cause for more investigation.
For an alarm like this, a rigid or static trigger threshold may be appropriate. Memory should really not be at more than 95 percent utilization for too long. In that situation, we would want to add more memory to that host or perhaps vMotion VMs to another host if we have that option. However, what if we have an alarm triggered for CPU usage of a virtual machine? If this virtual machine consistently runs with high CPU usage because it's supposed to, vCenter will still tell us there is a critical error. Since vC Ops actually learns our environment, it will tell us that this is not an anomalous behavior, and we may not need to worry about it. Another example of when this is useful would be if a VM routinely runs scheduled tasks that cause CPU or memory utilization to be high for a brief time during the day. vCenter alarms would trigger everyday or every time this happens. vC Ops will learn this behavior, thereby reducing the barrage of alerts admins receive everyday. vC Ops will still tell us that CPU usage runs high via badge scores, such as Workload or Stress, so we don't have to worry about missing information either.
Benefits of troubleshooting with vC Ops
As mentioned in the previous section, vC Ops actually understands our environment and reports anomalous behavior. This is not to say that if a VM is always using 100 percent of its storage, vC Ops will let you know that. It will also let you know how long it's been happening and the normal range for the VM. If we zoom in on the
Workload badge, as shown in the following screenshot, we can see that it shows CPU usage, memory usage, disk I/O, and network I/O. The blue bar above each graph shows the normal range for each metric. If it were outside of that normal range, that would indicate anomalous behavior. This can be very helpful for
troubleshooting because now we can dive in and see what's changed. From vCenter Server alone, we can see some historical data, and we can see real-time metrics, but without doing some pretty intense math, we won't know the normal range.
Another benefit you get with vC Ops, which you wouldn't necessarily see in the vCenter Server performance data, is that you can check whether VMs are undersized. An undersized VM is a virtual machine with less compute resources than it actually needs to perform properly. Again, this is not based solely on random peaks or bursts, but rather on historical and present data that has been run through algorithms, and vC Ops lets us know how much compute the VM should be assigned for it to work efficiently. So, for instance, if an application is running slow, or even slow at particular times in a day consistently, we would be able to open vC Ops, highlight the affected machine, and then go to the Planning tab. From here, we can see how much time this VM has been running without enough memory or CPU, for example, and it will also tell us how much additional resources it recommends.
One of the most interesting benefits is when you pair vC Ops with vCenter
The following example, found under the Relationships section of the Environment
tab, gives you a different view. It shows only the components that are in a direct relationship with the component you have selected in the left-hand side pane.
Benefits of capacity planning with vC
Ops
The great thing about vC Ops is that it actually has a lot of capacity management features in every view and dashboard. No matter where we've drilled in, we'll be able to see information about how much storage or compute resources are left. However, most of the capacity planning features can be easily found under the
Planning and Analysis tabs. Here, we can find information, not only on how much
storage or compute a VM is using, but also what the trends have been for future planning purposes. For instance, you might be able to see that a datastore has been losing about 2 GB of free space every week. If the datastore is 1 TB, vC Ops can estimate when we might run out of space.
Much like the undersized VM analysis discussed in the troubleshooting section, we also have data on which VMs are oversized. Many times applications and/or application owners will ask for outrageous amounts of CPU or memory. There are also cases where we perform physical to virtual migrations to convert a physical server to a virtual server and we just leave the original amount of compute resources even if it's not necessary. vCenter Server is never going to tell us that we've over allocated memory or CPU, for example, to a VM. vC Ops, however, will show us a full report on the VMs on which we can reclaim compute resources and how much can be reclaimed. This may seem like a small reclamation of resources, but let's say we have 100 VMs, and 25 of them are using an extra two vCPUs, then we can essentially reclaim 50 vCPUs as well as reduce CPU contention within our environment.
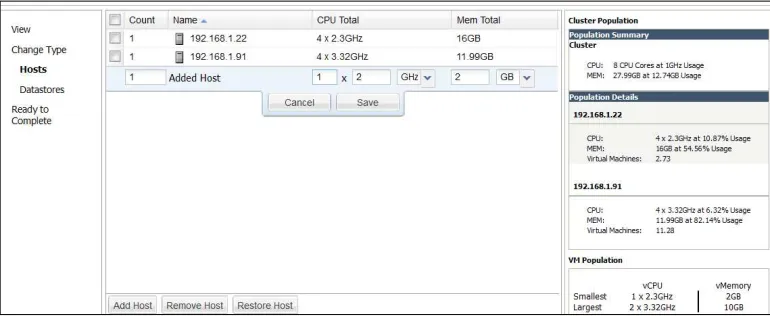
Probably the most interesting benefit of using vC Ops to do our capacity planning is the what-if scenarios. We can actually click on a link under the Planning tab to pull up a what-if scenario wizard. For example, with this wizard, we can manually input the number of VMs we want to add, and it will output how that will affect the current environment. We can also have it automatically input the variables using trending analytics for our environment. vC Ops will take a look at the average size of our VMs, analyze any pertinent historical data, and then tell us if we have enough resources to add a certain amount of VMs. This is an incredibly powerful tool that most normal admins would not be able to replicate through the use of a simple script with simple mathematics.
Feature comparison of versions
What is vCenter Operations Manager Suite?
The main focus of this book is vC Ops although we do get into some of the other components of the suite. VMware has historically sold the current components of the suite separately. Recently though, they've decided it would be beneficial to bundle them in a suite. The components of the suite are as follows:• vCenter Operations Manager • vCenter Configuration Manager • vFabric Hyperic
• vCenter Infrastructure Navigator • vCenter Chargeback Manager
For more information on these components, check the documentation given on VMware.com.
Licensing versions
Not every component comes in the vC Ops suite. It depends on which version of the license has been purchased. The versions of the suite are as follows:
• Foundation • Standard • Advanced • Enterprise
The versions of the vC Ops suite should not be confused with the versions of the vCloud suite. They are separate items.
As of Version 5.7, vC Ops licensing works in the following way. This chart was taken directly from the VMware.com website.
By looking at the chart, Foundation and Standard look the same, as do Advanced and Enterprise. However, that's not actually the case. Currently the Foundation license is included in every version of vCenter. It does not give us insights using historical data, it only reports in real time. However, it will store the historical data if we decide to upgrade the license at a later date. Foundation doesn't really offer much by way of capacity planning either. It's really more of just an extension of our current alerts that we get from vCenter.
Using vC Ops with other solutions
There are several plugins or adapters to vC Ops that will extend our monitoring capabilities even further. One plugin that came out in the last year or so is vCenter Operations Manager for Horizon View. Through the use of vC Ops adapters, we can now monitor our Horizon View virtual desktop implementations. This gives us custom dashboards that give us a lot more insight than we've had before. If you've ever run a VDI environment, you must be well aware that the ability to pinpoint our problem areas quickly is a necessity. Other VMware solutions it will connect to are vCloud Director 1.5.0 and above.
There are several storage adapters for vC Ops as well. Among these are the EMC Smarts Adapter, EMC Symmetrix Adapter, EMC VNX Adapter, and NetApp Adapter. There are also several monitoring solutions that vC Ops can connect with to get a view of your whole environment, such as HP BAC Adapter, HP SiteScope Adapter, IBM Tivoli Monitoring Adapter, and Microsoft SCOM Adapter. It will also plug into Oracle Enterprise Manager to help you monitor your Oracle databases.
In most cases, after connecting vC Ops to these adapters, we need to browse to a custom site other than our vC Ops management site. These sites will have custom dashboards set up with information from the product(s) we are connected to. At present, this information does not really affect the regular vC Ops dashboards. You will still see the same information there that you would see if you did not have the adapters installed and collecting data.
Summary
In this chapter, we discussed what vCenter Operations Manager is. It's a solution that allows us to monitor our virtual infrastructure as well as plan for future capacity issues that may arise. We then discussed some of the benefits of troubleshooting our virtual environments as well as doing some capacity planning with the help of vCenter Operations Manager. It's also important to keep in mind that there are several different versions of vC Ops, and it is possible to get it in a bundle with vCenter Configuration Manager, vFabric Hyperic, vCenter Infrastructure Navigator, and vCenter Chargeback Manager. Finally, we went over some of the other hardware and software solutions that we can integrate into our vCenter Operations Manager and/or suite, such as storage arrays and other third-party monitoring solutions.
Installing vCenter
Operations Manager
The vC Ops manager can be installed in a few different ways. In this chapter, we'll go with the most common way, that is, by using the vApp provided by VMware. It is also possible to download and install the product on a Windows or Linux server. The vApp comes preconfigured with the resources we need and does not require the use of another Windows or Linux license as well. In this chapter, we will cover the basic installation procedures and considerations such as the ones in the following list:• System requirements
• Preparing the vCenter Server
• Deploying the vCenter Operations Manager's vApp • Configuring the vCenter Operations Manager • vC Ops' custom dashboard
System requirements
The requirements mentioned in this section are all for vCenter Operations Manager 5.7.1. These requirements are subject to change in future releases of vC Ops. The software requirements are as follows:
• ESX/ESXi Version 4.0 and above • vCenter Server 4.0 Update 2 and above
• If using the vCenter Infrastructure Navigator, it must be at least Version 2.0 • The software should work on the following browsers:
° Apple Safari 6
° Google Chrome 24 and 25 ° Internet Explorer 8.0 and 9.0 ° Mozilla Firefox 18 and higher
• The hardware requirements depending on the size of our virtual environments are as follows:
° 4 to 16 vCPUs
° 16 to 34 GB of memory
° Add disk space as needed via extra hard drives
For more information on adding disk space to the UI VM or Analytics VM within the vC Ops vApp please, see the
VMware KB article 2016022 at http://kb.vmware.com/ selfservice/microsites/search.do?language=en_US &cmd=displayKC&externalId=2016022.
Preparing the vCenter Server
It's assumed that we have vCenter running at this point, and it has been configured with proper networking and storage to access it via our network and access VMs residing on the physical hosts. To begin with, we need to make sure the ports are open between vCenter and vC Ops. If there aren't firewalls in between, then you can skip this part. The ports to open are as follows:
• 443: HTTPS for GUI management
• 1194: Tunnel between UI VM and Analytics VM
Port22
-As you may know, vC Ops comes as vApp that consists of two virtual machines: the (UI) User Interface VM and the Analytics VM. The UI VM is what allows us to access the information, and the Analytics VM is the data collector that contains a Postgres database to store all the information. Because vC Ops comes as vApp, we can do some interesting things with IP addresses on vCenter to automatically assign IPs to our virtual machines within the vApp. We do this using IP pools, which are called network protocol profiles in newer versions of vSphere. We do not need IP pools to automatically assign IPs to vApp VMs. We are able to statically assign IPs to each VM during the setup. However, IP pools are necessary to power on the vC Ops vApp.
The following steps will help you in configuring an IP pool:
1. Open your vSphere Web Client and log in to the client. 2. Click on Networking.
3. Select the vSwitch you'd like to configure it on. If you have multiple vSwitches, you most likely to put it where your management or production VMs reside.
4. Select the Manage tab.
5. Select Network Protocol Profile as shown in the following screenshot:
6. Click on the link icon to associate a network protocol profile, and select the network you'd like to associate it with. Click on Next.
7. Give it a name, for example, Network Protocol Profile – vC Ops. Click on
Next.
8. Configure the networking as shown in the following screenshot. Remember we need to use network settings that are appropriate for our network. Since we're going to assign static IPs to virtual machines, there's no need to use the network protocol profile to hand out IP addresses. Be sure to leave the
Enable IP Pool option unchecked. This will allow us to configure fixed IPs on
9. Configure IPv6 if necessary.
10. Add the name of your domain in the Set other network configuration portion of the wizard.
11. Click on Finish unless you need to configure advanced settings such as
proxy information.
This is all we have to do to get vCenter ready before the deployment of our vApp. IP pools can be somewhat confusing, and while it's not in the scope of this book to define them, it would be beneficial to understand how they work. VMware's website, as well as several independent blogs, contain all the information we would ever want to know about IP pools.
Refer to the following URLs for information about IP pools:
• http://wahlnetwork.com/2012/12/11/understanding-and-configuring-vsphere-ip-pools/
• http://www.yellow-bricks.com/2012/02/02/creating-an-ip-pool-for-vc-ops/
Deploying the vCenter Operations
Manager's vApp
Now we can move on to deploying the vC Ops app. To deploy the vC Ops vApp, the steps are as follows:
1. Open your vSphere Web Client and log in to it.
2. Go back to the Home page and then click on the Hosts and Clusters
inventory view.
3. Right-click on the host where you'd like to place the vApp and select Deploy OVF Template.
4. From the Select Source page, click on the local file and browse to the location
from where you downloaded vC Ops. You may need to change the file type to .ova to find it. Click on Next.
5. Click on Next through the next few pages of the wizard to accept the EULA
(end-user license agreement).
6. Choose the name for your vApp and where to place it. Then, click on Next. 7. Under the Select Configuration page, select the proper configuration (see the
following information box) for your environment and click on Next.
The three configuration options are as follows:
Small: This configuration is used when the number of VMs is less than 1500 and requires 4 vCPUs and 16 GB of memory for the vApp
Medium: This is used when the number of VMs is between 1500 to 3000 and requires 8 vCPUs and 25 GB of memory for the vApp
Large: This configuration is used when the number of VMs is more than 3000 and requires 16 vCPUs and 34 GB of memory for the vApp
How we choose between these three options really depends. If we don't have many computer resources, and it's just not possible for us to give
up 16 vCPUs and 34 GB of memory, then we should probably pick the small or medium configuration. Remember that 16 vCPUs, even though
it's split between two VMs within the vApp, is going to cause some CPU
contention. We want to make sure we have the necessary hardware to
allow for whichever option we choose. Also, if we're concerned about growing larger in the future but don't have the necessary resources now,
8. On the Select Storage page, select the data store where you would like to place the vApp as well as whether you would like to make it thin or thick provisioned. If you're using this in a production environment, it's recommended to make it thick provisioned.
9. On the Setup Networks list, select the network you'd like to put the VMs on.
We'll also make the IP allocation Static – Manual so the VMs always have the same IP address. Click on Next.
10. Set the time zone in which you're located in the Customize Template page. 11. Then expand the Networking Properties on this page and input the IP
addresses you'd like to allocate to each VM as shown in the following screenshot. Click on Next.
The deployment might take several minutes to complete. We can see the status in the
Configuring the vCenter
Operations Manager
The following section explains the process of configuring vCenter Operations Manager. Let's look into the Initial Setup Wizard.
We can now perform the initial setup of vC Ops by browsing to the IP address of the UI VM. We are presented with the Initial Setup Wizard where we can assign credentials and authenticate it to vCenter. The first screen is where we fill in the
Virtual Appliance Details. This will have our vCenter information as shown in the following screenshot:
On the Change Passwords screen, we'll configure passwords for both the admin and
If this is your first installation, the Import Data screen will probably not be important. If you had historical data from some vCenter extension, you could import it here. If this is not the first installation, we would also be able to import information from previous installtions of vC Ops here. Also, the next screen, Linked VC Registration, may or may not apply to your environment. If you're connecting your vCenter servers from different sites using Linked Mode, then you can supply that information here. Keep in mind that if a firewall exists between the vCenter servers, vC Ops will need to have access to both the sites. When we click on Finish at the end of the wizard, we will see a window with a status bar that tells us vC Ops is registering with vCenter. When that's done, we'll see a screen similar to the one that follows:
Take note that at the top-right corner, under where it says vCenter Operations Manager Administration, it reads Version 5.7.1; however, under licensing
information, it still reads 5.6. That's normal! They use the same licenses, so don't be
The horizontal tab navigation allows us to configure many different aspects of our vC Ops appliance. Let's start with the Registration page. The Registration Status is purely informational, but if we move down to the vCenter Server Metrics Profile, you'll see there is a drop-down menu that lets you choose either Balanced Profile or Full Profile. This is a new feature of vC Ops 5.7. If you are monitoring several objects, you may want to choose Balanced Profile because it offers a reduced set of metrics allowing you to monitor even more. On this page, you can also add new vCenter servers and register vC Ops with vCenter Configuration Manager Registration.
On the SMTP/SNMP page, we can enable and enter our mail server settings if we wish to receive alerts from vC Ops via e-mail. We can also enable and enter the information for SNMP to allow vC Ops to send alerts via SNMP traps to third-party monitoring solutions such as NAGIOS or Zenoss.
The SSL tab is pretty self-explanatory. If we want to use a certificate from a certificate
authority, such as Thawt or Verisign, we can import the .pem file here. Otherwise, we will just be using the self-signed certificate that gets created automatically during the installation. Using a signed certificate will work, but it's not secure. Most self-signed certificates have unreasonably long expiry dates, making it is much easier to perform a man-in-the-middle attack.
For more information on man-in-the-middle attacks, please see this article:
http://en.wikipedia.org/wiki/Man-in-the-middle_attack
For more information on configuring a CA certificate for vC Ops, please
refer to VMware KB 2046591:
On the Status tab, we have a lot of useful tools and information for troubleshooting our vC Ops environment. We can start and stop the vC Ops service as well as see the status information on the service. We can also download diagnostic information in the event in which we need to further investigate issues with our vC Ops product.
The Update tab allows us to browse to an updated vC Ops file and import it. Then
Assigning licenses
As you may recall, we are still working with the Foundation license mode that does not give us any of the historical data and capacity information we need. In this section, we'll go through assigning proper licensing for vC Ops using the vSphere Web Client.
The steps for assigning the license are as follows:
1. Open the web client and go to the Administration page.
2. Then click on Licenses under Licensing and click on the Solutions tab. We should see our vCenter Operations Manager on this page now that we have it registered as shown in the following screenshot:
3. Click on the Assign License Key button. We can click on the drop-down menu on this pop-up page to select Assign a new license key.
4. Enter your license key and any description you'd like to give it here.
5. After you click on OK, it will populate other fields with proper information
That's pretty easy. What happens if we need to change the license because we
upgraded to the next version though? We can click on Assign License Key again and give it a new key. Don't expect it to be updated right away though. This is updated every 20 minutes or so. You can either go grab some coffee or perform the following manual update procedure:
1. Open the console on your UI VM and log in with the root username. 2. Type the following command to switch to the admin user:
su – admin
3. Run the following command to update your license:
vC Ops-admin license update
4. You can see if it's updated by looking at the SKU, using this command:
vC Ops-admin license sku
5. Then type exit and restart the service using the following command:
service vC Opsadmin restart
For more information on updating vC Ops licenses manually, you can check out the VMware KB article KB2042698—vCenter Operations Manager 5.x license status fails to update after the license is applied:
http://kb.vmware.com/selfservice/microsites/search. do?language=en_US&cmd=displayKC&externalId=2042698
Really, at this point, we have a basic usable vCenter Operations Manager solution. It will automatically start collecting data for all of the resources in your vCenter environment. Again, keep in mind that vC Ops will learn about our environment, so we need to give it at least a couple of weeks, if not a month, to collect and analyze the data before we start going through it.
Managing policies
Managing group types
We can add, delete, and modify group types as well. A group type is any collection of objects with a common configuration or feature. For instance, the Location group type would be a collection of objects at the same site. The default group types are shown in the following screenshot. We can only modify and delete group types that are managed by the user though.
Managing display settings
For more information on deploying and configuring
vC Ops custom dashboard
The vC Ops custom dashboard is the part of vC Ops that a lot of users either miss or think that it is only necessary when you use add-ins. However, this can be utilized to create custom dashboards, alerts, add user permissions, create groups, create super metrics (user-defined combinations of metrics), and all sorts of other good stuff.
On the home screen, we have several tabs with groups that are automatically
populated. Under the VM Performance tab, we get lists of the top VM resource hogs as shown in the previous screenshot. Under the Troubleshooting tab, we can see the symptoms of VMs by their relationships as well as Interesting Metrics. We can also see VM, Host and Cluster Utilization, Datastore Performance, Datastore Space,
Heatmaps, Alerts, and Host Memory. A lot of this information will also be visible via the regular dashboard that we saw earlier.
Configuring user permissions
We have an option to add administrators, operators, and users by default while still in the custom dashboard. To add users, perform the following steps:
1. Hover over the Admin tab in the custom dashboard. 2. Click on Security.
3. Select a group from the left-hand side of the pane; in this case, we'll choose
Administrators.
4. In the User Accounts pane, we'll either click on the icon to add a user which
will allow us to create a local user as an admin, or we can click on the icon to import a user from LDAP. If you're adding the user from LDAP, you will need to add an LDAP (or Active Directory) host and configure it with the parameters appropriate for your environment. Then you'll sync it and select a user that is populated in that group.
5. Once we press OK, our user will be added as follows:
Adapters
Adapters are hooks that we can use to display resources within vC Ops. We can use adapters to connect to other things in VMware as well as third-party solutions. You won't need to worry about this for a basic setup of vC Ops though. Most of the VMware adapters are in there by default such as the Infrastructure Navigator adapter,
vCenter adapter, and so on as (shown in the next screenshot). Here, we can edit these adapters or delete them as well. To manage adapters, follow the given steps:
1. Hover over the Environment tab and then hover over Configuration.
3. Highlight the adapter you would like to modify or delete:
Resources
Resources are essentially objects that we're monitoring with vC Ops. Most of our resources will be discovered and populated automatically upon the initial setup. However, in the case that resources have embedded adapters or no adapters, we will need to manually discover or set them up.
To add resources, follow these steps:
1. Hover over the Environment tab and click on Environment Overview. 2. Click on the List tab.
4. From the drop-down menu, select a Collector, Adapter Kind, Adapter Instance, Discovery Info, and Resource Kind:
5. Then click on OK to start the discovery.
6. If there are any resources available, you can add them here.
7. If you need to manually add a resource, just click the icon to the left of
Discover Resources called Add Resource.
We can assign resource tags to our resources that will then allow us to group resources in our custom dashboard by the tag it's been given. Resource tags are user-defined labels that we assign. Resources can also be grouped by location using Google Maps keys if you have different physical sites you're monitoring. In that case, we would assign Google Maps keys to our resources and it would automatically know where these resources are physically located.
There are several configuration possibilities and very advanced
options we can set up using custom dashboards. For a full list along
Upgrading vC Ops
Upgrading vC Ops is a fairly simple procedure due to its vApp architecture. When a new version of vC Ops comes out, we simply need to download the .pak file that comes from VMware and apply that to our vApp.
To upgrade vC Ops, complete the following steps:
1. Log in to your admin portal by browsing to https://<IP_Address>/admin and providing the admin credentials.
2. Click on the Update tab.
3. Click on Browse to find the .pak file you've downloaded from VMware.com. 4. Follow the wizard to complete the upgrade.
5. Upgrade your license if necessary. For some of the minor releases, this is not necessary. You will need to check the VMware documentation for information on this.
Keep in mind you'll need to wait for about 20 minutes for the license to upgrade. Until that has completed, or you've manually upgraded the licenses using the steps mentioned earlier in this chapter, some of the features of the new version may not be available.
Summary
In this chapter, we went over some of the prerequisites for setting up vCenter Operations Manager as well as preparing vCenter before the actual deployment of the vC Ops vApp. We needed to set up IP pools in order to make all the networking on our vApp work properly. We then deployed the vApp and went through the basic configuration to get a working vC Ops solution.
After going through the initial configuration, we went through some of the highlights of the vC Ops custom dashboard, which is only found in the Enterprise version. We can customize many options in vC Ops using the Enterprise version that allows administrators to easily monitor high priority hardware and applications.
Dashboards and Badges
When talking with people, I've found that one of the reasons they get frustrated while using vCenter Operations Manager is they're not sure how to navigate it and don't understand what all the dashboard objects mean. This chapter will focus on defining all that and will give practical examples of how we might use it in our environment.We'll cover the following topics in this chapter:
• Navigation overview • Major badges
Navigation overview
The vC Ops UI, which we can get to either by browsing to https://<IP_ Address_of_UI_VM or via the plugin in vCenter, by default looks as shown in the following screenshot:
To enable a plugin within the vSphere client, we must click on Plug-ins
and then on Manage Plug-ins. Then, click on the link that says Download and install. Once the plug-in is installed, we can click on the Home page within the vSphere client to get to the solution.
As we can see on the left, there is a standard tree structure with World at the very top while in the Hosts and Clusters view. World just refers to our entire environment. It is then broken down from vCenter to all the containers underneath it as we would actually see via the vCenter client. While still in the left pane, we can click on the group's icon to show various groups we set up to connect our objects. We can create new groups by clicking on Actions in the center pane and then selecting
Create New Group. Then finally, we have the Datastore view that also shows us a
tree with World at the top. Then, the group is broken down and eventually, all of our datastores including local datastores are broken down by vCenter.
On the right-hand side, we see a summary of alerts: Critical, Immediate, Warning, and Info. It will show the alerts specific to the object we have selected from the tree
on the left-hand side. It also shows a summary of the Health, Risk, and Efficiency
The Dashboard tab
At the center of the UI, we have the main pane with several tabs: Dashboard,
Environment, Operations, Planning, Alerts, Analysis, and Reports. The previous screenshot shows us a snapshot of what's going on with the entire environment because we have the World object selected and we're currently under the Dashboard
tab. If we were to select another object such as a host or VM, it would show us the same information particular to that object. The Dashboard tab is basically an overview of what our environment looks like. It shows the three major badges and the scores for the object. These are called widgets. Widgets are the objects that make up dashboards.
The Environment tab
The Environment tab has four subtabs under it: Overview, Scoreboard, Members, and Relationships. As shown in the following screenshot, the Overview tab shows us all of the objects, sometimes called skittles, and their status according to the minor badge that is selected: Health, Workload, Anomalies, Faults, Risk, Time, Capacity,
In this screenshot, Health is selected and we see a few green skittles and a yellow one next to Clusters. If we were to click on the Workload minor badge, then we would see the skittles change to reflect the workload scores for each object.
The Scoreboard tab gives us a lot of the same information in more detail. We can easily filter this view by clicking on the FILTER OBJECTS at the top.
In the CustomOverview, we can select which major badge we'd like to show
information for; in this case, Health is selected. On the vertical axis, we have
Anomalies and on the horizontal axis is Workload. The little green circles represent objects within our environment that we can hover over and even click on to drill down into details about the object. Under the Members List, we see small graphs for each object and what their minor badge score is along with what it's looked like in the past. We can actually click on the objects here if we like. Doing this will take us to the Operations tab and show us the details for the object we clicked on.
Lastly, we have the Relationships subtab under the Environment tab. This is a really interesting picture of the environment because we can click on an object and see which other objects are directly related as well as see their statuses. In the following screenshot, I've selected a VM to show a more interesting view of the Relationships
tab. Therefore, we can see it's in the Discovered virtual machine folder, which host it's on, and the two datastores it's connected to (datastore1 is the local datastore on the physical host).
The Operations tab
The Operations Tab has three subtabs: Details, Events, and All Metrics. By default, we see the Details tab that shows a detailed overview of the object's health. The Operations tab is highly geared toward the health of the objects in our environment and can be very helpful when we're trying to troubleshoot issues.
Next, we have the Events subtab shown as follows. The Events tab is just as the name suggests: it literally shows us events on the object we've selected (in this case a physical host) at the bottom of the screen. By default, these would be the events vCenter has generated. However, with other products from the vC Ops suite, such as vCenter Configuration Manager or Log Insight, we can see configuration changes to the guest operating system as well. We can also pick whether we'd like to see a graph representing Health in general, Workload, Anomalies, or Faults. The graph changes depending on what we've selected, the events are all the same.
We then have the All Metrics subtab, which is pretty self-explanatory. It shows us pretty much anything and everything we could want. On the left, we use the
Metric Selector to choose the metric we'd like to look at and on the right it shows
us graphs correlating to that metric. The following screenshot shows some of the metrics available:
The Planning tab
The Planning tab is really interesting. Again, we have three subtabs: Summary,
Under the Objects section, we see the Trend and Forecast graph as well as Extended Forecast and Time Remaining. As has been noted before, vC Ops learns our
environments. So, if we're averaging adding a VM or two every week, it will learn that information and present us with a forecast that tells us how much capacity we have remaining. As we can see under Time Remaining, I have 29 days until I reach capacity within my cluster if I continue adding the same amounts of VMs. Keep in mind, if this is a new environment for us, the trending might change once this has all settled down. So, you want to keep vC Ops running and come back to it in a few weeks when it's learned that we're no longer moving at the same pace. In the Resources section, it will actually break down our time remaining by compute resources such as CPU and memory. This way, we'd be able to tell if we just need to add more memory.
The Views subtab allows us to look at specific things as well. For instance, we'd be
The Alerts tab
The Alerts tab shows us actual alerts for the objects we've chosen in the tree on the
left. We can also navigate to this screen by clicking on the Alerts in the right pane of the vC Ops UI. See the following screenshot. It shows us how critical the alert is along with the resource that the alert refers to and a description of the alert.
We might ask ourselves why we'd want to use these alerts when vCenter server gives us alerts as well. However, vCenter uses hard thresholds and doesn't know what's normal for a VM for instance. vCenter just lets us know if we're using 85% of our CPU. vC Ops will actually learn what our peak hours are, so it can let us know if for some reason our CPU utilization is high during a non-peak time. This information would be more helpful generally because it's anomalous behavior. This is what's known as dynamic, instead of static, thresholding.
The Analysis tab
The Analysis tab lets us analyze various things depending on the object we've
In the screenshot shown, I've selected the Cluster object on the left and chosen the
Description—For each datastore, which VMs have the most wasted disk space?. The preceding heat map shows my datastore, iSCSI1, as well as three of my VMs. They're all green because I don't really have a lot of wasted space. I can choose any one of the default descriptions and if it applies to the object I have selected, it will show a heat map for that if applicable using the colors green, yellow, orange, and red. Green is basically good and red is bad. We can also click on the Customize
button at the top right to create our own descriptions.
The Reports tab
Major badges
vC Ops uses badges to report on various aspects of how our environment is performing. There are three major badges that are made up of minor badges. The major badges are Health, Risk, and Efficiency. They can be green, yellow, orange, or red depending on the score we get in each category and the thresholds that are set up. Again, green is good and red is bad.
The Health badge
The Health badge measures the health of our environment or an object within our environment. As depicted in the following screenshot, it will show us issues we may need to deal with immediately. It uses several advanced algorithms to calculate the minor badges that all come together to create the overall Health score. The minor badges associated with Health are Workload, Anomalies, and Faults.
If we've selected a VM or something lower on the tree, to the left, it will show us a
Health Trend graph instead of a weather map. This is displayed in the following screenshot. It still shows the health over the last six hours. According to this example, the health of my VM has been pretty close to 100 for the last six hours.
By default, if we have a score between 75 and 100, vC Ops considers the object to be normal and displays its score with a green background. If we have a health score of 50-74, there may be some problems and we're essentially being warned that we might need to pay attention to the object; it will appear yellow in the weather map. A score of 25-49 means it is getting worse and the health badge will be orange. Finally, a score under 25 is something we need to pay attention to immediately. The health badge will be red in this case.
We can get a low health score due to several reasons. For instance, the CPU
The Risk badge
The Risk badge warns us of future issues. The scoring is the opposite of Health in that the lower score the better. By default, 0-49 means there aren't really problems in the future. The risk badge will be green in this case. Next, 50-74 means there may be potential for risk and 75-99 means risk is a little more imminent. If we have a score of 100, we are most likely to experience an issue in the near future. The minor badges associated with Risk are Time Remaining, Capacity Remaining, and Stress.
On the Dashboard tab, we will see the Risk widget as shown in the previous screenshot. It also gives us a quick view of the Risk Trend graph. The example shown in the previous screenshot is the Risk Trend graph for my World object. The graph shows the last seven days. As we can see in the previous example, my environment is experiencing more and more risk, most likely due to a lack of resources since this is my home lab. Much like the Health badge correlated with the
Operations tab, the Risk badge correlates with the Planning tab. If we click on the
Risk badge, it will take us directly to the Views subtab under the Planning tab.
The Efficiency Badge
The Efficiency Badge tells us whether we're using our resources in the most optimized way. Like the Health score, the higher the Efficiency score the better. If
we have a score of 0, we're essentially wasting all our resources. It is most likely that all of the VMs are oversized. A score of 1-10 means we're still not utilizing all our resources like we should be and we should probably optimize more. A score of 11-25 is getting better, it means that the optimization is pretty good, but not great. A score over 25 is generally pretty good and nothing to be concerned about. The minor badges associated with the Efficiency badge are ReclaimableWaste and Density.
Back on the Dashboard page, we can see the Efficiency widget with a Trend of
Efficiency graph for the last seven days. As we can see from the graph, most of my VMs are running pretty efficiently, meaning I don't have a lot of wasted resources. Clicking on the Efficiency badge or the Trend of Efficiency graph will also take us to the Planning tab under the Views subtab. However, by default, it selects the efficiency-related view Capacity Efficiency. If we're looking to find more information on efficiency, we can find it by going through the different views on
Minor badges
As noted in the Major badges section, there are several minor badges that make up each major badge and contribute to the total score for each major badge. The minor badges get their own scores as well to help narrow down where any issues are.
The Workload badge
The Workload badge can be somewhat confusing. This metric doesn't just measure
utilization, it checks many factors. It will check to see if there's a lot of resource
contention and if objects are consistently vying for resources. It is a minor badge of the
Health badge. When we click on the Workload badge, we're taken to the Operations
tab under the Details subtab; but this time, we're shown the Anomalies view, which we can tell because the Workload badge is bigger than the other badges shown. It also reads Workload in the top left if we're not able to tell by the badge itself.
My Workload score above is 0 because nothing in my environment is working very hard. In this case, the lower the score the better. Although this also means we're not really using an object. If the Workload is high for an object, we'd want to check
The Anomalies badge
As mentioned before, vC Ops learns our environment. It knows what's normal for a particular object and if it presents any anomalous behavior, this will be represented by the Anomalies score. This score is not based on absolutes because it's analyzing
the trends in our environment. There really is no way to get this information without the use of vCenter Operations Manager. Again, the lower the score the better as it implies there aren't strange things going on within our environment. This is also a minor badge of the Health badge. When we click on the Anomalies tab, we are also taken to the Operations tab under the Details subtab and in this case, it shows us the
Anomalies view.
The Faults badge
The last of the minor badges under Health, the Faults badge, tells us about concrete events that our objects are experiencing. With the Faults badge, the lower the number the better.
If we click on the Faults Badge, it will again take us to the Operations tab. Examples of what the Faults score is derived from are a power failure in the physical host or no NIC redundancy set up on our Management Network within vCenter. This badge is much less subjective than some of the other badges.
The Time Remaining badge
The way this score is generated is that it actually takes procurement time into account. By default, when the badge first turns red, it indicates we have 30 days left of whichever resource we're looking at. When we click on the Time Remaining
badge, it takes us to the Planning tab and by default, shows us the Virtual Machine Capacity view as shown in the following screenshot:
Using the previous shown chart, we can narrow down what we're low on. Since my
World object is selected, it's showing me my time remaining for everything.
The Capacity Remaining badge
The Capacity Remaining badge shows us how many more VMs we can fit in
Something to keep in mind is that the calculations involved here really only include powered on VMs. If the VM is powered off the only thing considered is the storage used. The way the score is calculated is vC Ops figures out the limiting resources, for instance, if we're running out of disk space. It will then figure out how many VMs can fit in the remaining space. Then, it will divide the possible VMs by the total VMs (possible + current), which give us a percentage. This is where the score comes from. So, according to the previous score and graph, I can grow my environment more than 50 percent the size it is now. If we click on this badge, it will take us to the same place the Time Remaining badge takes us to get a break down by resource.
The Stress badge
The Stress badge can be really helpful as it measure long-term workload. It tells us not only that our environment is stressed but also during which time periods it's stressed. This can be really helpful when troubleshooting. The Stress badge also contributes to the Risk score.
An example of using the Stress badge would be if we're seeing some long-term stress
on one of our hosts. Perhaps it's undersized for the amount of resources the VMs are taking up, but only on Fridays from 3:00 to 5:00 PM because that's when our DBA is running weekly reports. Now we know this is going to happen every Friday, so we can either accept that our other VMs on this host will run slower during this time, we can add resources to this host, or we can migrate VMs off this host to another less utilized host.
The Reclaimable Waste badge
The Reclaimable Waste badge is really interesting because it's part of the Efficiency
score and most people would agree that if vC Ops can save them from having to purchase more resources, then that's pretty great. Reclaimable Waste lets us know that we have oversized VMs and therefore, how many resources we can reallocate to new VMs. The Reclaimable Waste widget shows us the percentage of our total capacity that can be reclaimed and then breaks it down by vCPU, Disk, and Memory.
The Density badge
The Density badge is the last of the minor badges and it is also a part of the Efficiency score. Understanding the Density score can be more difficult because
people confuse it with Reclaimable Waste. However, density actually measures how much we can consolidate resources without experiencing performance hits. Whereas the Reclaimable Waste badge just tells us how VMs are oversized. If we think about it, the term density really makes sense because it asks how many objects can we fit inside my environment? If we have a score of over 25, then we have a pretty good consolidation ratio.
This can also show us where we might have some cost savings opportunity. If I can fit more objects in my environment without causing performance issues, this widget will give me an idea of that. To give a more specific example of how the Density
Keep in mind that the efficiency-related scores can also take into account usable capacity. This means if we have HA configured, it can be included in the calculation and, therefore, not counted as usable resources.
Heat maps
When we're in the regular UI of vC Ops and we click on Analysis, we can choose different heat maps we'd like to see. Let's look at an example to get a clearer understanding of how heat maps work.
In the previous screenshot, I've chosen the heat map For each datastore, which VMs currently have the highest IO usage and latency?. We can see how this heat map is configured by looking under the Color By, Fixed, Cluster/Host, and
Smallest Box columns. Let's take a closer look at how this is configured by