BREAST IMAGING
BREAST IMAGING
FOUR MODEL-BASED APPROACHES
edited by
Keith D. Paulsen, Ph.D.
Paul M. Meaney, Ph.D.
Thayer School of Engineering Dartmouth College, Hanover, NH USA
with
Larry C. Gilman, Ph. D.
Print ©2005 Springer Science + Business Media, Inc.
All rights reserved
No part of this eBook may be reproduced or transmitted in any form or by any means, electronic, mechanical, recording, or otherwise, without written consent from the Publisher
Created in the United States of America Boston
©2005 Springer Science + Business Media, Inc.
Visit Springer's eBookstore at: http://ebooks.kluweronline.com
Contributors
Preface
Four Alternative Imaging Modalities
Stephen Poplack, Wendy Wells, and Keith Paulsen
Computational Framework
Paul M. Meaney and Keith Paulsen
1. Elijah E. W. Van Houten and Marvin Doyley
Magnetic Resonance Elastography: Experimental Validation and Performance Optimization
Marvin Doyley and John Weaver
Electrical Impedance Spectroscopy: Theory Hamid Dehghani and Nirmal K. Soni
Electrical Impedance Spectroscopy: Translation to Clinic Alex Hartov, Ryan J. Halter, and Todd E. Kerner
Microwave Imaging: A Model-Based Approach
Paul M. Meaney and Qianqian Fang
Microwave Imaging: Hardware and Results Paul M. Meaney and Dun Li
Near Infrared Spectroscopic Imaging: Theory Hamid Dehghani and Brian Pogue
Near Infrared Spectroscopic Imaging: Translation to Clinic Brian Pogue, Shudong Jiang, Hamid Dehghani, and Keith Paulsen
Hamid Dehghani, Assistant Professor of Engineering at the Thayer School of Engineering, Dartmouth College, received a B.S. in Biomedical and Bioelectronic Engineering from the University of Salford, UK, in 1994; an M.S. in Medical Physics and Clinical Engineering from Sheffield University, UK, in 1995; and a Ph.D. in Medical Imaging at Sheffield Hallam University, UK, in 1999. For three years he was a research assistant at University College, London, investigating near infrared imaging of the neonatal brain. His research interests include numerical modeling and image reconstruction with applications in both optical and electrical impedance to-mography.
Marvin M. Doyley received a B.S. in Applied physics from Brunel University, UK, in 1994, and a Ph.D. in Biophysics from the University of London in 1999. From 1999 to 2001 he worked on intravascular ultrasonic elastography at the Department of Experimental Echocardiography of the Thoraxcentre, Erasmus University of Rotterdam. In 2001, he joined the Department of Radiology at the Dartmouth-Hitchcock Medical Center to work on magnetic resonance elastographic imaging in breast appli-cations. His research interests include ultrasonic and magnetic resonance im-aging, tissue characterization, and inverse problem solution.
Elijah E. W. Van Houten, Lecturer in Computational Solid Mechanics at the University of Canterbury, Christchurch, New Zealand, received a B.S. in Mechanical Engineering and a B.A. in Music from Tufts University in 1997 and a Ph.D. in Engineering Sciences from Dartmouth College in 2001. His research interests include biomedical engineering, elasticity imaging, reconstructive imaging methods, modeling of coupled fluid–solid systems, and heart-valve dynamics.
Shudong Jiang received her Ph.D. in optoelectronics from the Tokyo Institute of Technology in 1992. She was a research scientist at the Tokyo Institute of Technology and at Japan Science and Technology Corporation from 1992 to 1998. Her major fields are high-sensitivity optical detection and nano-etric-scale biosample observation and processing. She is currently a research associate at Dartmouth College in the field of near infra-red tomographic imaging of tissue.
Todd Kerner received a B.S. in physics from Haverford College, Haverford, Pennsylvania, in 1994. He then worked at the Philadelphia Heart Institute as part of a team studying arrhythmias occurring after myocardial infarction. From 1995 to 2003 he was enrolled in the M.D./Ph.D. program at Dartmouth College. He received his Ph.D. in Engineering in 2003 for a thesis involving the design, construction, and testing of an electri-cal impedance tomography system. From 2003 to 2006 he is a resident in in-ternal medicine at the Dartmouth-Hitchcock Medical Center.
Paul M. Meaney, Associate Professor of Engineering at the Thayer School of Engineering, Dartmouth, received an A.B. in Electrical Engineering and Computer Science from Brown University in 1982, an M.S. in Electrical Engineering from the University of Massachusetts in 1985, and a Ph.D. in Engi-neering Sciences from Dartmouth College in 1995. His re-search interests include microwave imaging for biomedical applications, mi-crowave antenna design, ultrasound-based elasticity imaging, and thermal modeling for focused-ultrasound surgery applications.
Keith D. Paulsen, Professor of Engineering at the Thayer School of Engineering, Dartmouth College, received a B.S. from Duke University in 1981 and M.S. and Ph.D. degrees from Dartmouth in 1984 and 1986, all in biomedical engi-neering. He was an assistant professor of electrical and com-puter engineering at the University of Arizona from 1986 to 1988 and, jointly, an assistant professor in radiation oncology at the Univer-sity of Arizona Health Sciences Center. He began teaching at Dartmouth College in 1988. A recipient of numerous academic and research awards and fellowships, he has carried out sponsored research for the National Science Foundation, the Whitaker Foundation, and the National Institutes of Health through the National Cancer Institute and the National Institute on Neuro-logical Disorders and Stroke. He has served on numerous national advisory committees for the National Cancer Institute, including membership on the Radiation Study Section and the Diagnostic Imaging Study Section. At the Thayer School of Engineering, Dartmouth College, he teaches biomedical engineering and computational methods for engineering and scientific prob-lems and is head of the Dartmouth Breast Imaging Group.
So-ciety of America. His current research is on laser-based cancer therapy (photodynamic therapy) and laser-based imaging of hemoglobin in tissue for physiology and tumor characterization. At the Thayer School he teaches electromagnetics, optics, digital electronics, and biomedical imaging.
Steven Poplack received a B.S. from Stanford University in 1984 and an M.D. from the Boston University School of Medicine in 1988. Today he is Co-Director of the Breast Imaging Center at Dartmouth-Hitchcock Medical Center and an Associate Professor of Radiology and OB-GYN at Dartmouth Medical School. His research interests include breast cancer and breast imaging. He is also the radiology liaison to the New Hampshire Mammography Network (a population-based mammography registry) and the clinical Co–Principle Investigator of the Dartmouth Alternative Breast Imaging Program funded by the National Can-cer Institute in 1999. His research interests include breast canCan-cer and breast imaging.
Nirmal Soni received a B.E. in Electrical Engineering from M.B.M. Engineering College, Jai Narain Vyas University, Jodhpur, India, in 1999 and an M.Tech. in Biomedical Engineering from the Indian Institute of Technology Bombay, Mumbai, India, in 2001. Since June, 2001 he has been a Ph.D. candidate in Biomedical Engineering at the Thayer School of Engineering, Dartmouth College. His research interests include finite element modeling, electromagnetic simulations, inverse problems, recon-struction algorithms for electrical impedance tomography, and image proc-essing.
Can-mouth Multidisciplinary Clinical Research Center and Co-Leader of the Clinical Core of the Dartmouth Alternative Breast Imaging Program. He conducts collaborative research in cancer and musculoskeletal disease and is an active contributor to the statistical literature in the areas of measurement error in nonlinear regression, longitudinal methods, and statistical methodol-ogy for image-based clinical research.
John Weaver is Adjunct Associate Professor and Lecturer at the Thayer School of Engineering, Dartmouth College. He obtained a B.S. in Engineering Physics from the University of Arizona in 1977 and a Ph.D. in Biophysics from the University of Virginia in 1983. He is also Associate Professor of Radiology at the Dartmouth Medical School. His research inter-ests include medical imaging, magnetic resonance imaging, image process-ing, and magnetic resonance elastography.
Paul M. Meaney, Ph.D.
Medical imaging has been transformed over the past 30 years by the advent of computerized tomography (CT), magnetic resonance imaging (MRI), and various advances in x-ray and ultrasonic techniques. An enabling force be-hind this progress has been the (so far) exponentially increasing power of computers, which has made it practical to explore fundamentally new ap-proaches. In particular, what our group terms “model-based” modali-ties—which rely on iterative, convergent numerical modeling to produce an image from data that is related nonlinearly to a target volume—have become increasingly feasible. This book explores our research on four such modali-ties, particularly with regard to imaging of the breast: (1) MR elastography (MRE), (2) electrical impedance spectroscopy (EIS), (3) microwave imaging spectroscopy (MIS), and (4) near infrared spectroscopic imaging (NIS).
(e.g., conductivity). The property distribution is estimated initially; the field equation is then solved approximately over the image space, using the esti-mated property distribution and the known illumination pattern as inputs to a finite element method; and finally, the simulated data are compared to the real data. If the simulated data and the real data are too dissimilar, the model property distribution is updated (by means that will be described in detail later in this book) and the field equation re-solved. This process is repeated until measurement agrees satisfactorily with model output. Solving the field equation and updating the model property distribution is computation-intensive because it requires the inversion of large matrices.
MRE, unlike the other three modalities, is not a tomographic approach. However, its goal—reconstruction of tissue elastic properties—also requires the solution of a nonlinear problem, and is also achieved by a model-based Gauss-Newton iterative method.
All our solution methods are nonlinear, but earlier attempts to utilize mi-crowave, near infrared, and electrical impedance approaches made use of lin-ear approximations. Although these proved inadequate, the ever-increasing availability of computing power may make some such approach feasible again.
Imaging for the detection of breast cancer is a particularly interesting and relevant application of the four imaging modalities discussed in this book. Breast cancer is an extremely common health problem for women; the Na-tional Cancer Institute estimates that one in eight US women will develop breast cancer at least once in her lifetime. Yet the efficacy of the standard (and notoriously uncomfortable) early-detection test, the x-ray mammogram, has been disputed of late, especially for younger women. Conditions are thus ripe for the development of affordable techniques that replace or complement the mammogram. The breast is both anatomically accessible and small enough that the computing power required to model it is affordable.
The editors would like to thank Shireen Geimer of the Thayer School of Engineering, Dartmouth College, for her patient and skillful efforts in preparing several of the figures in this book.
FOUR ALTERNATIVE BREAST IMAGING
MODALITIES
Steven Poplack, M.D., Ph.D., Wendy Wells, M.D., M.S., and Keith Paulsen, Ph.D.
1
INTRODUCTION
1.1
Breast Cancer
In the United States, breast cancer is the most common non-skin malignancy in women and the second leading cause of female cancer mortality. Ap-proximately 180,000 new cases of invasive breast cancer, resulting in over 40,000 deaths, are diagnosed annually. Age-adjusted incidence has remained approximately constant since a notable increase from the mid 1970s to the late 1980s, while mortality, after having remained constant for at least 40 years, has been declining slowly since 1990 (i.e., from ~22% in 1990 to ~ 18% in 2000) [1, 2]. Approximately one in every eight US women is diag-nosed with breast cancer by the age of 90, for an absolute lifetime risk of 14.4% [2]. Breast cancer also occurs in men, but accounts for less than one percent of male malignancies.
Force concluded that the “evidence is insufficient to recommend for or against routine CBE alone . . . [or] teaching or performing routine breast self-examination” [7].
Screening might produce greater benefits if it were more sensitive and specific. However, the standard screening technology—x-ray screen-film mammogram—has many unsatisfactory features, as reviewed below. There-fore, a wide variety of new technologies, including alternative imaging mo-dalities, improvements in x-ray mammography, and novel biological assays, are being investigated (and in some cases deployed) in hopes of improving early-detection rates.
1.2
Mammography and the Rationale for Alternatives
In the US, mammography is currently the most effective method of detecting asymptomatic breast cancer. Its use for screening has been widely promoted by the National Cancer Institute and other organizations. Screening is also the primary role foreseen for most of the alternative imaging modalities now being developed. The potential usefulness of alternative imaging is not, how-ever, restricted to screening; it may also contribute to the characterization of breast abnormalities detected by mammography and other means, including breast self-examination and CBE.
Despite its recognized value in detecting and characterizing breast dis-ease, mammography has important limitations. First, its false-negative rate ranges from 4% to 34%, depending on the definition of a false negative and on the length of follow-up after a “normal” mammogram [8]. Second, screening mammography is less sensitive in women with radiographically dense breast tissue [9]. This is of particular concern because the amount of fibroglandular tissue may represent an independent risk factor for developing breast cancer [10]. Third, screening mammography also suffers from a high false-positive rate: on average, 75% of breast biopsies prompted by a “suspi-cious” mammographic abnormality prove benign [2]. Mammography’s other drawbacks include discomfort due to breast compression, variability in ra-diological interpretation, and a slight risk of inducing cancer due to the ion-izing radiation exposure.
ul-trasound (including compound, three-dimensional, Doppler, and harmonic variants), magnetic resonance imaging (MRI), elastography, scintimammo-graphy, positron emission tomoscintimammo-graphy, and thermography [2].
Some alternative imaging methods do not yet achieve the high-resolution structural imaging offered by conventional mammography. While this would
be desirable, there are good reasons for trading some spatial resolution for other information. In particular, providing the radiologist with alternative tools for evaluating patient populations not well-served by mammography and expanding the diagnostic information available to the radiologist in clini-cally suspicious cases are important goals not dependent on high spatial resolution as such. For example, imaging methods that are sensitive to func-tional malignant features such as angiogenesis could be exploited in an ad-junctive role to improve the specificity of mammographic diagnosis. In addition, x-ray mammography has been repeatably found not to detect 10–30% of cancers greater than 5 mm in diameter, largely due to its rela-tively poor soft-tissue contrast [11]. This is particularly true for radiologi-cally dense breasts, which are more common in younger women. Spatial resolution may thus not be the limiting factor for detecting certain mammo-graphic abnormalities, and so should not be the overriding concern in the de-velopment of alternatives to current breast-imaging technologies.
Since 1999 a group of engineers and physicians at Dartmouth College has been conducting a research program dedicated to the development of al-ternative breast-cancer imaging technologies. We believe that the four alter-native modalities we are investigating—magnetic resonance elastography (MRE), electrical impedance spectroscopy (EIS), microwave imaging spec-troscopy (MIS), and near infrared spectroscopic imaging (NIS), all discussed in detail in this book—have the potential to increase the frequency and accu-racy with which breast cancer can be detected and diagnosed and to improve the staging and monitoring of disease progression/regression during treat-ment and follow-up periods of clinical care.
sophis-tication, the technologies themselves will become increasingly viable choices for risk assessment and early detection. Indeed, a 1998 consensus report by the National Cancer Institute blue-ribbon panel on the future of breast cancer research (Priorities for Breast Cancer Research, 1998) explicitly cited MRE, EIS, MIS, and NIS as promising avenues for advancing the detection and di-agnosis of breast disease. These modalities have been rendered feasible by the recent explosion in low-cost computational power. They do not use ion-izing radiation, do not require painful levels of breast compression, are not likely to be limited by radiographically dense breast composition (i.e, de-creased sensitivity in the setting of dense breasts), and should provide quan-titative data that can reduce the interpretive variability associated with mammography.
In the following sections, the physical bases of MRE, EIS, MIS, and NIS are outlined, along with the electrical and mechanical properties of normal and abnormal breast tissue that enable these modalities to discriminate be-tween healthy and abnormal tissues. A detailed review then follows of our assessment of microvasculature and tissue-type interfaces in breast tissues having normal histology, fibrocystic disease, fibroadenomas, and invasive carcinomas. This study shows how electromechanical tissue properties can correlate with biological characteristics. We conclude by describing some of our near-term goals.
2
FOUR ALTERNATIVE MODALITIES
All four of the modalities being investigated by our group work by iteratively optimizing a two- or three-dimensional finite element (FE) model of specific material properties throughout some portion of the breast. An optimization algorithm compares actual measurements made outside the breast—light in-tensities, electromagnetic (EM) fields, or mechanical displacements—to data predicted using the FE model. The model is then iteratively adjusted to make its predictions approximately match observation, and the property distribu-tion corresponding to the best available convergence is used to generate an image. It is because of FE modeling’s essential role in this process that we refer to all four techniques as model-based alternative breast-imaging mo-dalities.
2.1
Magnetic Resonance Elastography (MRE)
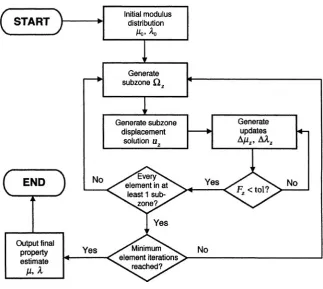
In this technique, mechanical vibrations are applied to the breast’s surface that propagate through the breast as a three-dimensional, time-harmonic spa-tial displacement field varying locally with the mechanical properties of each tissue region. Magnetic resonance (MR) techniques are used to image this displacement field. These data are used to optimize an FE model of the breast’s three-dimensional mechanical property distribution by iteratively re-fining an initial estimate of that distribution until the model predicts the ob-served displacements as closely as possible. MRE is distinguished from the other three methods discussed in this book by the fact that a very large, three-dimensional data set is supplied to its FE modeling algorithm. This mandates special “subzone” techniques to reduce the computational challenge, as dis-cussed in Chapter 3. MRE is also the only nontomographic technique in this set of alternative modalities.
The principal hypothesis underpinning our MRE project is that the me-chanical properties of breast tissue provide unique information for the detec-tion, characterizadetec-tion, and monitoring of pathology. There is much evidence to suggest that tissue hardness is strongly associated with cancer. The effec-tiveness of clinical palpation for hard tissue in discovering larger tumors is well-established; in the Breast Cancer Demonstration Project, approximately one-third of malignancies were discovered by physical examination rather than by x-ray mammography [12]. Although little quantitative work has ap-peared on the mechanical properties or behavior of breast tissue, measure-ments of the sonoelasticity of masses in rodent prostatectomy specimens have shown good correlations with elasticity [13–15].
As detailed in Chapter 4, our MRE team has recovered images based on time-harmonic, steady-state mechanical wave generation, MR measurement, and numerical inversion to form images of mechanical properties at or near the acquisition resolution of MRI. Further, a number of clinical exams have been completed that have demonstrated feasibility, provided preliminary es-timates of the elastic properties of the normal breast, and highlighted areas where further investigation is warranted.
2.2
Electrical Impedance Spectroscopy (EIS)
The observed patterns of voltage and current are a function both of the sig-nals applied and of the interior structure of the breast. EIS seeks to optimize an FE model of the spatial distribution of conductivity and permittivity in the breast’s interior, using the applied signals as known inputs and the observed signals as known outputs. EIS is referred to as electrical impedance spectros-copy because AC currents can be applied to the breast at a wide range of fre-quencies.
In the frequency range of interest for this modality, the so-called dis-persion is sensitive to cellular morphology and tissue microarchitecture, par-ticularly membrane structures (both intra- and extracellular). At the low end of the spectrum, charging and discharging of membranes occurs, which in-troduces capacitance and forces electric current to pass through the extracel-lular medium. As frequency is increased, celextracel-lular capacitive reactance decreases, which causes an increase in current flow through the intracellular space. This makes higher-frequency signals more sensitive to intracellular in-fluences. Also at higher frequencies, dipolar reorientation of proteins and tis-sue organelles can occur. Hence, the dispersion electrical-property spectrum contains information about both the extra- and intracellular envi-ronments.
A study by Cuzick et al. [16] supports this view. The authors measured the electrical depolarization index of breasts in vivo for 661 women sched-uled for open biopsy. Comparison of abnormalities detected from the electri-cal depolarization data to biopsy results yielded 70% specificity at 80% sensitivity and 55% specificity at 90% sensitivity for palpable masses. The authors hypothesize that the measured effect results from a loss of transepi-thelial potential during the carcinogenesis of normally polarized epitransepi-thelial cells, and further surmise that abnormal proliferation extending around the borders of the malignancy into the surrounding regions of the affected site (which has been shown to occur in breast and other epithelial cancers) causes the electrical differences sensed at the surface. If these intrinsic electrical polarization-depolarization phenomena do occur, they will perturb the ac-tively induced electric fields associated with EIS imaging and may produce a detectable, larger-than-tumor signature.
The goal of our EIS team has been to develop an ultrafast, multidimen-sional (i.e., spatio-spectral) EIS imaging system complete with data acquisi-tion electronics, breast posiacquisi-tioning interface, and exam-control and image-reconstruction software. We have constructed three generations of such systems, the first of which has been operational for the majority of exam ses-sions described in Ch. 6 of this book and the latest of which represents a large step forward in capability and speed and is now operational for clinical use. This advanced instrument is a considerable asset in addressing funda-mental questions surrounding the potential role of EIS in breast-imaging ap-plications. It has yet to be optimized for clinical use from both the hardware and software perspectives (see Ch. 6).
2.3
Microwave Imaging Spectroscopy (MIS)
Like EIS, MIS interrogates the breast using EM fields. It differs in using much higher frequencies (300–3000 MHz). In this range it is appropriate to treat EM phenomena in the breast in terms of wave propagation rather than voltages and currents. The technologies and mathematics used in EIS and MIS are, therefore, somewhat divergent, despite the fact the both exploit EM interactions in tissue.
Like EIS and NIS, MIS surrounds the breast with a circular array of transducers. In this case, these are antennas capable of acting either as trans-mitters or receivers. Unlike the transducers used in EIS and NIS, these an-tennas are not in direct contact with the breast but are coupled to it through a liquid medium (i.e., the breast is pendant in a liquid-filled tank). Sinusoidal microwave radiation at a fixed frequency is emitted by one antenna and measured at the other antennas. Each antenna takes its turn as the transmitter until the entire array has been so utilized. A wide range of frequencies may be employed, hence the term “microwave imaging spectroscopy.” As in the other modalities, an FE model of either a two-dimensional slice or a three-dimensional subvolume of the breast is iteratively adjusted so that the mag-nitude and phase measurements predicted using the transmitted waveforms as known inputs converge as closely as possible with those actually observed. The breast properties imaged are permittivity and conductivity, as in EIS, but because of the disjoint frequency ranges employed these properties may serve as proxies for different physiological variables in the two techniques.
polariza-tion of atoms and molecules to produce dipoles; and (3) orientapolariza-tion of per-manently dipolar molecules in the direction of the applied field. The number of free electrons and ions that are available to create a conduction current within the tissue in response to an applied field is proportional to the tissue’s intrinsic electrical conductivity. The degree to which it can be polarized, ei-ther by the creation of new dipoles or by the co-orientation of permanently dipolar molecules, is a measure of its permittivity.
Ex vivo data show that electrical property values can differ by a factor of 5 to 10 between normal and malignant human breast tissues over the micro-wave frequency range [21, 22]. Malignant mammary tumors apparently have electrical properties which mimic those typically found in high-water-content tissues such as muscle, whereas normal breast has properties typical of low-water-content, fatty tissues. The increased blood volume associated with the neovascularization of the rapidly proliferating tumor periphery may be re-sponsible for increased water content, a variable to which microwave illumi-nation is particularly sensitive. In fact, one study has found that for normal and malignant human tissues of the same histological type, greater differ-ences in electrical properties occur in mammary than in colon, kidney, liver, lung, and muscle [17].
In short, EM properties in the microwave band offer high intrinsic con-trast for pathology, especially in the breast. Exploiting this concon-trast for im-aging has been challenging because of the difficulties associated with inducing and measuring a response noninvasively that can be used to dis-criminate local variations in EM properties. However, our MIS effort has met a number of these challenges and is poised to complete the first critical evaluation of the potential of microwave breast imaging. A clinical imaging system has been realized that transceives broadband, high-fidelity propagat-ing fields through a noncontactpropagat-ing antenna array translated axially under computer control; this system will deliver MIS exams to pendant breasts im-mersed in a fluid that promotes signal coupling.
2.4
Near Infrared Spectroscopic Imaging (NIS)
Published data have long supported the notion that near infrared spec-troscopy and imaging offer excellent contrast potential. Studies have shown 2:1 contrast between excised tumor and normal breast at certain near infrared wavelengths [23, 24]. Correlations with increase in blood vessel number and size (which is characteristic of neovascularization in the tumor periphery and may lead to a fourfold increase in blood volume) have been reported [25] and have been estimated to translate into 4:1 contrast in optical absorption coef-ficients [26] (see Sec. 3, “Correlation With Pathology”).
In addition to the absorption contrast afforded by blood-concentration changes in tumorigenic regions of the breast, contrast specificity provided by light scattering resulting from calcifications involving matrix accumulation of insoluble phosphates, often associated with tumors, may also be exploit-able for imaging purposes [27]. The detailed forms of microcalcifications would not be visible due to spatial resolution limits, but the aggregate optical signature of calcification clusters may be detectable. Another potential con-trast mechanism is provided by the lipid content of the tissue, the spectral peaks of which occur at 750 nm and 940 nm; these peaks would presumably be reduced in breast cancers as compared to surrounding, normal, fattier tis-sue. It is furthermore notable that the optical properties imaged spectrally with NIS—absorption and scatter—can be used to deduce certain physiologi-cal variables, such as total hemoglobin concentration and oxygen saturation. These are being investigated as possible means to differentiate benign from malignant breast disease (see Ch. 10).
Our NIS initiative has been the first of our modality initiatives to regu-larly employ three-dimensional data acquisition and image reconstruction during clinical breast exams. Further, it has led the way in terms of analyzing its imaging data in both the normal and abnormal breast in relation to clinical factors and histological indicators in order to explore and explain the biologi-cal/physiological basis of image contrast. It has also pioneered the overall movement within our program toward image assessment by both quantitative methods (contrast-to-noise metrics) and qualitative methods (observer ex-periments) in order to characterize how nonlinear image reconstruction influ-ences traditional contrast-detail and region-of-interest curves.
3
CORRELATION WITH PATHOLOGY
is the investigation of the relationship between the imaged properties and actual tissue pathology. Toward this end, the following section describes ini-tial pathology studies that have been conducted in parallel with imaging mo-dality development. A general overview of breast physiology is followed by a more in-depth discussion of morphologic criteria that may correlate with contrast mechanisms operative in alternative imaging modalities. The discus-sion is somewhat technical, so non-medical readers may wish to skip directly to Section 4, “Unifying the Four Modalities.”
3.1
The Breast
The adult female breast is a large, modified sebaceous gland that consists mostly of fat, fibrous septa, and glandular structures. The weight range for a “normal,” mature female breast is 30 grams to over 500 grams, depending on the woman’s body habitus. The breast typically comprises 15 to 25 lobes that are divided into multiple lobules, each containing 10–100 terminal milk-secreting alveoli. Numerous tiny milk-transporting ductules combine to form a single lactiferous duct that exits each lobule. About 15 to 25 such ducts converge at the nipple. The composition of the breast varies from individual to individual and with age and other factors. Pregnancy, lactation, menstrua-tion, and menopause all introduce characteristic changes in breast physiol-ogy. For example, in postmenopausal involution of the breast, the lobular and alveolar structures regress and the vascularity of the intervening connective tissue is reduced. Eventually only small, occasional islands of functional breast parenchyma remain, surrounded by dense, scarred connective tissue [28].
3.2
Breast Tissue Morphology
con-centration and oxygen saturation, as indirectly measured by NIS. The ratio of functional breast parenchymal epithelium to surrounding dense connective tissue stroma (epithelium-to-stroma ratio, E:S) may correlate with tissue hardness, elasticity or compressibility as measured by MRE. Variable inter-faces between tissue types are also likely to influence the electromagnetic properties associated with modalities such as EIS and MIS, which are sensi-tive to such morphologic attributes of the local cell population as volume fraction, membrane integrity, water content, and ionic concentrations. Un-fortunately, biological correlates with tissue water content are difficult to evaluate since the tissue must be routinely processed (formalin-fixed, dehy-drated, and paraffin-embedded) in order not to compromise the pathologist’s ability to make a definitive tissue diagnosis.
A range of electromechanical and biological values for normal breast tis-sue must first be established to ensure a meaningful comparison to diseased
breast tissue. To this end, we have completed a study employing a computer-aided program specifically developed to reproducibly assess microvascula-ture and tissue type interfaces in benign and malignant breast tissue.
The benign diagnostic categories comprised (1) breast tissue with normal histology, (2) fibrocystic disease, and (3) a common benign neoplasm (fi-broadenoma). The malignant neoplasm category comprised invasive carci-nomas. Fourteen patients who underwent breast-reduction surgery with sampling from both breasts provided tissue with normal breast histology. Twenty-one patients (16 of whom also underwent breast reduction surgery with sampling from both breasts, 5 with unilateral biopsies) provided tissue with fibrocystic disease of variable severity (mild, moderate, or severe). Nineteen patients provided tissue with a benign fibroadenoma from one breast, each lesion classified according to the degree of stromal hyalinization or scarring in the tumor. Seventeen patients provided tissue with an invasive, malignant carcinoma from one breast [29].
Mean vessel density (MVD, percentage of each unit area that consists of transected vessels), mean vessel area (MVA, average cross-sectional area of an individual vessel), and vessel orientation (correlated with shape of ob-served cross-section) were the morphologic criteria chosen to assess tissue microvascularity. The criteria chosen to evaluate tissue hardness, elasticity, and compressibility were the epithelium-to-stroma ratio (E:S), the degree of severity of fibrocystic disease, the degree of stromal hyalinization or scarring in the benign neoplasms (fibroadenomas), the infiltrative patterns of the ma-lignant neoplasms (carcinomas), and the type of tissue interfacing with the neoplasms (fatty, fibrofatty, fibrous, fibrocystic changes).
used to stain routinely processed (i.e., formalin-fixed, paraffin-embedded) tissue sections. The segmentation of specific regions of interest (vessels and epithelium) is facilitated if these regions are stained to distinguish them from the surrounding tissues. Outlining of vessels can then be achieved using a specific immunologic marker of the endothelial cells that line the vessels (i.e., a commercially available CD31 stain). The epithelial component of the tissue can be distinguished from the surrounding connective tissue stroma using a specific immunologic marker of epithelial cells (cytokeratin 5D3).
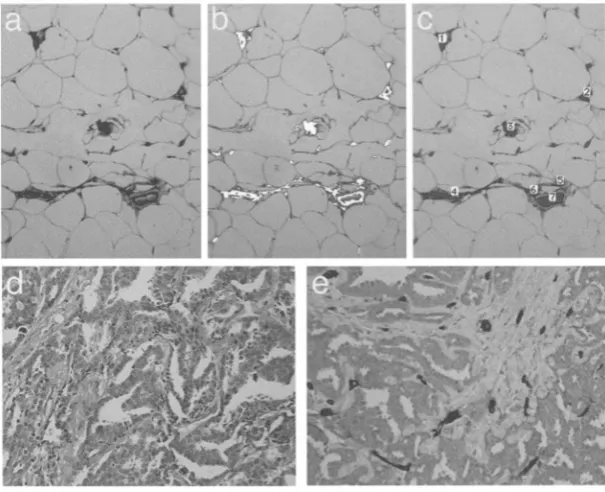
Using these immunohistochemical techniques, we analyzed more than 100 breast specimens for MVD, MVA, shape,* and E:S across the four
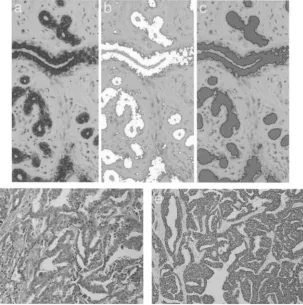
diag-nostic categories, namely (1) normal, (2) fibrocystic disease, (3) benign neo-plasms (fibroadenomas), and (4) malignant neoneo-plasms (invasive carcinomas). Representative micrographs illustrating tissue types, computer processing, and staining are given in Figures 1–4. Vessel analysis of the neoplasms was compared peripherally and centrally. Adjusted t-tests assessed the effects of fibroadenoma stromal hyalinization or scarring and fibrocystic disease se-verity. Measurement reproducibility for the three benign diagnostic groups was assessed using Spearman correlation coefficients.
*
Figure 1. Immunostaining of normal breast tissue with the pan-endothelial marker CD31 highlights the endothelium-lined vessels per unit area (a). Using gray-value segmentaion (b), the endothelial-lined vessels with positive immunostaining are automatically outlined and counted (c). Dedicated image-processing macros then provide the microvessel density (MVD), microvessel area (MVA), and total vessel count per unit area. As compared to a mean MVD of 0.27 (SD 0.095) for normal breast, the mean MVD for an infiltrating ductal carcinoma (d and e) is 0.77 (SD 0.09). Hematoxylin and eosin stain (d), CD31 immunostaining (e)
The adjusted means for the chosen morphologic variables in normal breast, fibrocystic disease, fibroadenomas, and carcinomas are given in Table 1. There is a significant difference between the value ranges for MVD, MVA, E:S, and shape when comparing the four diagnostic categories’ (p < .001). For the invasive carcinomas, the significances for E:S and MVD were higher ( p < .001) as compared to fibroadenomas, but that for MVA was smaller. When comparing the fibroadenomas and carcinomas centrally versus peripherally, there was no significant difference between the four measured variables.
Figure 2. Immunostaining of normal breast tissue with the cytokeratin 5D3 high-lights the epithelial components (a). Using gray-value segmentation (b), the areas of epithelium with positive immunostaining are outlined (c) and measured as a ratio of the surrounding, unstained stroma to derive the epithelium-to-stroma ratio (E:S). As compared to a mean E:S of 0.013 (SD 0.0045) for normal breast, the mean E:S for an infiltrating ductal carcinoma (d, e) is 0.162 (SD 0.0395). Hematoxylin and eosin stain (d), cytokeratin immunostaining (e).
MVA, and vessel shape) showed right-versus-left predictability, most sig-nificantly for E:S ( p < .001).
did not affect the MVD but the MVA decreased as the severity of fibrocystic disease increased ( p = .038).
Of the 19 fibroadenomas measured in our study, 6 were classified with predominantly loose, myxoid stroma (1+), 5 with predominantly hyalinized (scarred) stroma (3+), and 8 with a mixture of both stroma types (2+) In the fibroadenomas with more stromal hyalinization (3+), the proportional amounts of associated epithelium were less as compared to the
fibroadeno-Figure 4. For this infiltrating ductal carcinoma of intermediate grade, 0.8 cm di-ameter, and interfacing with fat, shown in (a) with hematoxylin and eosin stain, computer-assisted image processing of cytokeratin 5D3 immunostaining (b) gave an
MVD of 0.68 and and MVA of 155
Figure 3. For this benign fibroadenoma with hyalinized stroma, shown with hema-toxylin and eosin stain (a), 1.4 cm in diameter and interfacing with fat, computer-assisted image processing of cytokeratin 5D3 immunostaining (b) gave an E:S of 0.05. Analysisof immunostaining with the pan-endothelial marker CD31 (c) gave an MVD of 0.45 and an MVA of 175
mas with loose, myxoid stroma (1+), where the E:S was significantly in-creased ( p<.001). Similarly, the MVD was significantly less in the lesions with hyalinized stroma (3+) as compared to those with myxoid stroma (p < .001). The presence or absence of stromal hyalinization did not signifi-cantly affect the MVA. These findings may be important in distinguishing sclerotic, hyalinized fibroadenomas (usually seen in older patients) from ma-lignant neoplasms. We also postulate that hyalinized fibroadenomas are harder and less compressible than myxoid fibroadenomas, which may impact the findings of the EIS, MIS, and MRE imaging modalities.
As expected, the E:S and MVD seen in the 17 invasive breast carcinomas were significantly higher than the benign diagnostic groups, reflecting new vessel formation. However, the MVA of these new vessels was smaller, both peripherally and centrally, in the malignant neoplasms than in the benign neoplasms. Of the 17 carcinomas measured in the current study, 14 were usual infiltrating ductal carcinomas, 2 were lobular carcinomas, and one was a colloid or mucinous carcinoma (a variant of a ductal carcinoma with a high mucin component). We postulate that the infiltrative pattern of a tumor and its ability to cause architectural distortion correlates with changes seen in im-aging modalities. The sclerotic, spiculated mass of a typical ductal carcinoma would most likely cause greater compression changes than the single-cell, in-sidious growth pattern of a lobular carcinoma or the soft, well-circumscribed mass of a colloid/mucinous carcinoma (which causes only minimal distortion of the surrounding tissue). We also postulate that a typical invasive ductal carcinoma arising in a fatty breast will exhibit a more sharply contrasting at-tenuation signal at the tumor/fat interface than the same tumor arising in dense, fibrous breast stroma. In the latter case, the attenuation gradient (i.e., in transitioning from tumor to collagen to surrounding fat) would be less steep. Conversely, for tumor types such as tubular or lobular, which infiltrate as subtle tubules or single cells respectively, it is likely that signal attenuation would be more diffuse and the proportions of epithelium (tumor and normal) to connective tissue stroma and to fat less well-defined.
The results for shape (vessel orientation), where ranges of 0–1 correlate with perfectly longitudinal and perfectly transverse vessel sectioning respec-tively, suggest near-random alignment of the vascular spaces in benign and malignant breast tissue. Overall, vessel shape values were significantly lower in the fibroadenomas than the other diagnostic categories, representing a trend towards a more longitudinal arrangement.
reproducibility for multiple observers has not been evaluated; and the malig-nant tumors used for comparison with the benign breast tissue were all inva-sive carcinomas. Nevertheless, this study establishes a reproducible computer-assisted technique to assess morphologic criteria in benign and malignant breast tissue that may correlate with properties detected by alter-native breast imaging techniques. It also provides a baseline of expected val-ues for normal and abnormal breast tissue against which results from study subjects can be compared. In this regard, pathological findings in 39 study subjects with biopsied screening abnormalities have been evaluated. The morphometric measurements from the study subjects fall within the ranges established in Table 1. The measures from the initial core biopsies are occa-sionally lower than either the established normal ranges or the subsequent excisional biopsies, due to limited sampling in the cores. (Excisional biopsy specimens were used to establish the data in Table 1.)
In an additional set of analyses, we compared pathology measures to electromechanical properties as determined by alternative imaging modali-ties. Table 2 reports Spearman correlations between pathology and imaged properties for regions of interest from exams with abnormal conventional findings. These correlation coefficients suggest possible relationships be-tween property measures and specific pathological properties of the related biopsy material. In particular, we note a fairly high correlation between ves-sel density and the NIS-derived value for (total hemoglobin). The rela-tionship between pathological vessel density and percent blood determined from imaged NIS parameters is particularly clear (Figure 5).
The pan-endothelial cell immunomarker CD31, which we used to meas-ure MVD, labels both the activated endothelial cells lining newly formed vessels and the endothelial cells lining vessels established since embryogene-sis. MVD evaluated using CD31 needs to be validated against MVD evalu-ated using immunomarkers specific for activevalu-ated endothelial cells only, such as the endothelial membrane glycoprotein endoglin (CD 105) and the integral membrane metalloprotease CD 13. MVD also needs to be correlated with other markers of angiogenic activity, including angiogenic peptides such as vascular endothelial growth factor (VEGF) and basic fibroblast growth factor (bFGF); matrix-degrading proteolytic enzymes such as urokinase-type plas-minogen (uPA) and plasplas-minogen activator inhibitor I (PAI-1); and plasmino-gen-activated cytokines such as transforming growth factor beta (TGF-beta).
4
UNIFYING THE FOUR MODALITIES
The importance of developing alternative breast cancer imaging modalities is that they may access new mechanisms of physiological contrast. Further, there may be synergistic effects when the four approaches discussed in this text are used as complements to each other rather than in isolation. This mul-timodality approach is an important theme, as it is unlikely that any single breast-imaging method will be superior across the whole spectrum of women receiving clinical breast care.
With this approach in mind, the clinical introduction of these alternative modalities is being coordinated by our clinical research team at the Dartmouth-Hitchcock Medical Center. The clinical team supplies the infrastructure for efficient subject recruitment and for the generation of a common database of clinical experiences, image analyses, case studies, and outcomes. This enables us to compare alternative and conventional imaging modalities in a common set of clinical circumstances and to compare the information obtained from using multiple modalities to that gained from each modality alone.
advanced numerical algorithmic concepts, making them critically dependant on the robust software implementation and access to state-of-the-art com-puting environment that are provided by our computational team.
While this framework is clearly useful, development within each individual project retains important independent aspects, particularly in relation to the unique physical requirements of each. In this book, this balance of coordination and individuality is reflected in the computational overview in Chapter 2 and the treatises on the theory and numerical implementation specific to each modality (Chapters 3,5,7, and 9).
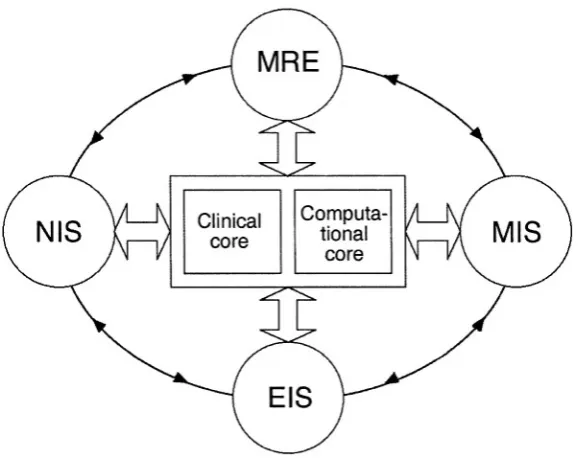
Figure 6 illustrates the development interactions of the four modalities and the supporting clinical and computational teams (or “cores”). The circu-lar path connecting the individual modality projects represents the flow of in-formation that may originate in any one project and influence one or more of the others. Such influence is possible because, while each modality project is responsible for its own technological advancement, preclinical test-ing/evaluation, and clinical image analysis, all four projects pursue quantita-tive breast tissue property mapping that consists of the same three essential elements: (1) a controlled stimulus applied to the breast over a three-dimensional volume encompassing the region of interest; (2) fast, accurate
measurement of breast response to the applied stimulus over the corre-sponding tissue volume; and (3) image formation from the response based on breast property parameter estimations achieved through mathematical mod-eling techniques. As a result, interactions and collaborations between project components exist in areas of hardware/software data generation, acquisition, calibration, and validation along with image reconstruction and analysis.
5
A GLANCE AHEAD
The next chapter expounds the significant computational ground held in common by all four modalities. The remainder of the book will take a closer look at the mathematics, hardware, and results of each of the four modalities. A pair of chapters is devoted to each modality, one to explore computational and theoretical issues and another to describe devices and results.
REFERENCES
L. A. G. Rise et al., SEER Cancer Statistics Review 1973–1994. NIH Publication No. 97-2789 (Bethesda, MD: National Cancer Institute, 1994).
Committee on Technologies for the Early Detection of Breast Cancer, Mammography and Beyond: Developing Technologies for the Early Detection of Breast Cancer, S. J. Nass, I. C. Henderson, and J. C. Lashof, eds., National Cancer Policy Board (Washing-ton, D.C.: National Academy Press, 2001).
L. L. Humphrey et al., “Breast cancer screening: Summary of the evidence for the U.S. Preventive Services Task Force.” Ann. Intern . Med., Vol. 137, 2002, pp. 347–360. O. Olsen and P. C. Gøtzsche, “Cochrane review of screening for breast cancer with mammography” (letter). Lancet, Vol. 358, 2001, pp. 1340–1342.
O. Olsen and P. C. Gøtzsche, “Systematic review of screening for breast cancer with mammography.” The Nordic Cochrane Center, Denmark, 2001, available at http://image.thelancet.com/lancet/extra/fullreport/pdf (accessed Jan. 29, 2004).
S. W. Fletcher et al., “Report of the International Workshop on Screening for Breast Cancer.” JNCI, Vol. 85, 1993, 1644–1656.
US Preventive Service Task Force, Ann. Intern. Med., Vol. 137, 2002, pp. 344–346. P. T. Huynh, A. M. Jarolimek, and S. Daye, “The false-negative mammogram.” Radio-graphics, Vol. 18, No. 5, 1998, pp. 1137–1154.
P. A. Carney et al., “Individual and combined effects of age, breast density and hormone replacement therapy use on the accuracy of screening mammography.” Ann. Intern. Med., Vol. 138, 2003, pp. 168–175.
N. F. Boyd et al., “Quantitative classiafication of mammographic densities and breast cancer risk,” JNCI, Vol. 87, 1995, pp. 670–675.
[13]
Evaluation of the extended follow-up of the Breast Cancer Detection Demonstration Project. ” Cancer: Diagnosis, Treatment, Research, July 1994 (1 Suppl), pp. 301–310. F. Lee Jr. et al., “Sonoelasticity imaging: Results in in vitro tissue specimens. ” Radiology, Vol. 181(1), 1991, pp. 237–239.
M. A. Hadley et al., “Sonoelasticity imaging of prostate cancer.” RSNA Abstracts, 1993.
D. J. Rubens et al., “Sonoelasticity imaging of prostate cancer: In vitro results. ” Radiology, Vol. 195(2), 1995, pp. 379–385.
J. Cuzick et al., “Electropotential measurements as a new diagnostic modality for breast cancer. ” Lancet, Vol. 352, 1998, pp. 359–363.
T. Morimoto et al., “Measurement of the electrical bioim-pedance of breast tumors. ” Eur. Surg. Res., Vol. 22, 1990, pp. 86–92.
T. Morimoto et al., “A study of the electrical bio-impedance of tumors. ” J. Invest. Surg., Vol. 6, 1993, pp. 25–32.
J. Jossinet, “Variability of impedivity in normal and pathological breast tissue. ” Med. & Biol. Eng. & Comput.,
Vol. 34, 1996, pp. 346–350.
A. J. Surowiec et al., “Dielectric properties of breast carcinoma and the surrounding tissues. ” IEEE Trans. Bio-med. Eng., Vol. 35, 1988, pp. 257–263.
W. T. Joines et al., “The measured electrical properties of normal and malignant human tissues from 50 to 90 MHz. ”
Med. Phys., Vol. 21, 1994, pp. 547–550.
S. S. Chaudhary et al., “Dielectric properties of normal and malignant human breast tissues at radiowave and micro-wave frequencies. ” Indian J. Biochem. Biophys., Vol. 21, 1984, pp. 76–79.
V. G. Peters et al., “Optical properties of normal and diseased human breast tissue in the visible and near infra-red. ” Phys. Med. Biol., Vol. 35, 1990, pp. 1317–1334. H. Key, “Optical attenuation characteristics of breast tissues at visible and near-infrared wavelengths. ” Phys. Med. Biol., Vol. 36, 1991, pp. 579–590.
A. E. Profio, G. A. Navarro, and O. W. Sartorius, “Scien-tific basis of breast diaphanography. ” Med. Phys., Vol. 16, 1989, pp. 60–65.
B. W. Pogue et al., “Initial assessment of a simple system for frequency-domain diffuse optical tomography. ” Phys. Med. Biol., Vol. 40, 1995, pp. 1709–1729.
B. Chance et al., “On the medical uses of photon migration in tissues,” in Integration of Medical Optical Imaging and Spectroscopy and Magnetic Resonance Imaging Symposium Ab-stracts, Dec. 2, Philadelphia, PA, 1994.
S. S. Sternberg, ed., Histology for Pathologists, 2nd Ed., Ch. 4 (Philadelphia: Lippencott Raven Publishers, 1997).
[29]
[30]
[31]
W. Wells et al., “Analysis of the microvasculature and tissue type ratios in normal vs. benign and malignant breast tissue. ” Journal of Analytical and Quantitative
Cy-tology and HisCy-tology, Vol. 26, 2004, pp. 166–174.
N. Weidner et al., “Tumor angiogenesis: A new significant and independent prognostic indicator in early-stage breast carcinoma.” JNCI, Vol. 84(24), 1992, 1875–1887.
COMPUTATIONAL FRAMEWORK
Paul M. Meaney, Ph.D. and Keith Paulsen, Ph.D.
1
INTRODUCTION
All of the imaging modalities discussed in this book require unique numeri-cal algorithms and data acquisition hardware. However, they also share a good deal of algorithmic common ground. The Dartmouth Breast Imaging Group has therefore articulated a shared numerical-analysis framework for these modalities. This framework facilitates communication between teams working on different modalities while being flexible enough to allow for needful variations, especially as dictated by the data-acquisition requirements of each modality.
In all four modalities, imaging requires the solution of an inverse prob-lem. That is, measurements are made of some physical process (e.g., micro-waves, infrared light, or mechanical vibrations) that interacts with the tissue, and from these external recordings the two- or three-dimensional distribution of physical properties of the tissue (dielectric properties, optical absorption coefficient, elasticity) is estimated using numerical algorithms.
displacement information at each voxel within the target using magnetic resonance imaging techniques.
Because x-rays propagate in nearly straight lines through tissue, in CT an attenuation coefficient can be assigned directly to each pixel. The inverse solution for these attenuation coefficients requires only linear matrix opera-tions. For the imaging modalities treated in this book, however, the inverse problem is nonlinear, because the physical interactions do not occur along straight lines but rather are distributed essentially throughout the imaging field-of-view. As a result, the measured response is not a linear function of tissue properties and iterative numerical methods are required to solve the in-version problem.
We have chosen to apply a well-known iterative technique, the Gauss-Newton method, to the solution of this suite of nonlinear inverse problems [1]. We estimate the spatial distribution of the tissue’s physical properties; calculate the response that would be observed, given this distribution (i.e., solve the “forward problem”); compare these calculated observations to the actual data; and update the estimated property distribution accordingly. This process is iterated until the real and calculated observations converge, whereupon the estimated distribution is taken as the desired image.
2
FORWARD PROBLEM
2.1
Field Equations
Our finite-element approach requires that the measurable physical phenome-non of interest (e.g., electromagnetic waves) must be governed by a partial differential equation. Listed below are the model equations for the four mo-dalities, along with the tissue properties associated with the measurable re-sponses.
1. Helmholtz wave equation (MIS). For sinusoidal electromagnetic waves in source-free regions, Maxwell’s equations reduce to the homogeneous Helm-holtz wave equations [2]. In particular, the electric-field component E of a sinusoidal electromagnetic wave obeys
electrical properties (e.g., tissue), varies locally. Its spatial variation throughout the breast is the quantity we are interested in imaging in MIS.
2. Diffusion equation (NIS). The diffusion equation for an absorptive, scat-tering, linearly anisotropic optical medium is
where is the photon fluence, is the speed of light in the medium, is the intensity of an isotropic light source, and D is the diffusion coefficient, which is a function of the absorption and reduced scattering coefficients and i.e., The diffusion coefficient is the locally-varying physical quantity of interest in this modality.
3. Laplace’s equation (EIS). In any charge-free region in a dielectric me-dium, the voltage (potential) at every point is governed by Laplace’s equa-tion:
Here, is the voltage and the medium has electrical permittivity and conductivity Laplace’s equation is an appropriate relationship for EIS be-cause the EIS system operates at frequencies several orders of magnitude below those used by the MIS system (a realm where the Helmholtz equation applies). As in MIS, the electrical properties of the tissue ( and ) are the physical quantities of interest.
4. Navier’s equation (MRE). The governing differential relationship for the MRE modality is Navier’s equation, which is in essence a multidimensional generalization of Hooke’s Law of linear elasticity. Navier’s equation de-scribes the displacement field inside an elastic body subject throughout to stress and strain as follows:
(presumed here to vary throughout the medium as scalar fields), and is the density. The properties of interest are the moduli and (and possibly ).
For all modalities we have focused on the frequency-domain version of the problem; that is, we have assumed a periodic time variation of the form for all nonconstant quantities and have solved the resulting steady-state system. An equally valid time-domain solution could be obtained on identical FE meshes by modeling the evolution of the system through time, but we have chosen the frequency-domain approach for the three tomographic mo-dalities (MIS, NIS, EIS) because of limitations imposed by hardware cali-bration procedures and the advantages of exploiting the frequency-dispersion characteristics of the propagating media.*
For MRE, likewise, data are acquired at only a single mechanical-excitation frequency. Acquiring data at multiple mechanical mechanical-excitation fre-quencies is possible but would be time-consuming using current methods.
2.2
Numerical Solution Framework
There are a number of numerical approaches for computing the electromag-netic fields or mechanical displacements throughout an inhomogeneous me-dium. These include finite elements, finite differences, method of moments, finite-difference time domain, and others [3–6]. Each has merits, but the fi-nite element (FE) method is particularly useful for our purposes.
The FE method approximates a continuous medium as a mesh of po-lygonal or polyhedral elements with shared vertices (the nodes of the mesh). These elements are usually triangular (in 2D problems) or tetrahedral (in 3D problems). A basis function is centered on each node, and the physical phe-nomenon of interest is modeled at every point in the region of interest as a weighted sum of these basis functions. For an N-node mesh, this entails the solution of a matrix equation of the form where [A] is
N × N; however, because the basis function associated with each node is nonzero only over those finite elements which contain that node, [A] is sparse (populated with zeroes except near the diagonal) and therefore ame-nable to iterative and/or banded-matrix solutions. This eame-nables important ef-ficiencies in storage and computation [7]. Furthermore, the nodes of an FE mesh can be placed arbitrarily, allowing accurate modeling of irregular
ob-* Time-domain signals could be synthetically derived from frequency data by fast Fourier
ject contours and increased node density in areas where the fields to be mod-eled vary rapidly [4].
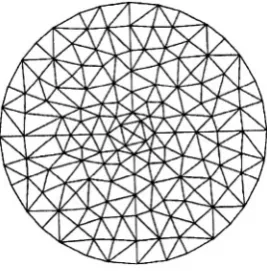
In the two-dimensional case (readily generalizable to three dimensions), we consider the physical phenomenon of interest (i.e., waves propagating through the image region) as a scalar field, (readily generalizable to a vector field). is defined over an area covered by a mesh of finite elements (Figure 1).
Figure 1. A two-dimensional finite-element mesh composed of several hundred triangular elements. In this particular mesh, each node (element vertex) is shared by as many as eight or as few as two elements.
Let be the differential equation (e.g., Laplace’s) for which is the exact solution and for which some to be de-termined, is an approximate solution over an FE mesh having N nodes.
is defined as the sum of N “basis functions,” that are weighted by N constants,
The are known and the N coefficients are unknown.
In general, the nonzero “residual” or error that results from substituting for the exact solution To minimize R,
that is, to find the best possible we use the weighted residual
Substituting N different weighting functions into (2.6) produces N
equations in the N unknowns
Several simplifications can be made. First, each Lagrangian basis func-tion can be chosen to be nonzero only over those mesh elements of which the ith node is a vertex. Within each triangular finite element, there-fore, only three are nonzero and (2.5) simplifies to
where n is a local index denoting the three vertices of the element,
is the basis function centered on node n, and is the coefficient for (see Figure 2).
Figure 2. A triangular finite element. A coefficient and linear basis function are associated with each node. Each is nonzero over this element and over all other elements of which its node is a vertex.
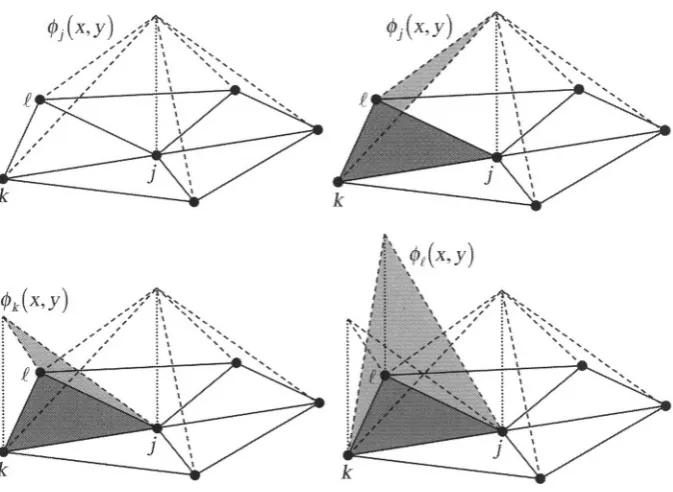
Figure 3. Relationship of piecewise-linear basis functions to triangular FE mesh elements. Top left: the piecewise-linear basis function that is centered at node j, is shown over its whole domain (in this case, five elements). Its peak value is 1. Top right: The portion of that overlaps element (dark gray).
Bottom left: The portion of that overlaps element Bottom right: The portion of that overlaps element All other basis functions are zero over this element.
Third, the N basis functions used to form in (2.5) are em-ployed as the N weighting functions When the weighting functions are equal to the basis functions, the resulting weighted-residuals method is termed the Galerkin method.
in the residual R, and for linear on the element interior. (Tech-nically, (2.8) generates an integrable singularity at the boundaries between elements because of the discontinuity in at element interfaces.) The dis-appearance of all second-derivative terms from R can be resolved by gener-ating a weak form of (2.6) that has lower continuity requirements on resulting derivative terms. When a basis function is used as the weighting function in (2.6) (i.e., when the Galerkin method is used), second deriva-tives like those in (2.8) give rise to
We apply Green’s identity to (2.9). In the two-dimensional case, Green’s identity states that for any two scalar functions u and v continuous on some domain with boundary C,
where dS is a differential segment of C and (i.e., the nor-mal derivative) [4]. This yields
where designates integration over the problem domain (In the three-dimensional case, designates volume integration and the contour integral becomes a surface integral.) Equation (2.11) contains derivatives of at most first order in both integral terms, sidestepping the problem of vanishing (sin-gular) second-order derivatives. Another advantage of (2.11) is the appear-ance of the boundary integral, which is represented in terms of the natural boundary conditions expressed as the flux of the field through the enclosing surface.
Matrix [A] is N × N and contains terms dependent on the governing
equa-tion. The vector of basis-function coefficients, is the quantity to be computed. The entries in {b}, which account for forcing
func-tions (i.e., external inputs to the system) and boundary condifunc-tions, arise dur-ing evaluation of the contour integral in (2.11). Matrix [A] is sparse due to the localized nature of the basis functions, lending itself to efficient matrix-factorization routines [8] and/or iterative solvers.
Boundary conditions vary among modalities. For instance, the NIS and EIS approaches utilize mixed boundary conditions with
Here, A and B are known constants and n is the unit normal vector oriented outward at the boundary [9]. The MRE approach applies either a Dirichlet or Neumann boundary conditions, depending on the physics of the mechanical vibration apparatus being used [4]. The MIS approach eliminates the need for approximate radiation boundary conditions by implementing a hybrid ele-ment method in which the FE method described above is used for the imag-ing zone and a boundary element (BE) method is used for the surroundimag-ing medium (i.e., in the breast-imaging setup, a homogeneous liquid in which the breast is immersed) [10]. The methods used to cope with boundary condi-tions are discussed in detail in the chapters devoted to the individual imaging modalities.
3
INVERSE PROBLEM
3.1
Gauss-Newton Iteration
The forward solution described above computes the spatial variation of an external observable (e.g., electric field) based on a given tissue-property dis-tribution, governing equation, boundary conditions, and source terms. The
inverse solution estimates the property distribution given the governing equation, boundary conditions, source terms, and measurements of the exter-nal observable. For all modalities considered in this book, the forward prob-lem is linear and the inverse probprob-lem nonlinear [1, 4]. That is, the tissue properties to be estimated depend nonlinearly on the observable.
property distribution and solves the forward problem based on this initial distribution. It then compares this solution with the measured data (as speci-fied below) and solves a linearized approximation of the inverse problem to obtain a new estimate of the property distribution. This procedure is iterative: the property-estimate updating is repeated until the algorithm converges to an optimal least-squares fit of modeled data to measured data.
We employ an iterative Newton algorithm defined by
Here, is the estimate of the material property distribution at the vth itera-tion, is the updated estimate, and is the derivative of with re-spect to [11]. The functional is defined in terms of a cost function,
G, that expresses the difference between the measured and modeled data at each iteration:
Here, vectors and are the computed (i.e., forward-solution) and measured values, respectively, of the observable quantity of interest at the measurement sites. Both are long, where is the num-ber of different excitations and is the number of measurement sites per observation. (For example, in an imaging region surrounded by 16 micro-wave antennas, one of which transmits at any given time while the others re-ceive, and ) Furthermore, vectors and are all L long, where L is the number of material parameter values to be reconstructed. L is not necessarily equal to N, the number of nodes in the mesh used to model the observable phenomenon of interest; see discussion of the dual mesh scheme in the next section.
Matrix is (M × O) × L and is termed the Jacobian matrix, [J], In-serting (2.17) into (2.14) and rearranging produces (in matrix notation)
where Multiplying both sides by we have
We wish to calculate the update vector which, with gives at the new iteration. The entries of are known and the entries of are computed using by the forward-solution method described earlier. Therefore, the only term of (2.19) still needed is [J]. We obtain this by differentiating (2.12) with respect to Vector {b} contains only bound-ary and forcing information; it is therefore not a function of and
After rearranging,
Furthermore, [A] and are computed at each iteration as part of the forward solution. Thus, only is needed to solve (2.20) for The details of computing and differ among the imaging modalities (see [12] and other chapters in this book). In Section 3.3, a closer look is taken at the method used for one particular mo-dality (MIS).
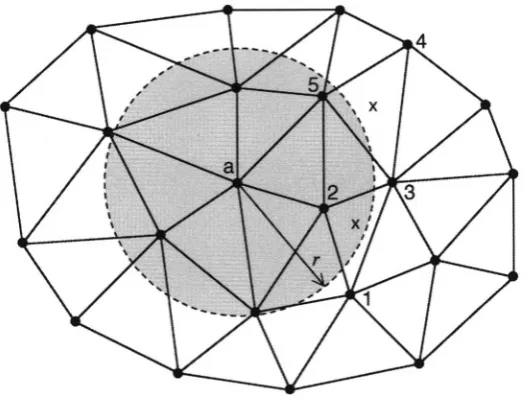
A few of the computational techniques required for the efficient solution of the inverse problem will now be discussed, including the dual mesh scheme, the adjoint technique, and zone iterative reconstruction.
3.2
Dual Mesh Scheme
The system is rank N, but the dimension of the property dis-tribution vector need not be N. We have exploited this fact to develop a
![Figure 2. The presence of displacement data throughout global domain havingboundary allows the composition of a well-posed boundary problem on subzonedomainhaving boundary Figure is after [4].](https://thumb-ap.123doks.com/thumbv2/123dok/4032718.1976138/74.428.136.298.361.465/figure-presence-displacement-havingboundary-composition-boundary-subzonedomainhaving-boundary.webp)