Scimago Journal & Country Rank
Home Journal Rankings Country Rankings Viz Tools Help About Us
Developing Economies
Country United States
20
H Index Subject Area and
Category Economics, Econometrics and FinanceEconomics and Econometrics Social Sciences
Development Publisher Wiley-Blackwell Publication type Journals
ISSN 17461049, 00121533 Coverage 1970, 1976, 1978-ongoing
Scope The Developing Economies is the o cial journal of the Institute of Developing Economies, JETRO, and publishes original research articles dealing with empirical and comparative studies on social sciences relating to the developing countries. (source)
Enter Journal Title, ISSN or Publisher Name
Quartiles
The set of journals have been ranked according to their SJR and divided into four equal groups, four quartiles. Q1 (green) comprises the quarter of the journals with the highest values, Q2 (yellow) the second highest values, Q3 (orange) the third highest values and Q4 (red) the lowest values.
Category Year Quartile
The SJR is a size-independent prestige indicator that ranks journals by their 'average prestige per article'. It is based on the idea that 'all citations are not created equal'. SJR is a measure of scienti c in uence of journals that accounts for both the number of citations received by a journal and the importance or prestige of the journals where such citations come from It measures the scienti c in uence of the average article
Citations per document
This indicator counts the number of citations received by documents from a journal and divides them by the total number of documents published in that journal. The chart shows the evolution of the average number of times documents published in a journal in the past two, three and four years have been cited in the current year. The two years line is equivalent to journal impact factor
™ (Thomson Reuters) metric.
1997 1999 2001 2003 2005 2007 2009 2011 2013 2015
Development
Economics and Econometrics
1999 2002 2005 2008 2011 2014
Cites per document Year Value Cites / Doc. (4 years) 1999 0.119 Cites / Doc. (4 years) 2000 0.260 Cites / Doc. (4 years) 2001 0.311 Cites / Doc. (4 years) 2002 0.232 Cites / Doc. (4 years) 2003 0.397 Cites / Doc. (4 years) 2004 0.270 Cites / Doc. (4 years) 2005 0.377 Cites / Doc. (4 years) 2006 0.369 Cites / Doc. (4 years) 2007 0.463 Cites / Doc. (4 years) 2008 0.532 Cites / Doc. (4 years) 2009 0.575
Total Cites Self-Cites
Evolution of the total number of citations and journal's self-citations received by a journal's published
documents during the three previous years.
Journal Self-citation is de ned as the number of citation from a journal citing article to articles published by the same journal.
Cites Year Value Self Cites 1999 1
External Cites per Doc Cites per Doc
Evolution of the number of total citation per document and external citation per document (i.e. journal self-citations removed) received by a journal's published documents during the three previous years. External citations are calculated by subtracting the number of self-citations from the total number of citations received by the journal’s documents.
Cites Year Value
% International Collaboration
International Collaboration accounts for the articles that have been produced by researchers from several
countries. The chart shows the ratio of a journal's documents signed by researchers from more than one country; that is including more than one country address.
Year International Collaboration 1999 0.00
Citable documents Non-citable documents
Not every article in a journal is considered primary research and therefore "citable", this chart shows the ratio of a journal's articles including substantial research (research articles, conference papers and reviews) in three year windows vs. those documents other than research articles, reviews and conference papers.
Documents Year Value
Cited documents Uncited documents
Ratio of a journal's items, grouped in three years windows, that have been cited at least once vs. those not cited during the following year.
Documents Year Value Uncited documents 1999 53 Uncited documents 2000 41 Uncited documents 2001 45 Uncited documents 2002 44
←Show this widget in your own website
Just copy the code below and paste within your html code:
<a href="http://www.scimagojr.com/journalsearch.php?q=14089&tip=sid&exact=no" title="SCImago Journal & Country Rank"><img border="0" src="http://www.scimagojr.com/journal_img.php?id=14089" alt="SCImago Journal & Country Rank" /></a>
0.2 0.4 0.6 0.8
1999 2002 2005 2008 2011 2014
0 20 40
1999 2002 2005 2008 2011 2014
0 0.3 0.6 0.9
1999 2002 2005 2008 2011 2014
0 25 50
1999 2002 2005 2008 2011 2014
0 40 80
1999 2002 2005 2008 2011 2014
Developed by: Powered by:
Follow us on Twitter
SOURCES OF PRODUCTIVITY GAINS FROM FDI IN
INDONESIA: IS IT EFFICIENCY IMPROVEMENT OR
TECHNOLOGICAL PROGRESS?
SUYANTO1andRuhulA. SALIM2
1Faculty of Economics, University of Surabaya, Surabaya, Indonesia; and2School of Economics
and Finance, Curtin Business School, Curtin University, Perth, Australia
First version received September 2009; final version received June 2010
This article investigates the spillover effects of foreign direct investment (FDI) on productivity growth in the Indonesian food-processing (ISIC 311) and electrical machinery industries (ISIC 383). Total factor productivity (TFP) growth is decomposed into efficiency change and technological change by using the Malmquist productivity index. The empirical results show that efficiency improvement is the major driver of TFP growth in the food-processing industry, whereas technological progress is the dominant contributor in the electrical machinery industry. There are positive spillovers on efficiency change but negative spillovers on technological change in the food-processing industry. However, FDI spillovers turn out to be negative in efficiency change while positive in technological progress in the electrical machinery industry. These findings demonstrate that different industries experience different sources of productivity gains, which are dependent on the characteristics of firms in the industry.
Keywords: FDI; TFP growth; Efficiency change; Technological change JEL classification: D24, F21deve_115450..472
I. INTRODUCTION
P
olicy makers in developing countries compete actively for foreign directinvestment (FDI). A range of incentive packages are provided, such as tax exemptions, investment allowances, and permission to repatriate profits, among other benefits. Competition arises partly because of externalities generated from the presence of multinational companies (MNCs) in the recipient economies (Blomström and Kokko 2003). MNCs, which are believed to be among the most knowledge-advanced firms, establish subsidiaries in the host countries and transfer
We are grateful to the anonymous referees and the editor of this journal for valuable comments and suggestions, which have tremendously improved the quality of this paper. However, all errors remaining are ours.
The Developing Economies48, no. 4 (December 2010): 450–72
© 2010 The Authors
The Developing Economies © 2010 Institute of Developing Economies
beneficial knowledge to domestic firms via nonmarket mechanisms, raising pro-ductivity. These productivity gains are generally known as productivity spillovers from FDI.
The common perception regarding FDI productivity spillovers is that produc-tivity gains exclusively take the form of technological progress. In other words, knowledge brought by MNCs is often related solely to technology, such as product and process knowledge. Hence, the policies in favor of FDIs focus mainly on efforts to extract new technological knowledge. These policies might be misguided since the knowledge from MNCs can also be in the form of managerial or orga-nizational knowledge, which may contribute to domestic firms’ efficiencies. While technological knowledge may leak to domestic firms through demonstration effects and induce technological progress (Das 1987; Glass and Saggi 2002), managerial and organizational knowledge can spill over through worker mobility and generate efficiency improvements (de Mello 1997; Kaufmann 1997; Kokko and Kravtsova 2008). Both technological progress and efficiency improvements are parts of productivity growth, but they are technically distinct.1
Unfortunately, existing literature on FDI rarely focuses on efficiency improve-ments from FDI spillovers. Earlier theoretical literature, such as Caves (1971), does mention the possibility of FDI generating spillover effects on domestic firms’ efficiencies. However, difficulties in measurement and the relative unavailability of data prevent further empirical testing of this argument. Recently, significant and sophisticated methodological developments in productivity literature, in particular contemporary methods for decomposing productivity growth, may be seen as a bridge for testing FDI spillover effects on different components of productivity growth. This article, as one of the first attempts in this direction, aims to clarify the impact of foreign presence on domestic firms’ productivity in the form of techno-logical change and efficiency change by using unique panel data from the Indonesian food-processing (ISIC 311) and electrical machinery industries (ISIC 383) from 1988 to 1995. It contributes to the Indonesian literature through exami-nation of not only technological change but also efficiency change. To disentangle these two sources of productivity growth, a non-parametric decomposition tech-nique, the Malmquist productivity index (MPI), is applied. Panel data analysis is employed to test the impact of FDI spillovers on each component of productivity growth.
The rest of this paper proceeds as follows: Section II provides the empirical setting followed by a brief review of related literature in Section III. Section IV describes the estimation strategy and models followed by a description of data
1 Kalirajan and Shand (1999) provide an excellent discussion about these two distinct components of
productivity growth. In addition, Salim and Kalirajan (1999) demonstrate that these two distinct components can be estimated empirically using firm-level data.
productivity gains from fdi in indonesia 451
sources and sample characteristics in Section V. Section VI decomposes produc-tivity growth for both foreign and domestic firms in the two subsectors and estimates the impact of FDI spillovers on each component of productivity growth (i.e., efficiency change and technological change). Conclusions and policy impli-cations are presented in the final section.
II. THE EMPIRICAL SETTING
There has been a huge inflow of FDI into the Indonesian manufacturing sector over the last three decades. More than 50% of the total approved FDI has flowed to this sector from 1975 to 2005 (Indonesia Investment Coordinating Board 2007). From the manufacturing sector, two disaggregated subsectors, food-processing (ISIC 311) and electrical machineries industry (ISIC 383) have been chosen as industrial cases.
Focusing on firms in these two subsectors rather than on all firms in the manufacturing sector provides a more detailed picture of FDI spillover effects on different industries. In a recent survey article, Javorcik (2008) points out that sectoral characteristics are an important factor for productivity spillovers from FDI. Different industrial subsectors tend to differ in their ability to absorb knowl-edge externalities from foreign firms. Therefore, FDI productivity spillovers may be evident in one subsector but not in others.
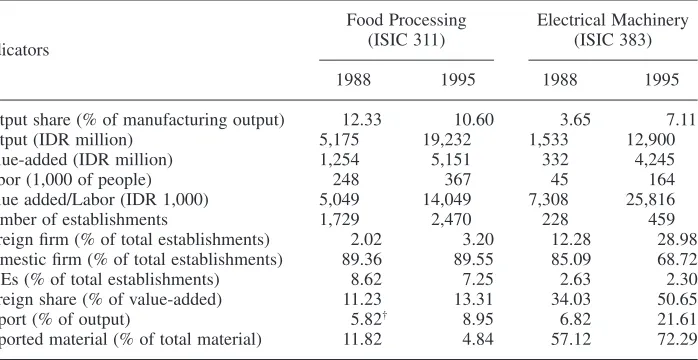
Within the industrial sector, food processing is a major industry in terms of contribution to total manufacturing value added and employment, whereas elec-trical machinery is the most sophisticated and one of the fastest growing industries in Indonesia. For example, in 1988, the value added from food manufacturing and electrical machineries were 9.03% and 2.40%, respectively (out of 28 three-digit manufacturing industries), and in 1995, these figures increased to 10.63% and 8.49%, respectively (BPS 1989, 1996). Moreover, foreign share in value added also increased rapidly in these industries, from 11.23% for food manufacturing and 34.03% for electrical machineries in 1988 to 13.31% and 50.65%, respectively, in 1995. Consequently, these two industries provide suitable cases for FDI spillover analyses.
Furthermore, disaggregated industries are devoid of heterogeneity in data. As argued by Bartelsman and Doms (2000), large and persistent heterogeneity exists across firms even within a sector. By focusing on two disaggregated subsectors, problems related to data heterogeneity are minimized. Finally, the two chosen subsectors are usually classified as having different technological levels. The Organisation of Economic Co-operation and Development (OECD), for example, classifies food products as a low-technology industry, while it groups electronics and electrical machineries as high-technology industries (see, for example, Hatz-ichronoglou (1997) for the OECD technology-intensity classification). Therefore,
452 the developing economies
© 2010 The Authors
it is expected that these two subsectors may experience different sources of pro-ductivity gains from FDI.
A. The Indonesian Food-Processing Industry
Food processing is one of the important nature-based industries in Indonesia. It is a rapidly growing industry, relying largely on local raw materials to produce outputs to meet domestic needs (Sjöholm and Takii 2008). This industry covers a wide variety of products, among which dairy products, cooking oils, fruit products, grain milling, fish and seafood, noodle, sugar, tea, and coffee processing are important. It represents a broad and diverse sector in terms of the nature of industry, size of investment, level of technology, raw material used, and workforce employed.
The Indonesian food-processing industry expanded rapidly throughout the period of study. Although its contribution to total manufacturing outputs has decreased slightly, the value of output has risen more than threefold, from around IDR 5.2 billion in 1988 to IDR 19.2 billion in 1995 (Table 1). The expansion of this industry also reflects a rapid, almost quadruple, increase of value added. In terms of labor absorption, this sector employed 248,000 workers in 1988 and 367,000 workers in 1995, which accounted for approximately 12% of total manufacturing employment. This sector also recorded a significant increase in labor productivity
TABLE 1
Some Key Indicators of Food Processing and Electrical Machinery Industries
Indicators
Food Processing (ISIC 311)
Electrical Machinery (ISIC 383)
1988 1995 1988 1995
Output share (% of manufacturing output) 12.33 10.60 3.65 7.11
Output (IDR million) 5,175 19,232 1,533 12,900
Value-added (IDR million) 1,254 5,151 332 4,245
Labor (1,000 of people) 248 367 45 164
Value added/Labor (IDR 1,000) 5,049 14,049 7,308 25,816
Number of establishments 1,729 2,470 228 459
Foreign firm (% of total establishments) 2.02 3.20 12.28 28.98 Domestic firm (% of total establishments) 89.36 89.55 85.09 68.72 SOEs (% of total establishments) 8.62 7.25 2.63 2.30 Foreign share (% of value-added) 11.23 13.31 34.03 50.65
Export (% of output) 5.82† 8.95 6.82 21.61
Imported material (% of total material) 11.82 4.84 57.12 72.29
Source: Author’s calculation from the survey of large and medium enterprises, selected years.
†This figure is calculated from 1990 data since this was the first year information on exports
was reported.
productivity gains from fdi in indonesia 453
during the period of study, as can be observed from the change in magnitude of value added per labor. Private domestic firms are dominant in this industry, accounting for more than 80% of the total firms in the sector, whereas state-owned enterprises (SOEs) represented only 8.62% of total firms in 1988. Foreign contri-butions to value added for this industry are more than 10%, even though foreign firms make up less than 4% of the total number of firms in the sector. This indicates the important role of foreign firms in this industry. During the period of study (1988–95), this sector became less reliant on imported material, whereas the percentage of output exported increased moderately, from 5.82% to 8.95%.
B. The Indonesian Electrical Machinery Industry
The electrical machinery industry is a relatively small industry in terms of number of establishments, but it has expanded rapidly during the observed period. The value of output jumped from only IDR 1.5 billion in 1988 to more than IDR 12 billion in 1995 (Table 1). This industry is one of the high-technology industries, and has been a targeted sector for foreign direct investment. In 1988, foreign-owned firms represented more than 12% of total firms in this industry and this number rose to 29% by 1995. Interestingly, foreign contributions in this sector amounted to more than 50% of the total value added in 1995, revealing the important role of foreign investment. As shown in Table 1, this sector relies heavily on imported materials, with a share of more than 70% of total materials used in 1995. However, the percentages of output exported also increased considerably from 6.82% in 1988 to 21.61% in 1995, more than tripling.
The electrical machinery industry is a homogenous industry in terms of tech-nology. This industry covers electrical machinery for industries and electrical appliances for household use. The productivity of labor in this industry is among the highest for subsectors of the manufacturing sector, with value added per labor of IDR 7.3 million in 1988 and IDR 25.8 million in 1995.
III. LITERATURE REVIEW
A. FDI, Knowledge Transfer, and Productivity Spillovers
Multinational companies (MNCs) are commonly believed to possess greater knowledge than local firms. Theoretical literature on FDI argues that for MNCs to be able to compete with their local counterparts, the former need to have specific knowledge advantages, which are defined broadly as superior technology, advanced managerial skills, and the ability to exploit scale efficiency (Smeets 2008). These knowledge advantages may enable MNCs to access domestic product and resource markets. Although local firms might have more information about consumer preferences and local networks, the superior knowledge of MNCs can be a competitive advantage to winning a greater market share.
454 the developing economies
© 2010 The Authors
To ensure a competitive advantage, MNCs frequently need to transfer knowl-edge to their subsidiaries. This transferred knowlknowl-edge may generate positive effects to host economies through two distinct processes: direct knowledge transfer from MNC parents to subsidiaries in host economies; and indirect knowledge externalities from MNC subsidiaries to domestic firms. The latter, known as an FDI spillover effect, has been argued to be an important contribution to host economies, for it generates productivity improvements to domestic firms (see, for example, Javorcik 2008).
Theoretical literature identifies three main channels for productivity spillovers. First, the presence of MNCs in domestic markets may provide demonstration effects to domestic firms through direct imitation or innovation and development (Das 1987; Cheung and Lin 2004; Lin and Chuang 2007). Second, the entry of MNC subsidiaries to host economies may increase market competition and force domestic firms to utilize their resources more efficiently (Wang and Blomstrom 1992). Third, productivity spillover may occur when workers trained by MNCs move to domestic firms or establish their own companies and apply the knowledge to improve productivity (Fosfuri, Motta, and Ronde 2001).
These three channels of FDI spillovers have been empirically examined in a number of studies using either cross-sectional or panel data. The cross-sectional industrial studies provide more optimistic evidence regarding positive FDI spill-overs on domestic firms’ productivity. Among them are Caves (1974), Globerman (1979), Blomström and Sjöholm (1999), Driffield (2001), and Dimelis and Lauri (2002). In contrast, panel data firm-level studies provide mixed evidence. Some identify positive productivity spillovers (Gorg and Strobl 2005; Kugler 2006; Blalock and Gertler 2008; Suyanto, Salim, and Bloch 2009). Others show no evidence of spillovers (Haddad and Harrison 1993; Konings 2001) and some even find negative productivity spillovers from FDI (Aitken and Harrison 1999; Djankov and Hoekman 2000; Thangavelu and Pattnayak 2006). Thus, the spillover effect of FDI on domestic firms’ productivity is still a subject of debate. The present study is an attempt to contribute to this debate by using disaggregated industries from a developing country.
B. FDI Spillover to Sources of Productivity Growth
Recent empirical studies on FDI spillovers focus on productivity growth instead of productivity level. As argued by Liu (2008), evaluating FDI on productivity levels may not yield evidence of positive spillovers, as it depicts only the short-run effects. Estimating FDI on productivity growth can provide clearer evidence of positive spillovers, as the long-run effects are captured. Haskel, Peirera and Slaugther (2007) present similar concerns that investigating FDI effects on the rate of productivity, which can be measured from the first difference of productivity level, may provide dynamic effects of FDI on the productivity growth of domestic firms.
productivity gains from fdi in indonesia 455
A number of empirical studies have been conducted in the context of FDI spillover effects on productivity growth. These studies can be divided into two kinds, based on the method of analysis: studies that adopt a conventional measure of total factor productivity (TFP) growth, and those that use a decomposition analysis. The first kind examine FDI spillovers on TFP growth under a conven-tional production function, with a primary focus on technological progress, as they assume that a firm produces at full efficiency or capacity. The second kind inves-tigate FDI spillovers on components of TFP growth, as the assumption of full efficiency is relaxed and productivity gains from FDI can be identified through technology and efficiency.
The authors know only two studies of the second kind. Girma and Gorg (2007) is perhaps the first study evaluating FDI spillovers on components of TFP growth. Applying the Divisia index for decomposing TFP growth into technology and scale efficiency for UK manufacturing, they find that FDI productivity spillovers mainly stem from technology. In this study, FDI effects on efficiency gains are found to be insignificant. A contrasting finding is obtained by Kravtsova and Zelenyuk (2007) in the Ukrainian manufacturing sector. By decomposing TFP growth into effi-ciency and technology using a non-parametric data envelopment analysis (DEA)– based MPI, they find evidence of positive FDI spillovers on both technology and efficiency. They demonstrate that knowledge from FDI can be either process and product knowledge, which generates technology spillovers, or managerial and organizational knowledge, which induces efficiency spillovers.
From the findings of these previous studies, there is still no consensus regarding which sources of productivity gains are mainly obtained by domestic firms from foreign presence (MNCs). The mixed evidence may be because firms in different economies or different industries have different capabilities of grasping different sources of productivity gains. Firms in a certain industry may receive efficiency gains while those in another industry may obtain technology gains. As a contribu-tion to the literature, particularly the Indonesian literature, this study examines FDI spillover effects on sources of productivity growth in the Indonesian food-processing and electrical machinery industries. This study may help to reconcile controversy surrounding the findings of previous studies.
IV. MODEL SPECIFICATION AND ESTIMATION PROCEDURE
The estimation procedure in this present paper involves two stages. The first stage is to decompose TFP growth into efficiency change (EC) and technological change (TC) using a DEA-base MPI. In the second stage, the calculated time-variant firm-specific EC and TC indexes are used interchangeably as a dependent variable in panel data regressions on the FDI-spillover variable. From the estimates, the spillover effects of FDI can be identified from the sign and significance of the
456 the developing economies
© 2010 The Authors
spillover variable. If the coefficient of the spillover variable is positive and has a statistically significant effect on EC or TC, it is taken as evidence of positive spillovers. In contrast, the negative sign and significance of the spillover variable is taken as evidence of negative spillovers. If the coefficient is insignificant, regardless of whether it has a positive or negative sign, it is considered as evidence of no spillover.
To explain the decomposition of TFP growth using the MPI, suppose that firmi’s technology is observed in two periods, t=1, 2. The technology for these two periods is represented by x yi i x yi i
1 1 2 2
, ,
(
)
and(
)
, respectively. The output-oriented MPI, as introduced by Caves, Christensen, and Diewert (1982), can be defined as:M x y x y D x y
distance function that compares second-period firms to first-period technology,
DO1
(
x yi1, i1)
is a distance function for firm i at the first technological period, DO2(
x yi2, i2)
denotes a distance function for firm i at the second technologicalperiod, DO2
(
x yi1, i1)
is a distance function that compares first-period firms to thesecond-period technology,xiis the inputs of firmi, andyiis the outputs of firmi.
The right-hand side of equation (1) can be rewritten as:
M x y x y D x y
where the first part of the right-hand side of the equation measures the geometric mean of the technological change between two periods, evaluated atxt+1andxt, and
the second part measures the change in the output-oriented measure of Farrell’s (1957) technical efficiency between period t and t+1. Hence, the MPI is the product of the change in the change in technology (TC) that occurred in the same periods, and relative efficiency (EC) that occurred between period t and t+1, which can be written as:
M1 2O TCO1 2 x y x yi1 1i i2 i2 EC1 2O x y x y1i 1i i2 i2
productivity gains from fdi in indonesia 457
and
The time-variant firm-level MPI, TC and EC indexes are calculated using DEAP computer software.2The technological change (TC) and efficiency change (EC) obtained from equations (3) to (5) are used interchangeably as a dependent vari-able in a model for estimating the FDI spillovers on the sources of productivity growth. The empirical model can be written as:
Yit t, Spilloveri t, i t, it,
+1= a+ b+
g ζ (6)
whereY=(TC, EC),Spilloveris a spillover variable defined as in equation (7),a
andbdenote parameters to be estimated,gis a vector of other variables (age and
size) contributing toY,idenotes firm,tdenotes time, andzis random error. The fixed-effect specification is used to estimate equation (6). There are two reasons for choosing this specification for the empirical analysis. First, as the spillover effects of FDI depend on within-firm variation in the spillover variable (FDI_Spillovers), the fixed-effect specification helps to avoid the possibility of reverse causality (that industries with higher productivity growth may attract more FDI) by introducing firm dummies. Second, the fixed-effect specification can mitigate the impact of some forms of non-random measurement errors, such as a subsequent increase in the value of a certain variable used in equation (6). With these two advantages, the potential interference between FDI spillovers and pro-ductivity growth can be minimized.
V. MEASUREMENT OF VARIABLES AND DATA SOURCES
A. Measurement of Variables
There are two sets of variables used in the present study. The first set includes variables for decomposing TFP growth. These are output and input variables. Value added is used as an output variable, total number of workers is taken as a mea-surement for labor, and the replacement value of fixed assets is used as a proxy for capital. Output values are deflated using the average wholesale price index (WPI) at a constant price, while capital values are deflated using WPI for machinery.
2 The software is available from www.uq.edu.au/economics/cepa/. DEAP2.1 is developed by Coelli
(1996) at the Center for Productivity and Efficiency Analysis, Department of Econometrics, University of New England. This software is written in the Shazam language and can be operated using an IBM personal computer. Different instructions can be carried out by updating the existing command file or by writing a new instruction command.
458 the developing economies
© 2010 The Authors
The second set of variables includes productivity growth variables, a spillover variable, and other variables. The productivity growth variables are technological change (TC), efficiency change (EC), and total factor productivity growth (TFPG), which are obtained from the decompositions shown in equations (3) to (5). Each of the productivity variables is used interchangeably as a dependent variable in the panel data regression model of equation (6). A spillover variable is measured following Blalock and Gertler (2008), which is defined as:
Spillover where Y is gross output,Fis a dummy variable for foreign firms (which takes a value of one if a firm has foreign ownership and zero if there is no foreign ownership),3idenotes theith firm,jdenotes thejth industry, andi"i∈jindicates a firm in a given industry. The spillover variable is measured at the three-digit ISIC industries. Thus, the value ofSpilloverincreases with the output of foreign firms in the three-digit industry. Equation (7) represents the ratio of foreign outputs to total outputs in an industry. When the foreign shares increase, the spillover effects increase. Other variables included in the second set are the age of the firm and the size of the firm. The age is measured as the difference between the year of survey and the year of starting production. The size of the firm is given by the number of workers in a firm as a fraction of the total number of workers in a three-digit industry.
B. Data Sources
The annual survey of Indonesian medium and large manufacturing industries (Statistik industri, or SI hereafter) is used as the main data source for this study. This survey is conducted by Statistics Indonesia (Badan Pusat Statistik or BPS)4 and provided in an electronic format. The survey covers the basic information of each establishment, such as its specific identification code, industrial classification, year of starting production, and location. It also covers the ownership information (domestic and foreign ownerships), production information (gross output, value
3 This definition implies that firms with a share of foreign ownership greater than 0% are grouped as
foreign firms. The definition follows previous studies on the Indonesian manufacturing industry, such as Aswicahyono and Hill (1995), Ramstetter (1999), Narjoko and Hill (2007), and Suyanto, Salim, and Bloch (2009).
4
Previously, BPS was Biro Pusat Statistik or Central Bureau of Statistics. Its current official name is Statistics Indonesia.
productivity gains from fdi in indonesia 459
added, number of workers, value of fixed capital, material, and energy consump-tion), and other information (share of production exported and value of material imported). As supplements to the SI data, this study also utilized other sources of data. The average whole price index (WPI) and the WPI for machinery are used as deflators for monetary values of output and capital, respectively.
The samples cover a balanced panel of 393 food-product firms and a balanced panel of 44 electrical machinery firms operating between 1988 and 1995 (3,496 observations).5The year 1988 was chosen as the starting year because it is the first year when the replacement values of capital were available. The year 1995 was used as the last year in order to exclude the period of economic crisis.
From the original data set, this study conducts two adjustments with the inten-tion of obtaining a consistent panel data set. The first adjustment is to remove errors and misreporting, which includes trimming out observations with negative and zero output values, adjusting the information regarding foreign share in each firm for consistency,6and excluding observations considered as outliers by cutting out values above the 98.5th percentile of output and below the 1.5th percentile. The second adjustment is to the capital data where 72 out of 3,496 observations (2.06%) reported missing values of capital. The missing values are predicted using a methodology similar to Vial (2006), as follows: the available capital values over the observed period are regressed on the corresponding output values and the estimated regression coefficients are then used to calculate the predicted values of capital. By applying this methodology, the final panel data set has consistent capital data.
The summary statistics of the final panel data set for the relevant variables is presented in Table 2. The production variables (value added, labor, and capital) are reported in natural logarithm values. The high mean value ofFDI_Spilloversin the electrical machinery industry results because of the large number of foreign firms in the sector. The large standard deviation ofAgein the food-processing industry
5 This paper usesfirmas synonymous withestablishment. The termsfirmandestablishmentare used
interchangeably for expositional convenience, but in all cases refer to the latter concept. There are two reasons for preferring theestablishmentconcept. Firstly, the data source (the annual survey of manufacturing establishments) does not provide, in every survey year, the information needed to identify whether an establishment is a standalone or one part of a multi-plant firm. Therefore the number of firms may be over-counted because some establishments are counted as firms when they are not. Secondly, Caves and Barton (1990) argue that observations at the establishment level, rather than the enterprise level, have an advantage in the application of the stochastic frontier method, in that it is more specialized in the activity observed.
6 In some firms, the information related to foreign share is sometimes not consistent over time. For
example, the foreign share for a firm may be reported as 100% for the whole observed period but in one year is reported as 0%. In this case, the 0% is adjusted to 100% for consistency.
460 the developing economies
© 2010 The Authors
TABLE 2
Summary Statistics of the Relevant Variables
Variable
Food Processing (ISIC 311) Electrical Machinery (ISIC 383) Mean Standard
Deviation Minimum Maximum Mean
Standard
Deviation Minimum Maximum First stage
Value added(ln) 13.0 2.2 7.5 17.8 13.5 2.1 5.2 19.2
Labor(ln) 4.9 1.4 2.8 8.2 4.8 1.1 3.0 7.6
Capital(ln) 13.5 2.3 6.1 24.5 13.9 2.1 7.8 24.4 Second stage
FDI_Spillovers(%) 11.5 7.1 2.2 37.2 48.6 12.9 29.3 69.4
Age 24 23.4 0 100 16.2 12.1 0 83
Size(%) 4.7 15.8 0.1 212 6.3 6.4 0.3 27.3 Source: Author’s calculation from the final data set.
productivity
gains
from
fdi
in
indonesia
461
©
2010
The
A
uthors
The
D
ev
eloping
Economies
©
2010
Institute
of
De
v
eloping
is caused by large difference in ages between old and new firms. Some firms in this sector have been operating for 100 years while some firms have only been in production for a few months.
VI. ESTIMATION RESULTS AND ANALYSIS
A. Decomposition of TFP Growth
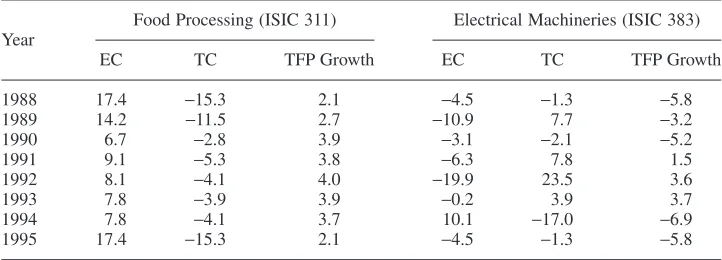
Using the DEA-based MPI as discussed in Section IV, TFP growth is decom-posed into two components: technological change (TC) and efficiency change (EC). The software DEAP 2.1, which is used for calculations, provides time-variant firm-specific indexes of TFP growth and the two components. The annual average industry-wise indexes are presented in Table 3.7
As can be seen from this table, TFP growth in food products (ISIC 311) is contributed mainly by efficiency change. In contrast, TFP growth in electrical machineries (ISIC 383) is predominantly driven by technological change. These findings are not surprising since food products are labor-intensive industries, which tend to increase their productivity through a learning-by-doing process of workers’ knowledge accumulation, whereas electrical machineries are capital-intensive industries, which depend crucially on updated technology to increase their
7
The time-variant firm-specific indexes are not presented in this paper due to space limitations but may be obtained from the author upon request.
TABLE 3
Decomposition of Average TFP Growth (Cumulative Percentage) of Food Processing and Electrical Machinery
Year
Food Processing (ISIC 311) Electrical Machineries (ISIC 383)
EC TC TFP Growth EC TC TFP Growth
1988 17.4 -15.3 2.1 -4.5 -1.3 -5.8
1989 14.2 -11.5 2.7 -10.9 7.7 -3.2
1990 6.7 -2.8 3.9 -3.1 -2.1 -5.2
1991 9.1 -5.3 3.8 -6.3 7.8 1.5
1992 8.1 -4.1 4.0 -19.9 23.5 3.6
1993 7.8 -3.9 3.9 -0.2 3.9 3.7
1994 7.8 -4.1 3.7 10.1 -17.0 -6.9
1995 17.4 -15.3 2.1 -4.5 -1.3 -5.8
Source: Author’s calculation using DEAP2.1
Note: EC=Efficiency change, TC=Technological change.
462 the developing economies
© 2010 The Authors
productivity. Margono and Sharma (2006) and Ikhsan (2007) find closely similar results, although their studies were conducted on more aggregated two-digit industries.
Furthermore, the cumulative average TFP growth is positive over the whole period of 1988 to 1995 for food products, while it is positive only in certain years (1991–93) for electrical machineries. This possibly indicates that food processing is a growing industry that has subsequently improved its production and process knowledge through producing a larger amount of outputs given a set of input combinations. For electrical machineries, the negative TFP growth may be explained by the fact that the domestic firms face high transaction costs in learning to “catch up” with new technologies, at least in the short run (Aitken and Harrison 1999; Liu 2008). Furthermore, negative effects may arise where firms, particularly in less developed economies such as Indonesia, use inferior production technolo-gies and low-skilled workers, which may contribute to a low absorptive capacity of domestic firms to benefit from FDI spillovers.
B. Estimation of FDI Spillovers on Sources of Productivity Growth
Table 4 presents estimates for FDI spillover effects on efficiency change (EC) and on technological change (TC) in the selected industries. The estimations are conducted on the full sample of all firms and the subsample of domestic firms. The results from the full sample are presented in the upper part of Table 4, while the results from the subsample are given in the lower part. The results from the full sample are used as a benchmark for interpretation in this section. The subsample results have similar sign and significance and therefore have similar implications to the results from the full sample.
The estimates of FDI spillovers on EC for the food-processing industry are reported in column (1), while the results of FDI effects on TC are portrayed in column (2). The numbers in parentheses in each column are t-statistics for the corresponding estimates. From column (1), the coefficient of FDI variable (FDI_Spillovers) is positive and statistically significant at the 1% level, suggesting FDI improves the efficiency of domestic firms. The possible explanation is that foreign entries in the food industry increase competition, which then forces domes-tic firms to increase their efficiency. This is consistent with the theoredomes-tical argument in Wang and Blomstrom (1992) and the empirical finding in Suyanto, Salim, and Bloch (2009), although this study focuses on the chemical industry.
In column (2), the negative and statistically significant coefficient of FDI_ Spilloversindicates negative technology spillovers from FDI. This might be because the gap in technology between domestic and foreign-owned firms is relatively large, so that the former are unable to adopt advanced technology from the latter. As argued by Findlay (1978), a certain level of technology is required for domestic firms to absorb modern technology from foreign-owned firms. Preconditions, such
productivity gains from fdi in indonesia 463
TABLE 4
Estimates of FDI Spillovers on Efficiency Change (EC) and Technological Change (TC) of Firms in Food-Processing and Electrical Machinery Industries
Variable
Food Processing (ISIC 311) Electrical Machinery (ISIC 383) All firms (Full sample)
FDI_Spillovers 0.243*** (3.23) -0.335*** (-3.20) -0.662*** (-5.63) 0.513*** (3.46)
Age -0.00013 (-0.67) -0.00030 (-1.14) -0.0055 (-0.58) -0.0012 (-1.05)
Size 0.090 (0.54) 0.505*** (6.55) 0.003 (0.01) 0.219 (0.30)
Constant Yes Yes Yes Yes
Time dummy Yes Yes Yes Yes
Firm dummy Yes Yes Yes Yes
R2 0.001 0.002 0.033 0.012
No. of observations 2,751 2,751 308 308 Only domestic firms
FDI_Spillovers 0.268*** (3.36) -0.373*** (-3.39) -0.686*** (-5.24) 0.564*** (3.47)
Age -0.00005 (-0.26) -0.00019 (-0.64) -0.00023 (-0.23) -0.0016 (-1.27)
Size 0.097 (0.57) 0.454*** (6.15) 0.370 (0.53) 0.382 (0.44)
Constant Yes Yes Yes Yes
Time dummy Yes Yes Yes Yes
Firm dummy Yes Yes Yes Yes
R2
0.001 0.002 0.027 0.016 No. of observations 2,561 2,561 266 266
Source: Author’s estimations using equation (6). Note: Thet-statistics are in parentheses.
*** represents statistical significance at the 1% level.
as a minimum level of technology and human capital operating the technology, may affect the capability of domestic firms to gain technological benefits from foreign firms. Another possible explanation may be that technology spillovers require domestic firms to use scarce resources for learning foreign technology, possibly resulting in lowering the technology level of domestic firms in the short run (Liu 2008). That is, the technological ability and effort expended by many of the domestic firms that compete with foreign firms is too low to be able to absorb spillovers when they occur in the short run.8
The estimates for FDI effects on EC and on TC in the electrical machinery industry are presented in column (3) and (4) of Table 4, respectively. An increase in foreign investment reduces the efficiency change of domestic firms in the industry, as can be seen from the negative and high significance of the FDI_Spill-overs variable in column (3). The implication of this finding is that there are negative spillover effects of foreign entry in the industry. This can be explained by the “market-stealing” hypothesis of Aitken and Harrison (1999), that foreign firms generally have a lower average cost, which allows them to reduce output prices in order to steal market share from domestic firms. With a smaller market share, domestic firms may experience an increase in average costs in the short term, as they have to produce a smaller amount of output with the same fixed costs. Hence, the negative effects of foreign competition tend to overshadow the demonstration effects, so that the net effects of foreign entries are negative. Furthermore, FDI often draws the best employees away from the domestic firms competing for the same market and thus reduces the production efficiency of the domestic firms as is the case in electrical machineries in Indonesia (Liu 2008).
An estimation of FDI spillovers on technical efficiency in the electrical machin-ery industry (column 4) provides a positive spillover for technical change. This indicates that the foreign firms’ presence in the electrical machinery industry generates technological improvement in all firms in the industry, including domes-tic firms. A possible explanation for this finding is that the new technology brought in by foreign firms to domestic markets generates imitation effects and innovation, which forces domestic firms to replicate the foreign firms’ technology and develop new processes and product knowledge through research and development. As the electrical machinery market is a homogenous industry, as noted in Section II, the process of imitation and innovation tends to be faster than in a heterogeneous industry, such as food processing. This finding supports the theoretical argument of Das (1987) and Cheung and Lin (2004) on the demonstration effect of technology spillovers.
In comparing the results of the food-processing industry and the electrical machinery industry, it is clear that these two industries receive different FDI
8 One of the anonymous referees highlighted this point.
productivity gains from fdi in indonesia 465
spillover effects. The food-processing industry is found to receive positive spill-over effects through changes to technical efficiency, while the electrical machinery industry tends to receive positive spillover effects through technological change. A difference in the factor intensity could be an explanation for the difference in the sources of spillovers in these two industries. The electrical machinery industry, with a high capital intensity, tends to more easily adopt and replicate new tech-nology and knowledge from foreign firms via a learning-and-doing process (Caves 1974; Wang and Blomstrom 1992) and by employing skilled labor trained by foreign firms (Kaufmann 1997; Fosfuri, Motta, and Ronde 2001), which leads to technological progress for the industry. In comparison, the food-processing indus-try, which has high labor intensity, might increase its ability to compete by producing a higher output with the existing set of inputs or producing a given output with lowered combination of inputs, which then leads to increases in the technical efficiency of firms (Kravtsova and Zelenyuk 2007).
For non-FDI variables, the coefficient ofAgeis negative and insignificant on EC and on TC for both the food-processing and the electrical machinery industries, indicating that age does not have a significant impact on efficiency change or on technological change for the two industries during the observed periods. In other words, old and new firms do not differ much in their capacity to embrace efficiency and technological change. An empirical study of firms in India (Kathuria 2000) also finds similar evidence that the age of firms does not significantly affect their efficiency and technology. Moreover, the coefficient of Size is positive from all estimations, but it is significant only in the estimation of TC in the food-processing industry.
C. A Lagged Effect and the Growth Effect of FDI Spillovers
In estimating FDI spillovers on productivity growth, two estimation issues emerge. The first issue relates to simultaneous bias, when the spillover variable is endogenous. In this case, the causal direction can go from productivity growth to foreign investments. FDI may be attracted to an industry with high productivity growth in order to gain greater profits (Liu 2008). Alternatively, foreign investors may choose to invest in a slow-growing industry in order to gain a greater com-petitive advantage (Haskel, Peirera, and Slaugther 2007). This causal direction suggests that the ordinary least squares (OLS) estimates in Table 4 may be biased upward or downward. Dealing with this issue, we re-estimate equation (6) by replacing FDI_Spillover with a lagged FDI_Spillover. As suggested by Haskel, Peirera, and Slaugther (2007), a lagged variable may be appropriate as spillover effects may take time to materialize. Foreign investments may be correlated with domestic productivity, but they are clearly uncorrelated with the future productiv-ity growth. Therefore, replacing the spillover variable with lagged spillover can minimize the simultaneous bias.
466 the developing economies
© 2010 The Authors
The second issue relates to omitted variables, where some factors may be unobserved by researchers but are known by the firm. These unobserved factors may increase the correlation between FDI spillovers and productivity growth, although they may not be directly correlated. For example, high-quality manage-ment may raise the productivity of a domestic firm and at the same time may also attract foreign investment. In this case, the OLS estimates in Table 4 could be biased upward. Addressing this issue, we apply a time-differencing on the spillover variable. Time-differencing may remove the firm-specific unobserved factor and, if it is sufficient, can minimize the omitted variable problem.
Table 5 presents the estimation results for both the lagged spillover and the time-differenced spillover.9 When the spillover variable is replaced by a lagged spillover (FDI_Spilloverst-1), the estimates are consistent with the results in the
baseline model. In the food-processing industry, the lagged spillovers are found to have a positive effect on efficiency change, but have a negative effect on techno-logical change. In the electrical machinery industry, the lagged spillovers are found to generate technological progress, but cause efficiency to deteriorate. The high significance of the lagged variable demonstrates that the spillover effects take time to materialize.
Replacing the spillover variable with its difference (DFDI_Spillovers), our esti-mates also confirm similar effects of FDI on firm-level efficiency and technology in both selected industries. The magnitude of spillover effects on efficiency and technology increase for the food-processing industry while they decrease for the electrical machinery industry. In addition, the significance remains at the same 1% level for the food-processing industry (column 4 and 5 of Table 5) and it slightly decreases for the spillover estimates in electrical machinery, which happens at the 10% level (the last two columns of Table 5). Nevertheless, the statistically signifi-cant estimate of DFDI_Spilloversin the two industries indicates that the omitted variable issue is minimal, if it is present at all, for the baseline estimates in Table 4.
VII. CONCLUSIONS AND POLICY IMPLICATIONS
This article empirically examines the spillover effects from FDI on efficiency change and technological change for domestic firms in the Indonesian food-processing and electrical machinery industries from 1988 to 1995. The non-parametric Malmquist productivity index combined with a fixed-effect panel regression is used to estimate the spillover effects in a two-stage methodology. The empirical results show that FDI generates positive spillovers on efficiency change,
9 Table 5 presents the estimations from a full sample. Estimations on the subsample provide similar
results in terms of signs and significance. Only the magnitudes of the coefficients become larger in some cases and smaller in other cases.
productivity gains from fdi in indonesia 467
TABLE 5
Estimates of Lagged FDI Spillovers and a Rate of FDI Spillovers on Efficiency Change (EC) and Technological Change (TC) in Food-Processing and Electrical Machinery Industries
Variable
Food Processing (ISIC 311) Electrical Machinery (ISIC 383) Lagged FDI Growth Rate FDI Lagged FDI Growth Rate FDI EC
FDI_Spilloverst-1 0.762***
(9.75)
DFDI_Spillovers — — 0.934*** (-14.34) Constant Yes Yes Yes Yes Yes Yes Yes Yes Time dummy Yes Yes Yes Yes Yes Yes Yes Yes Firm dummy Yes Yes Yes Yes Yes Yes Yes Yes
R2 0.055 0.043 0.031 0.033 0.446 0.111 0.005 0.012
No. of observations 2,751 2,751 2,751 2,751 308 308 308 308 Source: Author’s estimations using equation (6).
Note: Thet-statistics are in parentheses.
*** and * represent statistical significance at the 1% and 10% level, respectively.
whereas negative spillovers are observed for technological change for domestic firms in the food-processing industry. However, the empirical results turn out to be quite different in the case of the electrical machinery industry. The results show that there are negative spillovers from FDI on efficiency but positive spillovers on technological change in this industry. The findings of this study demonstrate that different industries may experience productivity gains through different sources due to a foreign presence. Whether the productivity gains stem from efficiency improvements or technological progress depends on the nature and characteristics of the industry or firms in the industry. A low-technology industry, such as food processing, tends to gain efficiency benefits rather than technology benefits, whereas a high-technology industry, such as the electrical machinery industry, is likely to receive technology benefits.
Outcomes related to the sources of productivity gains in the food-processing and electrical machinery industries are important to policy making in Indonesia. The policy makers should consider spillover channels when providing incentives for FDI in certain industries. In the food-processing industry, where the spillovers occur through efficiency improvements, FDI that generate managerial and organi-zational knowledge should be encouraged. In the electrical machinery industry, where spillovers take place through technological progress, incentives should be provided for advanced technology transfer through FDI. Foreign firms which are willing to transfer their knowledge in the form of production, process, managerial, and organizational knowledge might be provided with special incentives. Finally, more general policies should be pursued which not only attract FDI but also benefit domestic firms; for example, building proper infrastructure and modernizing legal and political institutions and other fundamentals for creating a competitive envi-ronment in the manufacturing sector of the country.
REFERENCES
Aitken, Brian J., and Ann E. Harrison. 1999. “Do Domestic Firms Benefit from Direct
Foreign Investment? Evidence from Venezuela.”American Economic Review89, no. 3:
605–18.
Aswicahyono, Haryo H., and Hal Hill. 1995. “Determinants of Foreign Ownership in LDC
Manufacturing: An Indonesian Case Study.”Journal of International Business Studies
26, no. 1: 139–58.
Bartelsman, Eric J., and Mark Doms. 2000. “Understanding Productivity: Lessons from
Longitudinal Microdata.”Journal of Economic Literature38, no. 3: 569–94.
Blalock, Garrick, and Paul J. Gertler. 2008. “Welfare Gain from Foreign Direct Investment
through Technology Transfer to Local Suppliers.”Journal of International Economics
74, no. 2: 402–21.
Blomström, Magnus, and Ari Kokko. 2003. “The Economics of Foreign Direct Investment Incentives.” EIJS Working Paper no. 168. Stockholm: European Institute of Japanese Studies.
productivity gains from fdi in indonesia 469
Blomström, Magnus, and Fredrik Sjöholm. 1999. “Technology Transfer and Spillovers:
Does Local Participation with Multinationals Matter?”European Economic Review43,
no. 4–6: 915–23.
Caves, Douglas W.; Laurits R. Christensen; and W. Erwin Diewert. 1982. “The Economic Theory of Index Numbers and the Measurement of Input, Output, and Productivity.”
Econometrica50, no. 6: 1393–1414.
Caves, Richard E. 1971. “International Corporations: The Industrial Economics of Foreign
Investment.”Economica38, no. 149: 1–27.
———. 1974. “Multinational Firms, Competition and Productivity in Host Country
Markets.”Economica41, no. 162: 176–93.
Caves, Richard E., and David R. Barton. 1990.Efficiency in U.S. Manufacturing Industries.
Cambridge, Mass.: MIT Press.
Cheung, Kiu-Yin, and Ping Lin. 2004. “Spillover Effects of FDI on Innovation in China:
Evidence from the Provincial Data.”China Economic Review15, no. 1: 25–44.
Coelli, Tim J. 1996. “A Guide to DEAP Version 2.1: A Data Envelopment Analysis (Computer) Program.” CEPA Working Paper no. 96/08. Armidale: Centre for Efficiency
and Productivity Analysis. http://www.owlnet.rice.edu/~econ380/DEAP.PDF
(accessed February 13, 2008).
Das, Sanghamitra. 1987. “Externalities and Technology Transfer through Multinational
Corporations: A Theoretical Analysis.”Journal of International Economics22, no. 1–2:
171–82.
de Mello, Luiz R., Jr. 1997. “Foreign Direct Investment in Developing Countries and
Growth: A Selective Survey.”Journal of Development Studies34, no. 1: 1–34.
Dimelis, Sophia, and Helen Lauri. 2002. “Foreign Ownership and Production Efficiency: A
Quartile Regression Analysis.”Oxford Economic Papers54, no. 3: 449–69.
Djankov, Simeon, and Bernard Hoekman. 2000. “Foreign Investment and
Pro-ductivity Growth in Czech Enterprises.” World Bank Economic Review 14, no. 1:
49–64.
Driffield, Nigel. 2001. “The Impact on Domestic Productivity of Inward Investment in the UK.”Manchester School69, no. 2: 103–19.
Farrell, Michael. J. 1957. “The Measurement of Productive Efficiency.” Journal of the
Royal Statistical Society, Series A (General)120, no. 3: 253–90.
Findlay, Ronald. 1978. “Relative Backwardness, Direct Foreign Investment, and the
Trans-fer of Technology: A Simple Dynamic Model.”Quarterly Journal of Economics92, no.
1: 1–16.
Fosfuri, Andrea; Massimo Motta; and Thomas Ronde. 2001. “Foreign Direct Investment
and Spillovers through Workers’ Mobility.”Journal of International Economics53, no.
1: 205–22.
Girma, Sourafel, and Holger Gorg. 2007. “Multinational’s Productivity Advantage: Scale
or Technology.”Economic Inquiry42, no. 2: 350–62.
Glass, Amy Jocelyn, and Kamal Saggi. 2002. “Multinational Firms and Technology
Trans-fer.”Scandinavian Journal of Economics104, no. 4: 495–513.
Globerman, Steven. 1979. “Foreign Direct Investment and ‘Spillover’ Efficiency Benefits
in Canadian Manufacturing Industries.” Canadian Journal of Economics 12, no. 1:
42–56.
Gorg, Holger, and Eric Strobl. 2005. “Spillovers from Foreign Firms through Worker
Mobility: An Empirical Investigation.”Scandinavian Journal of Economics107, no. 4:
693–709.
470 the developing economies
© 2010 The Authors
Haddad, Mona, and Ann E. Harrison. 1993. “Are There Positive Spillovers from Foreign
Direct Investment?: Evidence from Panel Data for Morocco.”Journal of Development
Economics42, no. 1: 51–74.
Haskel, Jonathan E.; Sonia C. Peirera; and Matthew J. Slaugther. 2007. “Does Inward
Foreign Direct Investment Boost the Productivity of Domestic Firms?” Review of
Economics and Statistics89, no. 3: 482–96.
Hatzichronoglou, Thomas. 1997. “Revision of the High-Technology Sector and Product Classification.” STI Working Paper no. 1997/2. Paris: Organisation for Economic Co-operation and Development.
Ikhsan, Mohamad. 2007. “Total Factor Productivity Growth in Indonesian Manufacturing:
A Stochastic Frontier Approach.”Global Economic Review36, no. 4: 321–42.
Indonesia, Biro Pusat Statistik (Central Bureau of Statistics) (BPS). 1989. “Industrial Statistics 1988: Survey of Manufacturing Industries, Large and Medium.” Database in dBase file. Jakarta: Biro Pusat Statistik.
———. 1996. “Large and Medium Manufacturing Statistics, 1995.” Database in dBase file. Jakarta: Biro Pusat Statistik.
Indonesia, Indonesia Investment Coordinating Board. 2007. Foreign Direct Investment
Realization by Sector, 1975–2007. Jakarta: Indonesia Investment Coordinating Board. Javorcik, Beata S. 2008. “Can Survey Evidence Shed Light on Spillovers from Foreign
Direct Investment?”World Bank Research Observer23, no. 2: 139–59.
Kalirajan, Kaliappa P., and Richard T. Shand. 1999. “Frontier Production Functions and
Technical Efficiency Measures.”Journal of Economic Surveys13, no. 2: 149–72.
Kathuria, Vinish. 2000. “Productivity Spillovers from Technology Transfer to Indian
Manufacturing Firms.”Journal of International Development12, no. 3: 343–69.
Kaufmann, Lawrence. 1997. “A Model Spillovers through Labour Recruitment.”
Interna-tional Economic Journal11, no. 3: 13–34.
Kokko, Ari, and Victoria Kravtsova. 2008. “Innovative Capability in MNC Subsidiaries:
Evidence from Four European Transition Economies.”Post-Communist Economies20,
no. 1: 57–75.
Konings, Jozef. 2001. “The Effects of Foreign Direct Investment on Domestic Firms:
Evidence from Firm-Level Panel Data in Emerging Economies.”Economics of
Tran-sition9, no. 3: 619–33.
Kravtsova, Victoria, and Valentin Zelenyuk. 2007. “Foreign Knowledge, What Does It Bring to Domestic Firms?: Malmquist Productivity Index in Test for FDI Spillovers.” VDQS Working Paper no. WP_2007_018. Paris: Vineyard Data Quantification Society. Kugler, Maurice. 2006. “Spillovers from Foreign Direct Investment: Within or between
Industries?”Journal of Development Economics80, no. 2: 444–77.
Lin, Hui-Lin, and Wen-Bin Chuang. 2007. “FDI and Domestic Investment in Taiwan: An
Endogenous Switching Model.”Developing Economies45, no. 4: 465–90.
Liu, Zhiqiang. 2008. “Foreign Direct Investment and Technology Spillovers: Theory and
Evidence.”Journal of Development Economics85, no. 1–2: 176–93.
Margono, Heru, and Subhash C. Sharma. 2006. “Efficiency and Productivity Analyses of
Indonesian Manufacturing Industries.”Journal of Asian Economics17, no. 6: 979–95.
Narjoko, Dionisius, and Hal Hill. 2007. “Winners and Losers during a Deep Economic
Crisis: Firm-Level Evidence from Indonesian Manufacturing.” Asian Economic
Journal21, no. 4: 343–68.
Ramstetter, Eric D. 1999. “Trade Propensities and Foreign Ownership Shares in Indonesian
Manufacturing.”Bulletin of Indonesian Economic Studies35, no. 2: 43–66.
productivity gains from fdi in indonesia 471
Salim, Ruhul A., and Kaliappa P. Kalirajan. 1999. “Sources of Output Growth in
Ban-gladesh Food Processing Industries: A Decomposition Analysis.”Developing
Econo-mies37, no. 3: 355–74.
Sjöholm, Fredrik, and Sadayuki Takii. 2008. “Foreign Networks and Exports: Results from
Indonesian Panel Data.”Developing Economies46, no. 4: 428–46.
Smeets, Roger. 2008. “Collecting the Pieces of the FDI Knowledge Spillovers Puzzle.”
World Bank Research Observer23, no. 2: 107–38.
Suyanto; Salim, Ruhul A.; and Harry Bloch. 2009. “Does Foreign Direct Investment Lead
to Productivity Spillovers? Firm Level Evidence from Indonesia.”World Development
37, no. 12: 1861–76.
Thangavelu, Shandre M., and Sanja Samirana Pattnayak. 2006. “Linkages and Spillovers from Foreign Ownership in the Indian Pharmaceutical Firms.” SCAPE Working Paper no. 2006/05. Singapore: Singapore Centre for Applied and Policy Economics, National University of Singapore.
Vial, Virginie. 2006. “New Estimates of Total Factor Productivity Growth in Indonesian
Manufacturing.”Bulletin of Indonesian Economic Studies42, no. 3: 357–69.
Wang, Jian-Ye, and Magnus Blomstrom. 1992. “Foreign Investment and Technology
Transfer: A Simple Model.”European Economic Review36, no. 1: 137–55.
472 the developing economies
© 2010 The Authors
Sources of Productivity Gains
from FDI in Indonesia
by
1 Suyanto
Submission dat e : 27-Mar-2018 04:06PM (UTC+0700)
Submission ID: 936914009
File name : III.1.C.1.2_asli.pdf (186.58K)
Word count : 9411
FINAL GRADE
/100
Sources of Productivity Gains from FDI in Indonesia
GRADEMARK REPORT
GENERAL COMMENTS
Instructor
PAGE 1
PAGE 2
PAGE 3
PAGE 4
PAGE 5
PAGE 6
PAGE 7
PAGE 8
PAGE 9
PAGE 10
PAGE 11
PAGE 12
PAGE 13
PAGE 14
PAGE 15
PAGE 16
PAGE 17
PAGE 18
PAGE 19
PAGE 20
PAGE 22
35
%
SIMILARIT Y INDEX
23
%
INT ERNET SOURCES
27
%
PUBLICAT IONS
19
%
ST UDENT PAPERS
1
3
%
2
2
%
3
2
%
4
1
%
5
1
%
6
1
%
Sources of Productivity Gains from FDI in Indonesia
ORIGINALITY REPORT
PRIMARY SOURCES
www.emeraldinsight.com
Int ernet SourceSubmitted to University of Sydney
St udent Paper
www.iie.com
Int ernet Source
Suyanto. "Does Foreign Direct Investment
Lead to Productivity Spillovers? Firm Level
Evidence from Indonesia", World
Development, 200912
Publicat ionEduardo Correia De Souza. "Growing Pains
in Latin America: An Economic Growth
Framework as Applied to Brazil, Colombia,
Costa Rica, Mexico, and Peru - Edited by
Liliana Rojas-Suarez : book reviews", The
Developing Economies, 08/26/2010
Publicat ion
Suyanto, , Ruhul Salim, and Harry Bloch.
"Which firms benefit from foreign direct
investment? Empirical evidence from
7
1
%
8
1
%
9
1
%
10
1
%
11
1
%
12
<
1
%
13
<
1
%
14
<
1
%
Economics, 2014.
Publicat ion
Submitted to Curtin University of Technology
St udent Paper
paper
St udent PaperVasilios Kosteas. "Foreign direct investment
and productivity spillovers: a quantile
analysis", International Economic Journal,
3/2008
Publicat ion
Rupayan PAL. "IMPACT OF COMMUNIST
PARTIES ON THE INDIVIDUAL DECISION
TO JOIN A TRADE UNION: EVIDENCE
FROM INDIA : individual decision to join a
trade union", The Developing Economies,
12/2010
Publicat ion
www.icsead.or.jp
Int ernet Source
www.ide.go.jp
Int ernet Source
Jianhong Qi. "Productivity Spillovers from FDI
in China: Regional Differences and Threshold
Effects", China & World Economy, 07/2009
Publicat ion15
<
1
%
16
<
1
%
17
<
1
%
18
<
1
%
19
<
1
%
20
<
1
%
21
<
1
%
22
<
1
%
Leal Calegário, Francisval de Melo Carvalho,
Renato Silvério Campos et al. "Mergers and
acquisitions in Brazilian industry: a study of
spillover effects", International Journal of
Productivity and Performance Management,
2017
Publicat ion
Sailesh Tanna. "The impact of foreign direct
investment on total factor productivity
growth", Managerial Finance, 2009
Publicat ion
openaccess.adb.org
Int ernet SourceSubmitted to University of St. Gallen
St udent Paper
openknowledge.worldbank.org
Int ernet Source
Submitted to Laureate Higher Education
Group
St udent Paper
repository.usfca.edu
Int ernet Sourcebea.doc.gov
Int ernet Source