Seed Yield of Various Genotypes of
Sorghum
(
Sorghum bicolor
[L.] Moench
.)
Harvested from
Intercropping with Cassava
(
Manihot utilisima
L.)
Compared to Monoculture and Ratoon
Eko Pramono1 Muhammad Kamal1, Franciscus Xaverius Susilo2, and Paul Benyamin Timotiwu1*
1) Department of Agronomy, Faculty of Agriculture, University of Lampung
2) Department of Crop Protection, Faculty of Agriculture, University of Lampung 1,2)Jalan Sumantri Brojonegoro 1 Bandar Lampung, Indonesia 35144
*) Coresponding author: e-mail: [email protected]
Abstract: Production of sorghum seeds (Sorghum bicolor [L.] Moench.) faces land scarcity due to land use competition with other crops that have been cultivated by farmers since longer time ago such as soybean, peanuts, green bean, cowpea bean, and cassava. So, it has to do by using planting systems of intercropping and/or ratoon instead of monoculture. The problem was what sorghum genotypes that are compatible to planting system of intercropping, monoculture, and ratoon. The objective of this experiment was to evaluate the seed yield of various sorghum genotypes harvested from intercropping, monoculture, and ratoon planting systems. A split-plot experiment was conducted during March – November 2016 at the Village of Tulungagung, Sub District of Gadingrejo, Regency of Pringsewu, Lampung Province, Indonesia to reach that objective. Fifteen sorghum genotypes as subplots were placed randomly on three planting systems as main plot. It was replicated three times as three blocks. The seed yields observed were weight of thousand seeds (WTS), seed weight per plant (SWPP), seed number per plant (SNPP), and flowering day (FD). In general, the planting system did not affect significantly to seed yield, except on the flowering day. The genotypes affected significantly on weight of thousand seeds and the flowering day. There was an interaction effect of planting systems and genotypes showed by seed weight per plant and flowering day.
Keywords: intercropping, ratoon, seed yield, sorghum genotypes
I. INTRODUCTION
Sorghum is a seasoned food crop, which metabolizes of C4, as well as corn and sugarcane plants, which are superior to C3 plants in terms of air carbon fixation through photosynthesis. Sorghum is able to adapt to environments with high levels of CO2, and in the environments with CO2 levels of 700 and average temperature of 22-32 C, it was able to produce 26% than those in normal CO2 levels [1]. (Prasad et al., 2006). Sorghum also has the ability to form ratoon (ratooning), but it varied among genotypes [2] (Meliala et al., 2017). Sorghum consumed water lesser (4.000 m3 ha-1 per 4 months) than corn (8.000 m3 ha-1 per 4 months) or sugarcane (36.000 m3 ha-1 per 9-12 months) [3]
(Reddy et al., 2006). In addition to mono-cropping (monoculture), many researchers reported that sorghum can also
be planted by intercropping with other crops such as soybean [4], peanut [5], green bean [6], and cowpea [7].
land, intercropping can reduce the risk of crop failure [8][9], improve soil fertility [10], reduce erosion, increase efficiency of environmental factors use [11], suppresses the attack of plant-disturbing organisms, improves the nutritional quality of animal feed [12][13][14], and can improve the efficiency of water use [15]. Mono-cropping or monoculture, as a basic of planting, is planting one kind of crop in one planting area during one planting season.
Intercropping of sorghum-soybeans could increase the productivity of the sorghum plant by 60% [2]. In Ethiopia the intercropping of sorghum-peanuts gave additional sorghum yield without reducing the yield peanuts [16]. In Thailand, the sorghum-green beans intercropping yielded sorghum seed lower than that of the intercrop with Soybean [6]. In the Semi Arid Sub-district of Kenya, the intercropping of sorghum-cowpea beans (Vigna unguilata
L.) slightly lowered the sorghum seeds yield and the harvesting index but increased sorghum stover, and decreased d of beans yield and harvest index of cowpea bean [7]. The varieties of sorghum affected to the results of sorghum intercropped with legume crops [17]. Competition for light, water, and nutrient can occurred in the intercropping affected crop productivity [18]. Low light accepted caused competition can affect to leaf chlorophyll formation, stomatal conductivity , and the activity of nitrate reductase [19]. The activity of nitrate reductase differ among genotype [19].
Sorghum has the ability of growing ratoon called ratooning. It is an ability to sprout from the base of the stem that has been cut [20]. The ability of ratooning varied among sorghum genotypes [2]. Seeds yield and weight of 1000 seeds of ratoon crop of sorghum were lower than those of main crop which was between 49-66%, but it could increase the efficiency of land and time uses [21]. Thus, differences in the ability of ratooning and productivity of ratoon systems need to be studied on the genotypes of sorghum in Indonesia.
The development of sorghum to produce food, feed, bio-ethanol [22] [23], and bio-plastic [24] requires a large area. On the other hand, the sorghum expansion by opening new agricultural land or taking agricultural land from other cultivated crops is also not possible. Therefore, the development of sorghum by intercropping with other crops and/or maintenance ratoon of sorghum is the most feasible way. Earlier research reports indicated that sorghum was widely grown as intercropping with soybean, cowpea beans, peanuts, and green beans, but there was not report sorghum seed yield harvested from intercropping with cassava (Manihot utilisima L.). In fact, the cassava plantation
area in Indonesia reaches 949,253 ha, and in Lampung Province it reaches 279,226 ha [25]. It will be the potential farmland to develop sorghum crop in Indonesia using intercropping system. The problem is what sorghum genotypes that are compatible to be planted by intercropping with cassava, monoculture, and ratoon.
II. MATERIALS AND METHODS
The experiment was conducted in the Village of Tulung Agung, Sub- District of Gadingrejo, Regency of Pringsewu, Lampung Province, Indonesia with coordinates of 5.36 ºS and 105.04 ºE at the altitude 300 m from sea level (FSL)
during March – November 2016. Rainfall in the experimental area was presented in Fig.1. Fifteen genotypes of sorghum consisted of eight varieties that have been released by the Ministry of Agriculture the Republic of Indonesia (i.e. Numbu, Super-1, Super-2, Samurai-1, UPCA, Telaga Bodas, P/W-WHP, and Mandau), one genotype P/F-5-193C was an introduction line from ICRISAT, and six 6 improved-lines released by PAIR BATAN (Center of isotope and radiation application of national atomic power agency, namely (i.e. GH3, GH4, GH5, GH6, GH7, and GH13). The cassava clone used in this experiment was Kasertsart-50.
0
Figure.1. The monthly rainfall in the area where the experiment was conducted in the year of 2016.
A. Experimental Design
The experiments used two treatment factors, namely genotype (G) consisting of 15 sorghum genotypes and cropping system (P) consisting of three kinds cropping systems namely monoculture of sorghum (p1), intercropping sorghum-cassava (p2), and ratoon of monoculture sorghum (p3). The ratoon system was derived from monoculture system. The 15x3 factorial treatments were applied in a split plot design and it were done with replicated as three blocks.
The main plot was the cropping systems (P), and the sub-plot was the genotypes (G). Bartlett test at 5% level to test homogeneity of variation between treatments, and Tukey test at 5% level to test data aditivity. Both were assumptions that must be met before the analysis of variance. Analysis of variance (ANOVA) (Fisher test at 5% level) of split plot design to test the treatments factor effect simultaneously. Tukey’s HSD at 5% level was used to compare the treatments mean among planting systems or among genotypes. A simple clustering method was used to rank the superiority of sorghum genotypes included in highest five seed yield linked to planting systems.
B. Implementation of the experiment
sorghum flanked by two cassava rows. One row of sorghum contained 36 planting holes, with two stems per hole, and with spacing of 20 cm. Two cassava rows were planted with spacing 80 cm between rows and spacing 60 cm in row. The monoculture system of sorghum was formed by two rows of sorghum, with 36 planting holes in each row, and with two stems per planting hole. The ratoon system was originated from main crops of the monoculture system after it was being harvested. Those ratoon crops were maintained to grow and develop up to harvest. In the ratoon system, there ware two rows of sorghum with spacing 80 cm between rows and 20 cm within the row.
The sorghum seeds were planted in holes with 3-5 cm depth. The holes for planting the seeds were made with a pointed stick called tugal. The hole system is also known as tugal system. In each hole, 3-5 seeds were planted. At 2 weeks old after planting (WAP), thinning was done. Thinning was aimed at planting holes containing more than two seedlings. It was done by cutting the stems of young sorghum seedling at the base part of the stem using scissors and it let two seedlings left per planting hole.
The sorghum crops were given fertilizers Urea 200 kg/ha, superphosphate-36 (SP36)100 kg/ha, and potashium chloride (KCl) 100 kg/ha. The cassava crops were given fertilizers Urea 200 kg/ha, SP36 100 kg/ha, and KCl 200 kg/ha. The SP-36 and KCl fertilizers were administered seluruh dose either to sorghum and cassava crops at 30 days old after planting (DAP). Urea fertilizer was given twice, 50% of dose was given simultaneously with SP36 and KCl and the rest was given to sorghum at 60 DAP old or to cassava at 120 DAP old. Fertilizers were given to the crops by holes system, either on cassava or sorghum.
With spacing 80 cm x 20 cm, the sorghum population per hectar were 62,500 planting holes. With those dose of fertilizers, each planting hole got Urea 3,2 g, SP36 1,6 g, and KCl 1,6 g. For sorghum crops, fertilizers were placed in one hole made between two planting holes. Base on this way, at the first fertilizers apllication on sorghum, 9.6 g fertilizers consisting of 3,2 g Urea 3,2 g SP36 and 3,2 g KCl were given into the hole, At the second fertilizer application 3,2 g urea was given to sorghum. With spacing 80 cm x 60 cm, the cassava population were 20,833 stems. With those dose of fertilizers, each stem got Urea 9,6 g SP36 4,8 g and KCl 9,6 g. For cassava crops, fertilizers were placed in a hole made at ±20 cm from each stem. Each cassava stem got 19.2 g fertilizers comprising 4,8 g Urea 4,8 g SP36 and 9,6 g KCl at the first fertilizers application and 4.8 g Urea at the second application. The fertilizer holes were covered with soil after the fertilizer applicated into the holes.
The crops were irrigated with rainfall. The monthly rainfall during this experiment was presented in Fig.1. Weeding and pests control were done using herbicides and pesticides, respectively, to prevent the failure of this experiment. Sorghum seeds were harvested at physiological maturity stage indicated by dark color formed at the abscission layer of the sorghum seeds that called black layer [26](Andriani and Isnaini, 2013). The seeds that still attached to the panicle were dried under the sunrays up to ±10% seed moisture content reached. The seeds were then removed down from the panicle and cleaned it using blower up to the clean seed obtained.
Four variables were observed, namely weight of thousand seeds (WTS), seed weight per plant (SWPP), seed number per plant (SNPP), and flowering day (FD). The WTS was measured at ±10% seed moisture content. One thousand seeds were obtained randomly from each of the three replicates being counted using Seed Counter Type 801 from Seed Buro, and then the weight of each of thousand seeds was measured using four digits analytical scales Type Symetry from Cole Palmer. The SWPP was measured at 10% seed moisture contents. All clean and good seeds obtained from each sample panicle of a sorghum plant were weighted using an electric balance Type
Scout Pro. The SNPP was obtained by counting all seeds obtained from each sample panicle of sorghum using seed
counter Type 801 Count-A-Pak. The FD was measured by counting the number of flowering sorghum stem everyday that was begun since the first sorghum stem flowered up to 50% of sorghum stem flowered. The day at which 50% of the sorghum stems flowered was stated as the flowering day (FD) of sorghum crops. In monoculture and intercropping systems, the FD was measured in unit of days after planting (DAP), but in ratoon system FD was measured in unit of days after stem cutting (DASC).
III. RESULTS
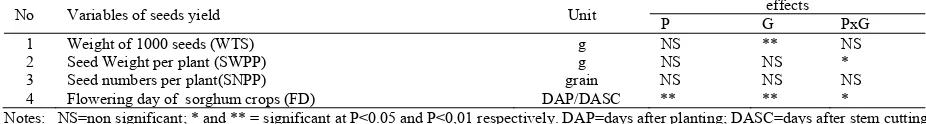
The summary of analysis of variance was presented in Table 1. It showed that the main effect of planting systems (P) was highly significant (P<0.01) on the flowering day (FD) of sorghum crops. The effect of planting system was not significant on the variables of seed yield such as weight of 1000 seeds (WTS), seeds weight per plant (SWPP), and seed numbers per plant (SNPP). The genotype affected highly significant (P<0.01) to WTS and FD and did not affect to SWPP, and SNPP. The interaction effect of planting system and genotype was significant (P<0.05) on variables of the SWPP and FD.
TABLE 1. Summary of analysis of variance (anova) the effects of planting system (P), genotype (G), and interaction effect (PxG) on seed yields.
Notes: NS=non significant; * and ** = significant at P<0.05 and P<0,01 respectively. DAP=days after planting; DASC=days after stem cutting
A. Effects of planting system on seed yield of sorghum
The main effect of planting systems was not significance on seed yield (WTS, SWPP, and SNPP), but it was highly significant (P,0.01) on flowering day (FD) (Fig. 2). Numerically, there were different quantities of WTS, SWPP, and SNPP among the planting systems (Fig. 2: a, b, c), but statistically those different were not significance (P>0.05). The weight of thousand seeds (WTS) of sorghum harvested from ratoon planting system (26 g) numerically was lower than those from intercropping (31 g) and monoculture (32 g) systems, but it was still not significance statistically (Figure 2a) according to 5% Tukey’s HSD test.
between genotype and planting system as presented in Fig. 3b. The planting systems affected significantly (P<0.01) to the flowering day of sorghum crops (FD). There was not different of FD of sorghum planted in monoculture (76 days after planting (DAP)) or intercropping systems (75 DAP), but both were different from those cultivated in the ratoon system (57 DASC) (Figure 2d).
B. Effect of genotypes on Seed Yield
Genotypes affected highly significant (P<0.01) on Weight of thousand seeds (WTS) and flowering day (FD) of sorghum, but it did not affect (P>0.05) on seed weight per plant (SWPP) and seed numbers per plant (SNPP) (Table 1; Fig. 3). According to the 5% Tukey’s HSD test (7,2 g) on weight of thousand seeds, the 15 sorghum genotypes could be classified into three groups, i.e. large sized seed genotypes (Numbu), medium size seed genotypes (Talaga Bodas, P/W-WHP, and GH3), and small size seed genotypes (Super-2, UPCA, Mandau, GH6, Samurai-1, P/F-5-193C, GH5, Super-1, GH7, GH13, and GH4). Several genotypes had small SEM value of WTS, such as Numbu, P/W-WHP, Super-1, and Super-2, it meant that their weight of thousand seeds did not much vary with the planting systems. It showed that those genotypes well adapted to monoculture, intercropping, or ratoon systems.
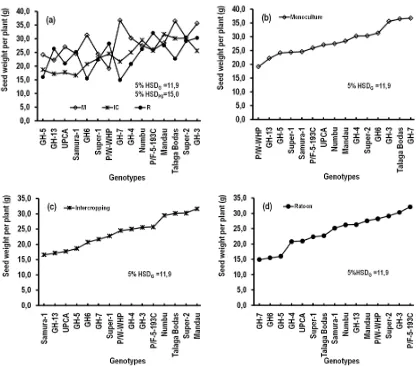
Figure. 2. Weight of 1000 seeds (a), weight of seeds per plant (b), seed numbers per plant (c), and flowering day of 50% plants (d) under planting
systems of monoculture (M), intercropping (IC), and ratoon (R) of sorghum (Sorghum bicolor [L.] Moench.). In M and IC systems,
Figure 3. Weight of thousand seeds (a) and seed numbers per plant (b) of 15 genotypes of sorghum (Sorghum bicolor [L.] Moench.). Bar marks
were standard error of the mean (SEM). The numbers followed by the same letter at (a) were not significant according to 5% Tukey’s HSD.
Seed numbers per plant (SNPP) of sorghum was not affected by the interaction of planting systems and genotypes (P>0.05) (Table 1; Figure 3b). Numerically, the seed yield of 15 sorghum genotypes varied from the most of 983 seeds (P/F-5-193C) to the least of 727 seeds (GH6). This variation was not different statistically.
C. Interaction effect of planting systems and genotypes
The interaction effect of planting systems and genotypes was highly significant (P<0.01) (Table 1) on seed weight per plant (SWPP) (Fig. 4) and flowering day (FD)(Fig. 5). The SWPP of a genotype among planting systems could be compared using 5% Tukey’s HSDPS test =15.0 g, and the SWPP among genotypes on the same planting systems
could be compared using 5% Tukey’s HSDG test =11.9 g (Fig 4(a)). There were two genotypes those having
different SWPP caused of planting system namely GH-6 and GH-7, whereas on the other genotypes there were not different SWPP caused of planting systems. The GH-6 SWPP harvested from the monoculture (31.3 g) was higher than and significantly different from those harvested from the ratoon (15.5 g), but it was not different from those harvested from the intercropping (20.7 g). The GH-7 SWPP harvested from monoculture (36.7 g) was higher than and significantly different from those harvested from the ratoon (14.9 g), but was not different from those harvested from the intercropping (21.7 g).
Fig 4(b-d) showed the order of seed yield from lowest to highest on every planting system. On the monoculture, five genotypes those having high seed yield were GH-7, Talaga Bodas, GH-3, GH-6, and Super-2. On the intercropping, the five genotypes those having high seed yield were Mandau, Super-2, Talaga Bodas, Numbu, and P/F-5-193C. On the ratoon system, the five genotypes those having high seed yield were P/F-5-193C, GH-3, Super-2, PW-WHP, and Mandau. Super-2 was the only one genotype that included in the big five genotypes having high seed yield in three planting systems.
Figure 4. Interaction effect of planting system (PS) and genotype (G) on seed weight per plant (SWPP) (a). It could be seen the seed yield
from the least to the most on every planting system: monoculture (b), intercropping (c), and ratoon (d). 5% HSDG and 5% HSDPS
were values of Tukey’s HSD at level 5% to compare the mean values among genotypes and among planting systems, respectively.
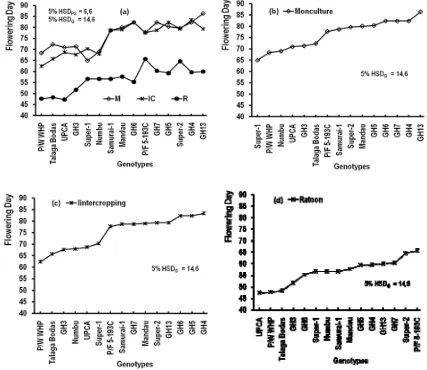
earlier than those cultivated in monoculture and intercropping systems (Fig. 5(a)). Fig. 5(b–d) showed the order of FD from the earliest to the latest. The flowering days ranged from 65-86 days after planting (DAP) (on monoculture), 62-83 DAP (on intercropping), and 47-66 days after stem cutting (DASC) (on ratoon). The FD of all sorghum genotypes on monoculture were not different from those on intercropping, but both were longer than those on ratoon. Five genotypes having earliest flowering day on every planting system were Super-1, P/W-WHP. Numbu, UPCA, and GH-3 (on monoculture), P/W-WHP, Talaga bodas, GH-3, Numbu, and UPCA (on intercropping), and UPCA, P/W-WHP, Talaga Bodas, GH-3, and GH-6 (on ratoon).
IV. DISCUSIONS
Figure 5. Interaction effect of planting system (PS) and genotype (G) on flowering day (FD) (a). It could be seen the flowering day from the
least to the most on every planting system: monoculture (b), intercropping (c), and ratoon (d). 5% HSDG and 5% HSDPS were values of
Tukey’s HSD at level 5% to compare the mean values among genotypes and among planting systems, respectively
and ratoon planting systems with no significant different of seed yield. The intercropping, in addition to got sorghum seed yield, it got land saving [10,11], and increases the efficiency of environmental factors, such as rainfall and sunlight [27]. In general, the flowering days of sorghum crops (FD) cultivated on intercropping (76 DAP) and monoculture (75 DAP) systems were not different significantly (P<0.01), but both were longer than those on ratoon (57 DASC) system. It meant that producing sorghum seed in ratoon system was more efficient in time using compared to those in intercropping or in monoculture systems [21].
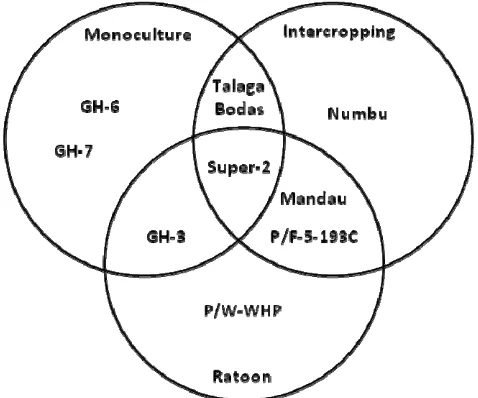
system, there are five sorghum genotypes with the highest seed yield which could be stated as the most compatible to a certain the planting system (Fig. 6).
Figure 6. There were nine genotypes (GH-6, GH-7, GH-3, Sp-2=Super-2, TB=Talaga Bodas, Num= Numbu, Man=Mandau, P/F-5=P/F-5-193C, and P/W= P/W-WHP) included in highest five seed yield on each planting system (M=monoculture, IC=intercropping, and R=ratoon
Figure 6, in addition to indicated the five genotypes of sorghum with highest seed yield on each planting systems, it also indicated the compatibility of the genotypes with the planting systems. Based on Fig. 6, this study showed that high seed yields of: a) GH-6 and GH-7 were only on the monoculture, b) Numbu was only on the intercropping system, and P/W-WHP was on the ratoon system; b) Talaga Bodas was on monoculture and intercropping systems, Mandau and P/F-5-193C were on intercropping and ratoon systems, and GH-3 was on monoculture and ratoon systems; and c) Super-2 was on monoculture, intercropping, and ratoon systems. The genotypes those have high seed yield on intercropping system could be stated as superior genotypes. In this study, the superiority of sorghum genotypes could be stratified into three strata according to number of compatibilities to the planting systems. Numbu, GH-6, GH-7, and P/W-WHP were genotypes those have single superiority, because they were compatible to only one planting system, respectively. Talaga Bodas, GH-3, Mandau, and P/F-5-193 were genotypes those have double superiority, because they were compatible to two planting systems, respectively. Super-2 was a genotype that has triple superiority, because it was compatible to three planting systems. The superiority of those genotypes might be caused by good root system, namely long, deep and numerous rooting, those well adapted to intercropping and supporting to ratoon growth [28], so that they could utilize available water and nutrients [29] in the intercropping system, included nitrogen [30] that positively correlated to grain yield [29].
V. CONCLUSION
The seed yield being indicated by seed weight per plant (SWPP) of various sorghum genotypes was influenced by the interaction of genotypes and planting systems. In general, there were not different seed yield of 15 sorghum genotypes on monoculture, intercropping, and ratoon planting systems, except GH-6 and GH-7. There were difference seed yield among several genotypes on each planting system. Based on the interaction effect, this study could conclude as follow: a) Super-2 was the genotype than compatible to monoculture, intercropping, and ratoon planting systems, b) GH-3, (Mandau and P/F-5-193C), and Talaga Bodas were compatible to monoculture and ratoon, ratoon and intercropping, and intercropping and monoculture planting systems, respectively; and c) Numbu, (GH-6 and GH-7), and P/W-WHP were compatible to intercropping, monoculture, and ratoon planting systems, respectively.
ACKNOWLEDMENT
We would like to thank University of Lampung for funding this research through DIPA BLU scheme on Budget Year 2016 with taskforce letter No.550/UN26/8/ LPPM/2016.
REFERENCES
[1] Prasad P.V. V., K J. Boote, L. H. Allen Jr. 2006. Adverse high temperature effects on pollen viability, seed-set, seed yield and harvest index
of grain-sorghum [Sorghum bicolor (L.) Moench] are more severe at elevated carbon dioxide due to higher tissue temperatures. Agricultural
and Forest Meteorology 139:237–251.
[2] Meliala, M. G., Trikoesoemaningtyas, and D. Sopandie. 2017. Behavior and Ability to make ratoon of Five Sorgum Genotypes. J. Agron.
Indonesia 45 (2): 154-161. (in Bahasa Indonesia).
[3] Reddy B.V.S., S. Ramesh, S.P. Reddy, A.A. Kumar, K.K. Sharma, K.S.M.Chetty, and A.R. Palaniswamy. 2006. Sweet sorghum: food, feed, fodder and fuel crop. The International Crops Research Institute for the Semi-Arid Tropics (ICRISAT), Patancheru, Andhra-Pradesh, India. p. 8.
[4] Soedradjad, R., A. Zulkifli, R. Kurniawan. 2014. Sorgum Production Response Against Nitrogen Fertilizer on Intercropping Planting Patterns with Soybean [Response of Fertilizer Nitrogen on Production of Sorghum-Soybean Intercropping]. AGRITROP 12 (2): 113-117. (in Bahasa Indonesia).
[5] Berhanu, H., A. Hunduma, G. Degefa, Z. Legesse, F.Abdulselam and F. Tadese. 2016. Determination of Plant Density on Groundnut (Arachis hypogaea L.) Intercropped with Sorghum (Sorghum bicolor L. Moench) at Fadis and Erer of Eastern Hararghe. Pulse and Oil
Crop Research Division, Fedis Agricultural Research Center, Harar, Ethiopia. Pp 18.
[6] Arshad, M. and S.L. Ranamukhaarachchi. 2012. Effects of legume type, planting pattern and time of establishment on growth and yield of
sweet sorghum-legume intercropping. Asian Jurnal of Crops Science 6(8):1265-1274.
[7] Karanja, S. M. , A. M. Kibe, P. N. Karogo, and Mariam Mwangi. 2014. Effects of Intercrop Population Density and Row Orientation on Growth and Yields of Sorghum - Cowpea Cropping Systems in Semi Arid Rongai, Kenya.
[8] McIntosh, J. L. 2007. Multiple Cropping.IRRI Annual Report. IRRI Los Banos, Philipines.
[9] Vandermeer, J. 2009. The Ecology on Intercropping. Cambridge University Prees,New York.
[10] Banik, P., A. Midya, B.K. Sarkar, and S.S. Ghose. 2006. Wheat and chickpea intercropping systems in an additive series experiment:
Advantages and weed smothering. Europ. J. Agronomy 24:325–332.
[11] Sekamatte, B.M., M. Ogenga-Latigo, and A. Russell-Smith. 2003. Effects of maize–legume intercrops on termite damage to maize, activity
of predatoryants and maize yields in Uganda. Crop Protection 22:87–93.
[12] Bingol, N. T., M. A. Karsli, I. H. Yilmaz and D. Bolat. 2007. The effects of planting time and combination on the nutrient composition and digestible dry matter yield of four mixtures of vetch varieties intercropped with barley. Journal of Veterinary Animal Science. 31:297-302. [13] Gooding, M. J., E. Kasyanova, R. Ruske1, H. Hauggaard-Nielsen, E. S. Jensen, C.Dahlmann, P. Von Fragstein, A.Dibet, G. Corre-Hellou, Y. Crozat, A. Pristeri, M. Romeo, M.Monti, and M. Launay. 2007. Intercropping with pulses to concentrate nitrogen and sulphur in wheat. Journal of Agricultural Science 145: 469–479
[14] Eskandari H , A. Ghanbari, and A. Javanmard. 2009. Intercropping of Cereals and Legumes for Forage Production. Not. Sci. Biol.
1(1):07-13.
[15] Yuan Y. R., Xiao Lin Wang, Sui Qi Zhang, Jairo Alberto Palta, and Ying Long Chen. 2017. Influence of spatial arrangement in
[16] Berhanu, H., A. Hunduma, G. Degefa, Z. Legesse, F.Abdulselam and F. Tadese. 2016. Determination of Plant Density on Groundnut (Arachis hypogaea L.) Intercropped with Sorghum (Sorghum bicolor L. Moench) at Fadis and Erer of Eastern Hararghe. Pulse and Oil
Crop Research Division, Fedis Agricultural Research Center, Harar, Ethiopia. Pp 18.
[17] Telleng, M., K. G. Wiryawan, P. D. M. H. Karti, I. G. Permana, and L. Abdullah. 2016. Forage Production and Nutrient Composition of
Different Sorghum Varieties Cultivated with Indigofera in Intercropping System. Media Peternakan 39(3):203-209
[18] Sunyoto, and M. Kamal. 2009. Agronomic appearance of various genotypes of sorghum (Sorghum bicolor (L.) Moench.) In Bandar Lampung during two planting seasons. Pros. Sem. Nas. Teknol. Appropriate Agroindustry and Dissemination of Research Result of Polinela Lecturer. Bandar Lampung. April 2009. (in Bahasa Indonesia).
[19] Kamal, M. 2008. Chlorophyll content and nitrate reductase activity of upland rice under shade and dark period treatments. J. Ilmiah
Pertanian Gakuryoku XIV(2)51-54.
[20] Vinutha K.S., G.S. Anil Kumar, Michael Blümmel, and P. Srinivasa Rao. 2017. Evaluation of yield and forage quality in main and ratoon
crops of different sorghum lines. Tropical Grasslands-Forrajes Tropicales 5(1):40–49. DOI: 10.17138/TGFT(5)40-49
[21] Santos, A. B., N. K. Fageria, and A. S. Prabhu. 2003. Rice Ratooning Management Practices for Higher Yields. Communications In Soil Science And Plant Analysis 34(5 & 6):881–918.
[22] Sarfraz, M., Ahmed N., Farooq U., Ali A, Hussain K. 2012. Evaluation of sorghum varieties/lines for hydrocyanic acid and crude protein contents. Journal of Agricultural Research 50:3947. (Available at: http://eprints.icrisat.ac.in/4553).
[23] Bean, B.W., Baumhardt R. L., McCollum FT III; McCuistion KC. 2013. Comparison of sorghum classes for grain and forage yield and
forage nutritive value. Field Crops Research 142:2026. DOI: 10.1016/j.fcr.2012.11.014
[24] Sumartini, S. 2016. Design of Bioplastic Plant from Sorgum Starch and Anhydrous Acetate Capacity of 28,000 tons / year (Design of Reactor (RE-201)). Faculty of Engineering, University of Lampung. URL: http://digilib.unila.ac.id/ id / eprint / 22996. (in Bahasa Indonesia).
[25] BPS (Central Bureau of Statistics). 2017. Cassava Harvested Area by Province 1993-2015. Data is assessed on November 12, 2017; 12:17.
https://bps.go.id/Subjek/view/id/53#subjekViewTab3|accordion-daftar-subjek1. (in Bahasa Indonesia).
[26] Andriani, A. and M. Isnaini. 2013. Morphological and Growth Stages of Sorghum. In Sumarno, D. S. Damardjati, M. Syam, and
Hermanto (eds.). Sorghum: Technology Innovation and Development. Agency for Agricultural Research and Development. Ministry of Agriculture. Republic of Indonesia. Pp: 47-68. (In Bahasa Indonesia)
[27] Knudsen, M. T., H. Hauggaard-Nielsen, B. Jørnsgard, and E. Steen Jensen. 2004. Comparison of interspecific competition and N use in
pea–barley, faba bean–barley and lupin–barley intercrops grown at two temperate locations. Journal of Agricultural Science 142:617–627.
[28] He, J., Yi Jin, Yan-Lei Du, Tao Wang, Neil C. Turner, Ru-Ping Yang, Kadambot H. M. Siddique, and Feng-Min Li. 2017. Genotypic Variation in Yield, Yield Components, Root Morphology and Architecture, in Soybean in Relation to Water and Phosphorus Supply.
Frontiers in Plant Science 8: Article No1499: 1-11.
[29] Merrill, S. D., D. L. Tanaka, and J. D. Hanson. 2002. Root Length Growth of Eight Crop Species in Haplustoll Soils. Soil Sci. Soc. Am. J.
66:913–923.
[30] Kristensen, H. L. and K. Thorup-Kristensen. 2004. Root Growth and Nitrate Uptake of Three Different Catch Crops in Deep Soil Layers.

![CONTRIBUTIONS OF SEED PHYSICAL AND CHEMICAL CHARACTERS OF VARIOUS SORGHUM GENOTYPES (Sorghum bicolor [L.] Moench.) TO DAMAGED SEED INDUCED BY WEEVIL (Sitophilus sp.) DURING STORAGE](data:image/gif;base64,R0lGODlhAQABAIAAAP///wAAACH5BAEAAAAALAAAAAABAAEAAAICRAEAOw==)