Calitatea-acces la succes
Calitatea-acces la succes
Revistă de sisteme de management, 6 apariţii pe an
Quality-Access to Success
Quality-Access to Success
Journal of management systems, 6 issues per year
Publisher:
Romanian Society for Quality Assurance PDG:Dan Grigore Stoichiţoiu
Editorial Board:
Editor-in-Chief:Tudor-George Mărunţelu Senior editors:
Florin Gheorghe Filip(Romanian Academy),
Grigore Belostecinic(Academy of Science of Moldova), Ioan C. Bacivarov(„Politehnica“ University, Bucharest, Romania) Editor:Anca Perşoiu
Editorial Advisory Board:
Marin Andreica(Trade Academy Satu Mare, Romania),Liana Anica-Popa(ASE Bucharest, Romania),Gabriel Băbuţ(University of Petroşani, Romania), Dumitru-Alexandru Bodislav(ASE Bucharest, Romania),Elena Bogan(University of Bucharest, Romania), Stelian Brad(Technical University of Cluj-Napoca, Romania),Florina Bran(ASE Bucharest, Romania),Giuseppe Calabro(Universita degli Studi di Messina, Italy),Grazia Calabro(Universita degli Studi di Messina, Italy),Gian Paolo Cesaretti(Parthenope University of Naples, Italy),Andrzej Chochól(Cracow University of Economics, Poland),Sorin Cruceru(DeVry College of New York, USA),Vasile Deac (ASE Bucharest, Romania),Cosmin Dobrin(ASE Bucharest, Romania),Enrica Donia(University of Palermo, Italy),Nicolae Drăgulănescu („Politehnica“ University, Bucharest, Romania), Dalina Dumitrescu (ASEBUSS Bucharest, Romania), Numan Muhammet Durakbasa(Vienna University of Technology, Austria),Carlo Giannetto(University of Messina, Italy),Bogdan Ionescu (ASE Bucharest, Romania),Florin Ionescu(Steinbeis University Berlin, Germany),Rudy Kaufmann(University of Nicosia, Cyprus), Alain Kiyindou(University of Strasbourg, France),Maurizio Lanfranchi(Universita Degli Studi di Messina, Italy),Lolita Liberatore (University "G. d’Annunzio" of Chieti-Pescara, Italy),Liviu Măsălar(Liege University, Belgie),Bernard Morard(University of Geneva, Switzerland),Lidia Niculiţă(UTCB, Bucharest, Romania),Max M. North(Coles College of Business, Kennesaw State University, USA), Marieta Olaru(ASE Bucharest, Romania),Bogdan Onete(ASE Bucharest, Romania),Rodica Pamfilie(ASE Bucharest, Romania), Sabka Pashova (University of Economics – Varna, Bulgaria), Iuri Peri (University of Catania, Italy), Ion Popa (ASE Bucharest, Romania), Doina I. Popescu (ASE Bucharest, Romania), Sorin Popescu(Technical University of Cluj-Napoca, Romania), Elena Popkova (Volgograd State Technical University, Russian Federation), Carmen Valentina Rădulescu (ASE Bucharest, Romania), Juozas Ruzevicius (Vilnius University, Lithuania), Filippo Sgroi (University of Palermo, Italy), Larisa Şavga (UCCM University, Chisinau, Republic of Moldova), Angela Tarabella (University of Pisa, Italy), Mihail Aurel Ţîţu (Lucian Blaga University of Sibiu, Romania),Ion Verboncu(ASE Bucharest, Romania),Albert Weckenmann(Friedrich-Alexander University of Erlangen-Nuremberg, Germany),Dominik Zimon(Rzeszow University of Technology, Poland)
English version, Quality-Access to Success, is indexed in:
WEB OF SCIENCE – ESCI, SCOPUS, EBSCO, PROQUEST and CABELL’S Journal address:
Str. Theodor Burada, nr. 6, sector 1, Bucharest – 010215, Romania Tel: 021.313.63.35; Fax: 021.313.23.80
Subscriptions:
Tel: 0731.300.120, 021.313.63.35, 021.310.14.95 Fax: 021.313.23.80
E-mail:[email protected] Website:www.calitatea.srac.ro Pre-press, print, expedition: S.C. Interbrand Impex S.R.L.
The opinions presented in this publication do not necessary represent the point of view of the journal, and represents only the opinions of the authors.
Any form of reproduction of any part of this journal, without the written permission of the author or publisher is forbidden.
Vol. 19, No. 165 - August 2018
Igor M. Krasilnikov,
Modern Technologies of Improving
the Quality of Art Education at Basic School 103
Tatjana Boshkov, Aleksandra Zezova, Mimoza Serafimova,
Career Management and New Organization
Perspectives 110
Asta Rakštelienė, Juozas Ruževičius,
Performance Quality: Influence of Work
Environment Factors for Informal Training Transfer 114
Liliana Mihaela Moga, Ştefania Cristina Mirică, Andreea Elena Matic, Bucur Iulian Dediu,
Particularities of the Human Resources
Evaluation in Public Administration 122
FOOD SAFETY MANAGEMENT FOOD SAFETY MANAGEMENT
Nicola Casolani, Lolita Liberatore, Evangelos Psomas,
Implementation of Quality Management System
with ISO 22000 in Food Italian Companies 125
Valeria Borsellino, Cinzia Zinnanti,
Giuseppina Migliore, Caterina Patrizia Di Franco, Emanuele Schimmenti,
An Exploratory Analysis of Website Quality in the Agrifood Sector: The Case of Extra Virgin Olive Oil 132
S. Blanc, C. Accastello, V. Girgenti, F. Brun, A. Mosso,
Innovative Strategies for the Raspberry Supply Chain: An Environmental and Economic
Assessment 139
INFORMATION SECURITY MANAGEMENT INFORMATION SECURITY MANAGEMENT Adanan Silaban,
The Integration of Technology Acceptance Model with the Uses and Gratification Theory toward the Intention to use Accounting Information
Technology 143
Sabina-Daniela Axinte, Gabriel Petrică, Ioan Bacivarov,
GDPR Impact on Company Management
and Processed Data 150
OCCUPATIONAL HEALTH AND SAFETY OCCUPATIONAL HEALTH AND SAFETY MANAGEMENT
MANAGEMENT
Miriama Piňosová, Miriam Andrejiová, Ervin Lumnitzer,
Synergistic Effect of Risk Factors
and Work Environmental Quality 154
GENERAL MANAGEMENT GENERAL MANAGEMENT
Peter Gallo, Bohuslava Mihalčová, Veronika Timková, Ľuba Tomčíková,
Importance of Financial and Non-financial Indicators in Companies with the
Balanced Scorecard Concept 34
Michal Jenčo, Ľudmila Lysá,
Evaluation of a Work Team Strategy
by using the SWOT Analysis 39
QUALITY MANAGEMENT QUALITY MANAGEMENT
A.N. Plotnikov, A.P. Plotnikov, I.N. Pchelintzeva, O.V. Krasnova,
Some Questions of the Innovative Development Methodology of the Software Production Quality
Management System 45
Lola Faritovna Popova,
The Evaluation of the Quality Management
System Effectiveness 51
Firas M. N. Habbal, Ammar Jreisat,
Implications of Successful Implementation
of Total Quality Management in UAE Universities 56
Marek Botek,
Comparison of Education Evaluation Models 63
V.D. Sekerin, Lyutsiya Mugtabarovna Gaisina, Nikolai Vladimirovich Shutov, Nail Khaditovich Abdrakhmanov, Nika Eduardovna Valitova,
Improving the Quality of Competence-oriented
Training of Personnel at Industrial Enterprises 68
Amalia Venera Todoruţ, Vasileios Tselentis,
Digital Technologies and the Modernization
of Public Administration 73
Iskandar Muda, Sri Hartati Sidauruk, Hasan Sakti Siregar, Nurzaimah,
The Effect of Corporate Social Responsibility on Company’s Value with Common Effects Model (CEM), Fixed Effects Model (FEM) and Random Effects Model (REM) Approaches
(Empirical Evidence in Indonesia Stock Exchange) 79
Liza Mumtazah Damarwulan, Naili Farida, Andriyansah,
The Role of Quality of Entrepreneurial Networking and Responsiveness to Global Business
Environment in Improving the Marketing
Performance of Indonesian Exporting SMEs 91
Musran Munizu, Nurdjanah Hamid,
1. Introduction
A good company should be able to control both the financial and non-financial potential in increasing the company’s value for the company’s existence in the long term. The main goal of a company is to enhance the company’s value through improving the owners or shareholders’ prosperity (Adams and Adams, 2017). High company’s value can increase shareholders’ wel-fare. In general, financial factor is the key that will affect company’s value in the search for funds, raise funds, and allocate the funds to be used efficiently. However, at this time, assessing the performance of a company is not only by the financial factors, but also the non-financial factors since they are very influential on the performance of the company that have an impact on the company’s value in the eyes of investors (Nurzaimahet al., 2016; Martin et al., 2017; Jaskiewicz et al., 2017; Andersonet al., 2017; El Ghoulet al., 2017 and Linet al., 2017). Horvart (2017) found that Romania had one of the highest growth rates of all countries. Since 2013 in SR, only a few stand-alone reports have been found in Latvia and Slovenia, where companies preferred to publish sustainability data included in their annual report or in the case of Latvia on their website without following a certain standard. Kholiset al., (2016) found that indicate that internal factors and external factors determinants of CSR among others, the Company Policy (CP), company reputation (CR), employee engagement (EE), Government Regulation (PP), Community Empowerment, con-sumers, and the Mass Media (MP) has Toward Corporate Social performance (CSP) through Corporate Social Responsibility (CSR). The limitation of this research is that the sample is still limited to foreign investment companies, so it is feared sample bias in Domestic Investment Company. Then there are also difficulties in data retrieval resulting in delays in the observation period of the research. This study also does not discuss the financial data of the company, so it can not measure the
financial performance resulting from corporate CSR spending. The suggestion for further research is that this research can also be implemented in companies listed on the Indonesian stock exchanges, to see the implementation of CSR for public com-panies in Indonesia. The contribution of this research to regulation at the local government level can see the Company's Social Performance in their respective regions with Issuing local regulations on CSR.
Corporate social responsibility is a non-financial factor to consider by the company at this time (Lins et al., 2017; Carnahan et al., 2017; Gupta et al., 2017; Park et al., 2017; Flammer and Luo, 2017; Agudoet al., 2017; Al-Hadiet al., 2017; McCarthyet al., 2017; Nekhiliet al., 2017; Wickertet al., 2017 and Duff, 2017. The business world now faces two conflicting things. On one hand, the company must be responsible especially for the environment in which it operates. On the other hand, the business people should strive to obtain high profits, and supporting such thing needs a cost reduction. Implementation of CSR in Indonesia in 2017 where there are four companies from Indonesia on the list of recipients of Asia Responsible Entrepreneurship Award (AREA) 2017. This award is given by Enterprise Asia. The four companies are PT Japfa Comfeed Indonesia Tbk, PT Combiphar, PT Bhimasena Power Indonesia, and PT Pembangkitan Jawa Bali. AREA is an annual event which this year has been held for the third time. The award criterion is the innovation of corporate social responsibility (CSR) program. In 2017, awards are given in 6 categories, namely social empowerment, investment in people, health promotion, green leadership SME CSR, and responsible business leader-ship. In total, there are 57 companies that receive the award for this year. Four companies from Indonesia who entered the list of beneficiaries in the category of health promotion and social empowerment. The nature of innovation varies, ranging from education about the importance of healthy living, free schooling to community empowerment (www. ptrifanfinancindoberjangka
The Effect of Corporate Social Responsibility on Company’s Value
with Common Effects Model (CEM), Fixed Effects Model (FEM)
and Random Effects Model (REM) Approaches
(Empirical Evidence in Indonesia Stock Exchange)
Iskandar MUDA
1*, Sri Hartati SIDAURUK
1, Hasan Sakti SIREGAR
1, NURZAIMAH
11Faculty Economics and Business, Universitas Sumatera Utara, Medan, North Sumatera, Indonesia
*Corresponding author: Iskandar Muda, Associate Professor, Department of Accounting, Faculty Economics and Business, Universitas Sumatera Utara, Medan, North Sumatera, Indonesia; E-mail: [email protected]
Abstract
This study aimed to analyze the effect of Corporate Social Responsibility (CSR) on Company’s Value (An Empirical Evidence in Indonesia Stock Exchange). This research was an explanatory research to test hypothesis and explain the phenomenon in the form of relationship among variables. The data analysis methods were using time series and cross section panel data analysis. The results showed that the economic variable of Corporate Social Responsibility had a significant effect on the company’s value and the environment variable of Corporate Social Responsibility had no significant effect on the company’s value.
blog.blogdetik.com).
A total of 289 listed companies have not complied with the requirements for environmental compliance or corporate per-formance rating appraisal program (PROPER). Of these, five have black status or are found to have committed grave breaches that damage the environment. In total the company's compliance in PROPER in the year of appraisal 2015-2016 increases. This year the company's obedience reached 85%. In total increased from 2 previous assessment periods, 2013-2014 and 2014-2015, respectively amounting to 72% and 74%, (Director General of Pollution Control and Environmental Damage Ministry of Environment and Forests (KLHK) this year as many as 1930 A total of 1,422 companies are blue or obedient, of which 172 are green or one level above the blue and have been more committed to environmental sustainability as many as 12 companies have gold status or have been fully committed in the industry based Environment, while the rest or 15% are not yet obedient. The status of red 284 or disobedient and 5 black that has been the most severe damaging the environment This is our homework for the next year to make them able to comply with the rules applicable For the recipient of the red status Will be given a warning or sanction according to disobedience. Then the results of the assessment will be used the command as a consideration of the extension of the permit. Currently, the process of law enforcement and investigation of 21 black companies in the period 2014-2015 is also still on-going. However, there are still 4 companies that have not been processed yet. While 5 companies of this year's black category will be handed over to law enforcement of Ministry of Environment of Republic of Indonesia for processing. (Ministry of Environment, 2017)
Indonesian government has finally realized the necessity of protecting the environment in relation with the worsening environmental damage, like deforestation and air and water pollution. This is shown by the forming of the Law of 2007 No. 40 Article 74 on Limited Liability Company, enacted on July 20, 2007, reads: (1) Companies doing business in the field of and/ or in relation to natural resources must put into practice Environmental and Social Responsibility. (2) The Environmental and Social Responsibility contemplated in paragraph (1) con-stitutes an obligation of the Company which shall be budgeted for and calculated as a cost of the Company performance of which shall be with due attention to decency and fairness. (3) Companies who do not put their obligation into practice as contemplated in paragraph (1) shall be liable to sanctions in accordance with the provisions of legislative regulations. (4) Further provisions regarding Environmental and Social Respon-sibility shall be stipulated by Government Regulation. Further-more, for the company recorded its shares on the Indonesia Stock Exchange, the disclosure of corporate social activities like CSR has been stipulated in Capital Market Supervisory Agency Regulation No. Kep-13/BL/2006 dated December 7, 2006. The implementation is expected to give a clear picture of the performance of the management to the social environment. The samples selected by the researcher in this study were the manufacturing companies, since manufacturing company is the company which its main activity is processing raw materials into finished products ready for sale (Mahdaletaet al., 2016 and Lutfi
et al., 2016; Aguinis and Glavas, 2017; Benlemlih, 2017; Pedram et al., 2017; Loosemore and Lim, 2017; Pomering, 2017, Lee, 2017; Eberhardt, 2017; Bento et al., 2017 and Marinovaet al., 2017). Society will give a negative response to the company considered not paying attention to the economic and environmental conditions. The public negative response will threaten the sustainability of the company. The company will disclose some information if such information can enhance the company’s value. Based on the background described above, the problem of this study was: does the corporate social res-ponsibility consisted of economic and environmental variables simultaneously and partially affects the company’s value?
2. Literature Review
2.1. Company’s Value
The company's relationship to its internal and external environment is built on the concept of benefits that can create business continuity and relationships with stakeholders outside the company is not only transactional and short-term but more to the functional relationship is a partnership, in addition to efforts to collect the wealth of the company, also strives to build the quality of sustainability in the future. In this study, company’s value is defined as the market value, because if the stock price increases, the company can deliver prosperity to the share-holders. Company’s value is an important indicator for investors to assess the company as a whole (Mahdaleta et al., 2016; Wassermanet al., 2017; Rubera and Kirca, 2017; Araratet al., 2017). In this study, the ratio used in determining the company’s value was Tobin’s Q. According to Mahdaletaet al., (2016), this ratio was developed by Professor James Tobin in 1967. If the Tobin’s Q is above one, it indicates that the investment in assets generates profits that provide higher value than the investment spending, thus stimulating new investment. If the Tobin’s Q is below one, the investment in assets is not interesting. So, Tobin’s Q is a more precise measure of how effective the mana-gement utilizing economical resources in its power.
2.2. Stakeholder Theory
Stakeholder theory is motivated by the desire to optimize existing resources for use on a full scale. The greater the reputation and the name of the company then the more have a reputation in the eyes of the public. Stakeholder theory was introduced by Freeman,et al., (1984). The concept of corporate social responsibility has been known since the early 1970s, generally known as stakeholder theory. Freeman defines stake-holder as any group or individual who can affect or is affected by achievement of the organization’s objectives (Fischer and Himme, 2017; Wiengarten et al., 2017; Jong and Meer, 2017; Shiu and Yang, 2017; Herreraet al., 2017; Alrubaieeet al., 2017; Abernathyet al., 2017; Forcadell and Aracil, 2017; Stoian and Gilman, 2017 and Galbreath, 2017). Stakeholder theory emphasizes the accountability of the organization more than simple financial or economic performance. Stakeholder theory says that a company is not an entity that only operates for its own benefit, but must provide benefits to stakeholders (share-holders, creditors, consumers, suppliers, governments, commu-nities, analysts and others). Thus, the existence of a company is strongly influenced by the support given by stakeholders to the company (Yasseret al., 2017; Joneset al., 2017; Nasir et al., 2017, Flammer and Bansal, 2017; Azlinaet al., 2017; Juriettiet al., 2017 and Penn & Thomas, 2017). This theory states that an organization will voluntarily disclose information about its environmental, social, and intellectual performance, over and above the obligatory request, to meet the real expectations or the expectations recognized by stakeholders. Stakeholder theory has ethical and managerial fields. Ethical field argues that all stakeholders have the right to be treated fairly by the orga-nization, and managers must manage the organization for the benefit of all stakeholders.
2.3. Corporate Social Responsibility Disclosure
CSR disclosure standards developed in Indonesia are refe-rring to the standards developed by Global Reporting Initiative (GRI). Global Reporting Initiative (GRI) is an organization-based network that has pioneered the development of the world, using sustainable reporting framework the most, and is committed for continuous improvement and application worldwide (www.global reporting.org).
a. Economic Performance Indicator
disclosed in the company’s annual report. The indicator of economic performance shows the flow of funds among shareholders and any economic impact caused by the com-pany’s operating activities on society (Muda and Dharsuky 2015, Mun and Jung, 2017; Trendafiova et al., 2017; Luoet al., 2017; & Erlina et al., 2017; Matthiesen et al., 2017). Economic performance includes revenue, operating costs, profits, EPS, interest rates, the dividends given, and other information contained in the company’s financial statements (Mudaet al., 2016, Lang and Renneboog, 2017; Gardberget al., 2017; Duff, 2017, Martinez et al, 2017 and Cremers, 2017).
b. Environment Performance Indicator
Environmental dimension related to sustainability of the organization affects life in natural systems, including ecosys-tems, land, air and water (Tseng, 2017; Rahmanet al., 2017; Tarmiziet al., 2016 and Erlinaet al., 2017; Wang, 2017 Ben-Amaret al., 2017; Jacobset al., 2017 and Attiget al., 2017). Environmental performance indicators are related to inputs (materials, energy, water) and outputs (emissions, gas, river waste, dry waste or garbage). In addition, their performance includes the performance related to biodiversity, environ-mental compliance, and other relevant information such as environmental waste and the impact of products and services.
The company's business commitment to contribute to sustainable economic development through cooperation with relevant stakeholders in order to contribute to improving their quality of life through ways that benefit both their own business and development and the environment. Concept for corporate social integrity that pays attention to environmental issues in its business operations and conducts interaction relationships with stakeholders based on volunteerism. Some similar research conducted by them Joneset al., (2017); Isaksson and Woodside (2017); Camilleri (2017); Nègreet al., (2017); Harjoto (2017); Papasolomou (2017); Sethi et al., (2017); Kuzey and Uyar (2017); Farringtonet al(2017); Kimet al., (2017); Manasakiset al., (2017); Zeume (2017) and Acquieret al., (2017).
2.4. Research Framework
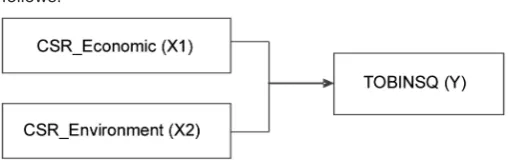
The form of conceptual framework can be described as follows:
From the conceptual framework above, the researcher in-tended to examine the effect of corporate social responsibility consisted of economic and environmental indicators on com-pany’s value. The indicator of economic performance shows the flow of funds among shareholders and any economic impact caused by the company’s operating activities on society. The better the economic indicators disclosed in company reports, the better the company’s financial performance, thus attracting more investors to invest in the company (Lubiset al., 2016; Liu and Zhang, 2017; Gorg et al., 2017 and Byun et al., 2018). The number of investors who bid on the shares of the company will make the company’s stock price higher, thus generating profit for the company which makes the company’s value increased, so that the high company’s value that could improve the welfare of shareholders. Thus, it can be concluded that the disclosure economic indicator of CSR affects the company’s value. The
more the disclosure of economic indicator of CSR, the higher the company’s value.
Environmental indicators in GRI show the extent of the company’s operating activities affecting the environment, both directly and indirectly. The less the impact of the company on the environment and the more caring the company to the environ-ment will bring a positive impact on the company. Disclosure of information about better environment and positive contributions of the company on the environment will make public believe in the company, investors more confident in investing, and the company’s stock price higher because of the positive image of the company, so that the company’s value is guaranteed to grow sustainably (Thang and Fassin, 2017; Hartman et al., 2017; Gómezet al., 2017; Martinezet al., 2017; Rowleyet al., 2017; Orlitzky et al., 2017; Valentine and Godkin, 2017 and Testaet al., 2017). Hypothesis can be interpreted as a temporary answer to the problem formulation of the research (Sirojuzilam et al., 2016). The hypothesis in this study was: corporate social res-ponsibility consisted of economic and environmental variables affects the company’s value simultaneously and partially.
3. Research Method
3.1. Type and Location of the Research
This was an explanatory research to test the hypothesis that explained the phenomenon in the form of relationship among variables to provide an answer to the problem (Lubis et al., 2016; Dalimuntheet al., 2016; Syahyunanet al., 2017; Nurlina
et al., 2017; Ferineet al., 2017; Achmadet al., 2017; Dalimunthe and Muda, 2017; Badaruddinet al., 2017 & Lubiset al., 2017). This study was conducted on the Indonesia Stock Exchange that provided audited financial statements data by accessing and downloading the official website of Indonesia Stock Exchange through the website www.idx.co.id.
3.2. Population and Samples of the Research
Population is the whole subject of research (Gusnardiet al, 2016, Marhayanieet al., 2017; Sirojuzilamet al., 2017; Mudaet al., 2017 and Sihombing et al., 2017). The population in this research were 144 manufacturing companies listed in Indonesia Stock Exchange grouped by sub-sector companies. Sample is a part of the population (part or representation of the population) to be used in research (Yahyaet al., 2017). The sampling was done by using Slovin’s Formula, namely: (Sirojuzilam et al., 2016 and Hasanet al., 2017)
where:
n: The number of members of the sample;
N: Total population;
e: error tolerance limit 10%, then:
so the number of samples in this study were rounded to 60 sectors of companies.
3.3. Data Collection Method
The type of data used in this study was secondary data. The data were obtained from various information, among others the Indonesian Capital Market Directory and the annual report data obtained from the website www.idx.co.id., namely the manufac-turing companies listed in Indonesia Stock Exchange in the period 2010-2015.
Figure 1. Conceptual Framework
N n=
1 +Ne2
144
3.4. Data Analysis Method
The data were analyzed by using panel data regression method, using Eviews software tool. Panel data means that the statistical method with regression that is using panel data is a combination of time series and cross data. The data analysis method used in this study was conducted through a descriptive statistical analysis, data testing, estimation of panel data re-gression model, selection of panel data rere-gression model and hypothesis testing.
3.4.1. Data Testing
From formal normality test of residual with OLS method, it can be seen whether the residual is normally distributed or not by comparing Jarque-Bera (JB) value with Chi Square with α = 0.05 and df = 2, of 5.9915 i.e.: (Tarmiziet al., 2017; Handoko
et al., 2017 & Sadaliaet al., 2017):
1. If the JB value > 5.9915 then the residual is not normally distributed;
2. If the JB value < 5.9915 then the residual is normally distributed.
3.4.2. Estimation of Panel Data Regression Model
The equation model of panel data as a combination of cross section and time series data is as follows:
Yit=α+β1X1it+β2X2it+εit
where:
Yit : TOBINSQ
X1 : CSR_ Economic
X2 : CSR_Environment
α : Constant
β1,β2 : Regression Coefficient
ε : error
In the panel data analysis, there were several methods of analysis, namely, Common Effects Model (CEM), Fixed Effects Model (FEM) and Random Effects Model (REM).
3.4.2.1. Common Effects Model (CEM)
Common Effects Model (CEM) refers to the model with constant intercept and slope coefficients, thus ignoring the dimensions of place and time of panel data and using OLS regression estimation to estimate (Gujarati, 2004). Which this method can be analyzed in two approach models, namely, Fixed Effects Model (FEM) and Random Effects Model (REM).
3.4.2.2. Fixed Effects Model (FEM)
Fixed Effects Model (FEM) refers to the model with a constant slope but different intercept based on cross section (in this case, the companies). Although the intercept may differ among companies, but each intercept did not differ from time to time (Gujarati, 2004). Estimation with OLS makes this esti-mation a general estiesti-mation least square fixed effect, so that the data generated are consistent and not biased.
3.4.2.3. Random Effects Model (REM)
Random Effects Model (REM) refers to the model with a constant slope but different intercept based on cross section (in this case, the companies) randomly and not fixed (Gujarati, 2004). In the Fixed Effects Model, the differences among indi-viduals are reflected by the intercept or constant, but in the Random Effects Model, the differences are accommodated by the error terms of each individual.
3.4.3. Selection of Panel Data Regression Model
3.4.3.1. Chow Test
Ho: Probability > 0.05, then the Common Effects Model (CEM) is valid to use
Ha: Probability < 0.05, then the Fixed Effects Model (FEM) is valid to use
3.4.3.2. Hausman Test
Ho: Probability > 0.05, then the Random Effects Model (REM) is valid to use
Ha: Probability < 0.05, then the Fixed Effects Model (FEM) is valid to use
3.4.4. Hypothesis Testing
Hypothesis testing was done by using panel data regression analysis model, i.e.:
NP = a + b1.1CSRE + b1.2CSL + e
Note:
NP : Company’s Value CSRE : CSR Economic CSRL : CSR Environment
4. Result and Discussion
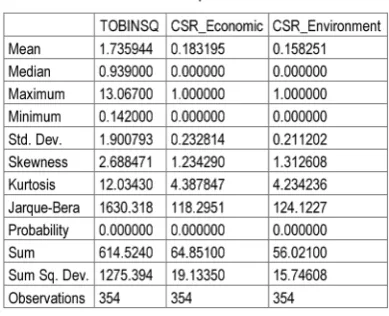
3.1. Descriptive Statistics Analysis
The description of research data in statistics from each of the variables examined included mean, minimum, maximum, and standard deviation can be seen in the followingTable:
4.1.1. Data Testing
Jarque-Bera (JB) with Chi Square with α = 0.05 and df = 2, of 5.9915 i.e.:
Table 1. Descriptive Statistics
Source: Eviews Results (2017)
Figure2. Normality Test
1. If the JB value > 5.9915 then the residual is not normally distributed
2. If the JB value < 5.9915 then the residual is normally distributed
Based on the table above, it can be concluded that the probability value is greater than α = 0.05 and JB value for Tobin’s Q variable has a JB value less than 5.9915, so that the residual is normally distributed. Thus, it can be concluded that the Tobin’s Q observed is normally distributed.
4.1.2. Estimation of Panel Data Regression Model
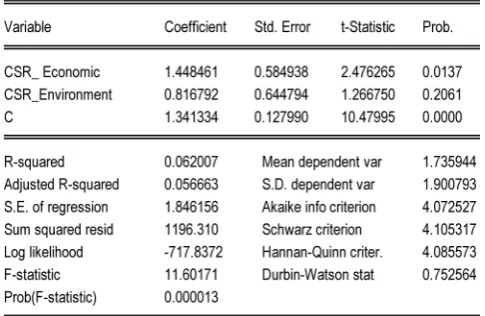
4.1.2.1. Common Effects Model
Common Effects Model (CEM) generates the following equ-ation:
NP = 1.341 + 1.448CSRE + 0.816CSL
The estimation results by the Common Effects Model (CEM) with common intercept gives a coefficient of determination value of Adjusted R-squared of 0.056, meaning that the CSR dis-closure variable is able to explain the company’s value variable proxied by Tobin’s Q of 5.6%, while 94.4% is explained by other variables.
4.1.2.2. Fixed Effects Model
Fixed Effects Model (FEM) generates the following equation:
NP = 1.449 + 1.184CSRE + 0.436CSRL + [CX=F]
The tableshows the constant value of each sample of the manufacturing companies in the Indonesia Stock Exchange with each company code.
Table 2. Common Effects Model
Source: Eviews Results (2017)
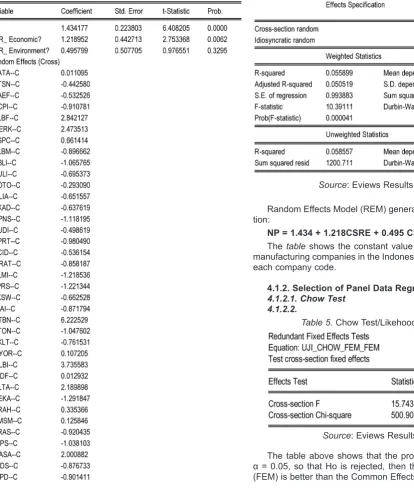
Random Effects Model (REM) generates the following equa-tion:
NP = 1.434 + 1.218CSRE + 0.495 CSRL + [CX=R]
Thetable shows the constant value of each sample of the manufacturing companies in the Indonesia Stock Exchange with each company code.
4.1.2. Selection of Panel Data Regression Model
4.1.2.1. Chow Test 4.1.2.2.
The table above shows that the prob. 0.0000 smaller than α = 0.05, so that Ho is rejected, then the Fixed Effects Model (FEM) is better than the Common Effects Model (CEM).
Source: Eviews Results (2017)
Table 4. Random Effects Model
Source: Eviews Results (2017)
Table 5. Chow Test/Likehood Ratio Test
4.1.2.3. Hausman Test
The table above shows that the prob. = 0.0057 smaller than α = 0.05, so that Ho is rejected, then the model used is the Fixed Effects Model (FEM). Based on the testing to choose a model with Chow and Hausman tests, it can be concluded that the model is more appropriate to take the Fixed Effects Model (FEM), compared with the Common Effects Model (CEM) and the Random Effects Model (REM).
4.1.3. Hypothesis Testing
The selected model in the hypothesis testing according to panel data regression model selection is the Fixed Effects Model (FEM). Fixed Effects Model (FEM) generates the following equation:
NP = 1.449 + 1.184CSRE + 0.436CSRL + [CX=F]
1. Constant = 1.449
These results indicate no independent variables, namely, CSR economy, environment, product, social, work force, institutional ownership, managerial ownership, and inde-pendent board of commissioners, then the Tobin’s Q is 1.449. 2. CSR Economy Disclosure = 1.184
CSR Economy regression coefficient in the testing is 1.184, meaning that the CSR Economy disclosure positively affects Tobin’s Q, so that if the CSR Economy disclosure increases 1 point, the Tobin’s Q will increase by 1.184 points.
3. CSR Environment Disclosure = 0.436
CSR Environment regression coefficient in the testing is 0.436, meaning that the CSR Environment disclosure positively affects Tobin’s Q, so that if the CSR Environment disclosure increases 1 point, the Tobin’s Q will increase by 0.436 points.
4.1.4. Coefficient of Determination Test
The coefficient of determination statistical test by seeing the Adjusted R-squared value in the table is as follows:
TheTable 7shows the Adjusted R-squared value of 0.7254 or 72.54%, meaning that 72.54% of Tobin’s Q variable can be explained by CSR disclosure which consists of economy, envi-ronment, social, product, work force, and GCG which consists of institutional ownership, managerial ownership and board of co-mmissioners, and the rest of 27.42% is explained by other variables not included in the equation.
4.1.5. F Test
F test was conducted to determine whether the independent variables simultaneously have a significant effect on the de-pendent variables or not. The Fixed Effects Model can be seen in the followingTable:
Based on the table above, F count value of 15.45068 > Ftable value of 1.371 with a Prob (F-statistic) significance value of 0.000000 < 0.05. This shows that the independent variable, namely, corporate social simultaneously has a significant effect on the dependent variable, namely, company’s value proxied by Tobin’s Q.
4.1.6. t Test
Based on the test results in Table 9, the effect of each independent variable on the dependent variable partially can be described as follows:
1. CSR Economy disclosure has a t statistic value of 2.58939 > ttableof 1.966864 with prob. significance = 0.0101 < α = 0.05, thus it can be concluded that the disclosure of CSR economic variable significantly affects the company’s value proxied by the Tobin’s Q in the manufacturing compa-nies listed on the Indonesian Stock Exchange during 2010-2015.
2. CSR Environment disclosure has a t statistic value of 0.82509 < ttableof 1.966864 with prob. significance = 0.40 > α = 0.05, thus it can be concluded that the disclosure of CSR environmental variable does not significantly affect the company’s value proxied by the Tobin’s Q in the
manufac-Table 6. Correlated Random Effects-Hausman Test
Source: Eviews Results (2017)
Source: Eviews Results (2017)
Table7. Coefficient of Determination Test
Table 8. F Test Statistical Model
Source: Eviews Results (2017)
Table 9. T Test Statistical Model
turing companies listed on the Indonesian Stock Exchange during 2010-2015.
4.2. Discussion
Based on the results of hypothesis testing, then the dis-cussion can be made as follows:
4.2.1. The effect of CSR economy disclosure on company’s value
The partial test results showed that the disclosure of CSR economy showing a positive regression coefficient of 1.184681 with t statistic of 2.58939 > ttable of 1.966864 with prob. significance = 0.01 < α = 0.05. Positive regression coefficient indicated that the CSR economy was in line with the company’s value, which the more increasing the CSR economy, the more increasing the company’s value, and vice versa, the more decreasing the CSR economy, the more decreasing the com-pany’s value. The test results showed an empirical evidence that CSR economy significantly affected the company’s value pro-xied by the Tobin’s Q. These results showed that the appropriate disclosure of social and economic responsibilities was not addressed as something needs to consider by the parties concerned to be the concern of new investors (Giulianoet al., 2017; Skilton et al., 2017; Mishra, 2017; Kabir et al., 2017; Arslanagicet al., 2017; Chenet al., 2017 and Rojaset al., 2017). The value of a company is a certain condition that has been achieved by a company as a picture of public confidence in the company after through a process of activity for several years, ie since the company was established until now. Increasing the value of a company is an achievement, in accordance with the wishes of its owners, because with the increased value of the company, then the welfare of the owners will also increase. With the principle of responsilbility, emphasis is placed on the interests of corporate stakeholders. In this case the company is required to pay attention to the interests of the company's stake-holders, creating value added of products and services for the company's stakeholders and maintaining the added value sustainability it creates. While corporate stakeholders can be defined as the parties concerned about the existence of the company. These include employees, consumers, suppliers, communities, the environment and government as regulators. CSR as an idea, the company is no longer faced with the responsibility that rests on the single bottom line, the value of the company is reflected in the financial condition of financial. But the company's responsibility should rest on the triple bottom lines. In this case the other bottom lines in addition to finance is social and Public Relations Role in Building Corporate Image through the environment. Company sustainability will only be ensured if the company takes into account the social and en-vironmental dimensions (Hickle, 2017; Panicker 2017; Farooqet al., 2017 and Marinet al., 2017; Van and Tubergen, 2017 and Jain et al., 2017). It is a fact of how the resistance of the surrounding community in various places and times arose the surface of the company regarded as not paying attention to the social, economic, and environmental aspects. The company's efforts to increase profits and increase production capacity without implementing social responsibility leads to poor cor-porate repitability. CSR is one of the most valuable business capital, especially in increasing the value of the company in the surrounding environment.
4.2.2. The effect of CSR environment disclosure on company’s value
The partial test results showed that the disclosure of CSR environment showing a positive regression coefficient of 0.436082 with t statistic of 0.82578 < ttable of 1.966864 with
prob. significance = 0.4096 < α = 0.05. Positive regression coefficient indicated that the CSR environment was in line with
the company’s value, which the more increasing the CSR environment, the more increasing the company’s value, and vice versa, the more decreasing the CSR environment, the more decreasing the company’s value. The test results showed an empirical evidence that CSR environment did not significantly affect the company’s value. This happened because there were still some companies that were less revealing a social accountability report in the field of environment. High corporate value is the desire of the owners of the company, because with a high value shows the shareholder prosperity is also high. The wealth of shareholders and the company is presented by the market price of the stock which is a reflection of investment decisions, financing, and asset management (Sadovnikova et al., 2017; Okazaki and Menendez, 2017; Assaf et al., 2017; Chen and Lee., 2017; Martinezet al., 2017; Alamgiret al., 2017; Evanset al., 2017; Maonet al., 2017 and Torkkeliet al., 2017). Basically the purpose of financial management is to maximize the value of the company. But behind the goal there is still a conflict between the owner of the company and the provider of funds as a creditor. If the company runs smoothly, then the value of the company's shares will increase, while the value of the company's debt in the form of bonds is not affected at all. So it can be concluded that the value of the stock of ownership can be an appropriate index to measure the level of corporate effectiveness. For this reason, the financial management objec-tives are expressed in the form of maximizing the value of shares of company ownership, or maximizing stock prices. The goal of maximizing stock prices does not mean that managers should seek to increase stock value at the expense of bond-holders (Balakrishnanet al., 2017; Famiyeh, 2017; Zientara et al., 2017; Rothenberget al., 2017; Sorensenet al., 2017; Minet al., 2017 and Hoffmann, 2018). Corporate value is very impor-tant because with high corporate value will be followed by high shareholder wealth. The higher the stock price the higher the value of the company.
5. Conclusions and Suggestions
5.1. Conclusion
Based on the simultaneous results of analysis, the inde-pendent variables of corporate social responsibility of economy and environment significantly affected the value of manufac-turing companies in the Indonesia Stock Exchange. Partially, the CSR economic variable disclosure significantly affected the company’s value and the CSR environmental variable did not significantly affect the company’s value.
5.2. Suggestion
Since this study was limited to the manufacturing companies listed on the Indonesia Stock Exchange, the next studies better to conduct on all companies listed on the Indonesia Stock Exchange. It also needs to be investigated the implementation of CSR for companies that do not list on the Stock Exchange is a small company that operates in several areas in Indonesia but allocate CSR programs in the field of economy and environ-ment, especially in oil companies that operate in Indonesia. Some companies that allocate profits to CSR programs have job descriptions that deal with the implementation of CSR but its implementation does not have transparent accountability, have program planning that less involving the community and tend to based on routine activities that must be realized.
References
[2] Achmad, Nurman; & Muda, I. (2017). Economic Activities of Karo Older Adults in Lingga Village, Tanah Karo Regency, North Sumatera, Indonesia.International Journal of Economic Research. 14(16). 365-379.
[3] Acquier, A., Valiorgue, B., & Daudigeos, T. (2017). Sharing the shared value: A transaction cost perspective on strategic CSR policies in global value chains.Journal of Business Ethics, 144(1). 139-152.
[4] Adams, C. A., & Adams, C. A. (2017). Conceptualising the contemporary corporate value creation process. Accounting,
Auditing & Accountability Journal, 30(4). 906-931.
[5] Agudo-Valiente, J. M., Garcés-Ayerbe, C., & Salvador-Figueras, M. (2017). Corporate Social Responsibility Drivers and Barriers According to Managers’ Perception; Evidence from Spanish Firms.
Sustainability, 9(10). 1821-1831.
[6] Aguinis, H., & Glavas, A. (2017). On corporate social responsibility, sensemaking, and the search for meaningfulness through work.
Journal of Management, 0149206317691575.
[7] Alamgir, M., & Nasir Uddin, M. (2017). The Mediating Role of Corporate Image on the Relationship between Corporate Social Responsibility and Firm Performance: An Empirical Study.
International Journal of Business and Development Studies, 9(1). 91-111.
[8] Al-Hadi, A., Chatterjee, B., Yaftian, A., Taylor, G., & Monzur Hasan, M. (2017). Corporate social responsibility performance, financial distress and firm life cycle: evidence from Australia.Accounting & Finance. 13(2). 45-59.
[9] Alrubaiee, L. S., Aladwan, S., Joma, M. H. A., Idris, W. M., & Khater, S. (2017). Relationship between Corporate Social Responsibility and Marketing Performance: The Mediating Effect of Customer Value and Corporate Image.International Business Research, 10(2). 104.
[10] Anderson, A., Brown, J., & Gupta, P. P. (2017). Jurisdictional competition for corporate charters and firm value: a reexamination of the Delaware effect. International Journal of Disclosure and Governance, 1-16.
[11] Ararat, M., Black, B. S., & Yurtoglu, B. B. (2017). The effect of corporate governance on firm value and profitability: Time-series evidence from Turkey.Emerging Markets Review, 30, 113-132. [12] Arslanagic-Kalajdzic, M., Arslanagic-Kalajdzic, M., Zabkar, V., &
Zabkar, V. (2017). Hold me responsible: The role of corporate social responsibility and corporate reputation for client-perceived value.Corporate Communications: An International Journal, 22(2). 209-219.
[13] Assaf, A. G., Josiassen, A., Ahn, J. S., & Mattila, A. S. (2017). Advertising spending, firm performance, and the moderating impact of CSR.Tourism Economics, 1354816617704739. [14] Attig, N., & Brockman, P. (2017). The local roots of corporate social
responsibility.Journal of Business Ethics, 142(3). 479-496. [15] Azlina, Nur. Amir Hasan, Desmiyawati & Muda, I. (2017). The
Effectiveness of Village Fund Management (Case Study at Villages in Coastal Areas in Riau). International Journal of Economic Research. 14(12). 325-336.
[16] Azlina, Nur. Amir Hasan, Desmiyawati & Muda, I. (2017). The Effectiveness of Village Fund Management (Case Study at Villages in Coastal Areas in Riau). International Journal of Economic Research. 14(12). 325-336.
[17] Badaruddin; Revida, E; Ermansyah & Muda, I. (2017). Village Governance With Implementation of Law Number 6 of 2014 On The Village and Village Administration. International Journal of Economic Research. 14(16). 350-363.
[18] Balakrishnan, J., Malhotra, A., & Falkenberg, L. (2017). Multi-Level Corporate Responsibility: A Comparison of Gandhi’s Trusteeship with Stakeholder and Stewardship Frameworks. Journal of Business Ethics, 141(1). 133-150.
[19] Ben-Amar, W., Chang, M., & McIlkenny, P. (2017). Board gender diversity and corporate response to sustainability initiatives: evidence from the Carbon Disclosure Project.Journal of Business Ethics, 142(2), 369-383.
[20] Benlemlih, M. (2017). Corporate social responsibility and firm debt maturity.Journal of Business Ethics, 144(3). 491-517.
[21] Bento, R. F., Mertins, L., & White, L. F. (2017). Ideology and the balanced scorecard: An empirical exploration of the tension between shareholder value maximization and corporate social responsibility.Journal of Business Ethics, 142(4). 769-789. [22] Bice, S. (2017). Corporate social responsibility as institution: A
social mechanisms framework. Journal of Business Ethics,
143(1).17-34.
[23] Byun, S. K., & Oh, J. M. (2018). Local corporate social respon-sibility, media coverage, and shareholder value. Journal of Banking & Finance, 87, 68-86.
[24] Camilleri, M. A. (2017). Corporate sustainability and responsibility: creating value for business, society and the environment.Asian Journal of Sustainability and Social Responsibility, 2(1), 59. [25] Carnahan, S., Kryscynski, D., & Olson, D. (2017). When does
corporate social responsibility reduce employee turnover? Evidence from attorneys before and after 9/11. Academy of Management Journal, 60(5), 1932-1962.
[26] Chen, R. C., & Lee, C. H. (2017). Assessing whether corporate social responsibility influence corporate value.Applied Economics, 1-11.
[27] Chen, R. C., Hung, S. W., & Lee, C. H. (2017). Does corporate value affect the relationship between Corporate Social Responsibility and stock returns?Journal of Sustainable Finance & Investment, 7(2), 188-196.
[28] Cremers, M. (2017). What corporate governance can learn from catholic social teaching.Journal of Business Ethics, 1-14. [29] Dalimunthe, D.M.J., and Muda, I. (2017). The Empirical Effect of
Education and Training to The Performance of Employees.
International Journal of Applied Business and Economic Research.
15(24). 5423-5437.
[30] Dalimunthe, D.M.J., Fadli, and Muda, I. (2016). The application of performance measurement system model using Malcolm Baldrige Model (MBM) to support Civil State Apparatus Law (ASN) number 5 of 2014 in Indonesia.International Journal of Applied Business and Economic Research. 14(11). 7397-7407.
[31] Duff, A. (2017). Corporate social responsibility as a legitimacy maintenance strategy in the professional accountancy firm.The British Accounting Review, 49(6). 513-531.
[32] Eberhardt-Toth, E. (2017). Who should be on a board corporate social responsibility committee? Journal of Cleaner Production, 140. 1926-1935.
[33] El Ghoul, S., Guedhami, O., & Kim, Y. (2017). Country-level institutions, firm value, and the role of corporate social responsibility initiatives.Journal of International Business Studies, 48(3). 360-385.
[34] Erlina, Ari Saputra & Muda, I. (2017). Antecedents of Budget Quality Empirical Evidence from Provincial Government In Indonesia. International Journal of Economic Research. 14(12). 301-312.
[35] Erlina, Ari Saputra & Muda, I. (2017). Antecedents of Budget Quality Empirical Evidence from Provincial Government In Indonesia. International Journal of Economic Research. 14(12). 301-312.
[36] Erlina. Ari Saputra & Muda, I. (2017). The Analysis of the Influencing Factors of Budget Absorption.International Journal of Economic Research. 14(12). 287-300.
[37] Erlina. Ari Saputra & Muda, I. (2017). The Analysis of the Influencing Factors of Budget Absorption.International Journal of Economic Research. 14(12). 287-300.
[38] Evans, S., Vladimirova, D., Holgado, M., Van Fossen, K., Yang, M., Silva, E. A., & Barlow, C. Y. (2017). Business Model Innovation for Sustainability: Towards a Unified Perspective for Creation of Sustainable Business Models. Business Strategy and the Environment.
[39] Famiyeh, S. (2017). Corporate social responsibility and firm’s performance: empirical evidence. Social Responsibility Journal, 13(2). 390-406.
[40] Farooq, O., Rupp, D. E., & Farooq, M. (2017). The multiple pathways through which internal and external corporate social responsibility influence organizational identification and multifoci outcomes: The moderating role of cultural and social orientations.
Academy of Management Journal. 60(3). 954-985.
[41] Farrington, T., Farrington, T., Curran, R., Curran, R., Gori, K., Gori, K., ... & Queenan, C. J. (2017). Corporate social responsibility: reviewed, rated, revised. International Journal of Contemporary Hospitality Management, 29(1). 30-47.
[42] Ferine, Kiki Farida; Ermiaty, C. & Muda, I. (2017). The Impact Of Entrepreneurship And Competence On Small Medium Enterprises Tangan Di Atas (TDA) Medan Entrepreneurs’ Work Performance.
International Journal of Economic Research. 14(16). 380-393. [43] Fischer, M., & Himme, A. (2017). The financial brand value chain:
How brand investments contribute to the financial health of firms.
[44] Flammer, C., & Bansal, P. (2017). Does a long-term orientation create value? Evidence from a regression discontinuity.Strategic Management Journal.8(2). 99-117.
[45] Flammer, C., & Luo, J. (2017). Corporate social responsibility as an employee governance tool: Evidence from a quasi-experiment.
Strategic Management Journal, 38(2). 163-183.
[46] Forcadell, F.J., & Aracil, E. (2017). European Banks' Reputation for Corporate Social Responsibility.Corporate Social Responsibility and Environmental Management, 24(1). 1-14.
[47] Freeman, R.E. (1984). Strategic Management: A Stakeholder Approach, Boston, Pitman.
[48] Galbreath, J. (2017). The impact of board structure on corporate social responsibility: a temporal view.Business Strategy and the Environment, 26(3). 358-370.
[49] Gardberg, N.A., Zyglidopoulos, S.C., Symeou, P.C., & Schepers, D.H. (2017). The Impact of Corporate Philanthropy on Reputation for Corporate Social Performance. Business & Society, 0007650317694856.
[50] Giuliano, R., Mahy, B., Rycx, F., & Vermeylen, G. (2017). Does corporate social responsibility make over-educated workers more productive?Applied Economics, 49(6). 587-605.
[51] Gómez-Bezares, F., Przychodzen, W., & Przychodzen, J. (2017). Bridging the gap: How sustainable development can help companies create shareholder value and improve financial performance.Business Ethics: A European Review, 26(1). 1-17. [52] Görg, H., Hanley, A., Hoffmann, S., & Seric, A. (2017). When Do
Multinational Companies Consider Corporate Social Responsibility? A Multi-country Study in Sub-Saharan Africa.
Business and Society Review, 122(2). 191-220.
[53] Gujarati, Damodar, (2004). Basic Econometrics. Translation: Sumarno Zain, Erlangga Publishers. Jakarta.
[54] Gupta, A., Briscoe, F., & Hambrick, D.C. (2017). Red, blue, and purple firms: Organizational political ideology and corporate social responsibility.Strategic Management Journal, 38(5). 1018-1040. [55] Gusnardi, Riadi, R.M., and Muda, I. (2016). Competency mapping
and analysis of students competency based on economics subject national examination and its alternative solutions in state high schools at Pekanbaru. International Journal of Economic Research. 3(5). 2133-2148.
[56] Handoko, Bagus. Sunaryo & Muda, I. (2017). Difference Analysis of Consumer Perception of Motorcycle Product Quality.
International Journal of Economic Research. 14(12). 363-379. [57] Handoko, Bagus. Sunaryo & Muda, I. (2017). Difference Analysis
of Consumer Perception of Motorcycle Product Quality.
International Journal of Economic Research. 14(12). 363-379. [58] Harjoto, M.A. (2017). Corporate social responsibility and degrees
of operating and financial leverage. Review of Quantitative Finance and Accounting, 49(2). 487-513.
[59] Hartman, L. P., Werhane, P. H., Clark, C. E., Vansandt, C. V., & Sud, M. (2017). Strategic Global Strategy: The Intersection of General Principles, Corporate Responsibility and Economic Value-Added.Business and Society Review, 122(1). 71-91.
[60] Hasan, Amir, Gusnardi & Muda, I. (2017). Analysis of Taxpayers and Understanding Awareness Increase in Compliance with Taxpayers Individual Taxpayers.International Journal of Economic Research. 14(12). 75-90.
[61] Hasan, Amir, Gusnardi & Muda, I. (2017). Analysis of Taxpayers and Understanding Awareness Increase in Compliance with Taxpayers Individual Taxpayers.International Journal of Economic Research. 14(12). 75-90.
[62] Herrera, Alvarado, A., Bigne, E., Aldas-Manzano, J., & Curras-Perez, R. (2017). A scale for measuring consumer perceptions of corporate social responsibility following the sustainable development paradigm.Journal of Business Ethics, 140(2). 243-262.
[63] Hickle, G. (2017). Extending the boundaries: an assessment of the integration of extended producer responsibility within corporate social responsibility. Business Strategy and the Environment, 26(1). 112-124.
[64] Hoffmann, J. (2018). Talking into (non) existence: Denying or constituting paradoxes of Corporate Social Responsibility.Human Relations, 0018726717721306.
[65] Horváth, Péter, Judith M. Pütter, Lina Dagilienė, Dzineta Dimante, Toomas Haldma, Cezary Kochalski, Bohumil Král, Davor Labaš, Kertu Lääts, Nidžara Osmanagić Bedenik, Renáta Pakšiová, Petr Petera, Piotr Ratajczak, Adriana Rejc Buhovac, Adriana Sava, VoicuIon Sucală, Tamás József Tirnitz, Jaroslav Wagner (2017).
Status Quo and Future Development of Sustainability Reporting in Central and Eastern Europe. JEEMS, 22(2): 221-243. DOI: 10.5771/0949-6181-2017-2-221.
[66] ICSRA (2017). 41 Companies Received ICSRA I Award 2017.
Retrieve on
http://ptrifanfinancindoberjangkablog.blogdetik.com/2017/02/27/4 1-perusahaan-raih-penghargaan-icsra-i-2017 14 Aaugust 2017. [67] Isaksson, L.E., & Woodside, A.G. (2017). The Complexity Turn to
Modeling Firm Heterogeneity in Corporate Social and Financial Performance. In The Complexity Turn (pp. 185-247). Springer International Publishing.
[68] Jacobs, B., Subramanian, R., Hora, M., & Singhal, V. (2017). Market Value Implications of Voluntary Corporate Environmental Initiatives (CEIs). InSustainable Supply Chains. 319-338. Springer International Publishing.
[69] Jain, T., Aguilera, R. V., & Jamali, D. (2017). Corporate stakeholder orientation in an emerging country context: A longitudinal cross industry analysis.Journal of Business Ethics, 143(4), 701-719. [70] Jaskiewicz, P., Block, J. H., Combs, J. G., & Miller, D. (2017). The
effects of founder and family ownership on hired CEOs’ incentives and firm performance. Entrepreneurship Theory and Practice, 41(1), 73-103.
[71] Jones, D. A., Willness, C. R., & Glavas, A. (2017). When Corporate Social Responsibility (CSR) Meets Organizational Psychology: New Frontiers in Micro-CSR Research, and Fulfilling a Quid Pro Quo through Multilevel Insights.Frontiers in Psychology, 8. [72] Jones, R. J., Reilly, T. M., Cox, M. Z., & Cole, B. M. (2017). Gender
makes a difference: Investigating consumer purchasing behavior and attitudes toward corporate social responsibility policies.
Corporate Social Responsibility and Environmental Management, 24(2). 133-144.
[73] Jong, De, M. D., & van der Meer, M. (2017). How does it fit? Exploring the congruence between organizations and their corporate social responsibility (CSR) activities.Journal of Business Ethics, 143(1). 71-83.
[74] Jurietti, E., Mandelli, A., & Fudurić, M. (2017). How do virtual corporate social responsibility dialogs generate value? A case study of The Unilever Sustainable Living Lab. Corporate Social
Responsibility and Environmental Management. 1894). 55-69. [75] Kabir, R., Kabir, R., Thai, H. M., & Thai, H. M. (2017). Does
corporate governance shape the relationship between corporate social responsibility and financial performance?Pacific Accounting Review, 29(2), 227-258.
[76] Kholis, Azizul, Ade Fatma, Azhar Maksum and Rina Bukit (2016). Determinants Of Corporate Social Performance (CSP) Through Corporate Social Responsibility (CSR) Of Foreign Investment Companies (PMA) In Indonesia.International Journal of Economic Research. 13(5). 2003-2025.
[77] Kim, H. L., Rhou, Y., Uysal, M., & Kwon, N. (2017). An examination of the links between corporate social responsibility (CSR) and its internal consequences. International Journal of Hospitality Management, 61, 26-34.
[78] Kuzey, C., & Uyar, A. (2017). Determinants of sustainability reporting and its impact on firm value: Evidence from the emerging market of Turkey.Journal of Cleaner Production, 143, 27-39. [79] Lee, D. (2017). Corporate social responsibility and management
forecast accuracy.Journal of Business Ethics, 140(2). 353-367. [80] Liang, H., & Renneboog, L. (2017). On the foundations of
corporate social responsibility.The Journal of Finance, 72(2). 853-910.
[81] Lin, H.C., Lin, H.C., Wang, C.S., Wang, C.S., Wu, R.S., & Wu, R.S. (2017). Does corporate ethics help investors forecast future earnings?Social Responsibility Journal, 13(1), 62-77.
[82] Lins, K. V., Servaes, H., & Tamayo, A. (2017). Social capital, trust, and firm performance: The value of corporate social responsibility during the financial crisis.The Journal of Finance. 18(1). 235-249. [83] Liu, X., & Zhang, C. (2017). Corporate governance, social responsibility information disclosure, and enterprise value in China. Journal of Cleaner Production, 142, 1075-1084.
[84] Loosemore, M., & Lim, B.T.H. (2017). Linking corporate social responsibility and organizational performance in the construction industry.Construction Management and Economics, 35(3). 90-105. [85] Lubis, A., Rustam and Muda, I. (2017). Factors Affecting The Cost of Agency of Village Owned Enterprise (BUMDES) in Indonesia.
International Journal of Economic Research. 14(16). 334-348. [86] Lubis, A.,Torong, Z.B., and Muda, I. (2016). The urgency of
North Sumatra – Indonesia. International Journal of Applied Business and Economic Research. 14(11). 7575-7590.
[87] Lubis, A.F., Lubis, T.A., and Muda, I. (2016). The role of Enterprise Resource Plan (ERP) configuration to the timeliness of the financial statement presentation.International Journal of Applied Business and Economic Research. 14(11). 7591-7608.
[88] Luo, J.M., Lam, C.F., Chau, K.Y., Shen, H.W., & Wang, X. (2017). Measuring Corporate Social Responsibility in Gambling Industry: Multi-Items Stakeholder Based Scales.Sustainability, 9(11), 2012. [89] Lutfi, M.,Nazwar, C., and Muda, I (2016). Effects of investment opportunity set, company size and real activity manipulation of issuers in Indonesia Stock Exchange on stock price in Indonesia.
International Journal of Economic Research. 13(5): 2149-2161. [90] Mahdaleta, Ela; Iskandar Muda and Gusnardi Muhammad Nasir
(2016). Effects of Capital Structure and Profitability on Corporate Value with Company Size as the Moderating Variable of Manufacturing Companies Listed on Indonesia Stock Exchange.
Academic Journal of Economic Studies. 2(3): 30-43.
[91] Manasakis, C., Mitrokostas, E., & Petrakis, E. (2017).Strategic corporate social responsibility by a multinational firm(No. 246). DICE Discussion Paper.
[92] Maon, F., Swaen, V., & Lindgreen, A. (2017). One vision, different paths: an investigation of corporate social responsibility initiatives in Europe.Journal of Business Ethics, 143(2), 405-422.
[93] Marhayanie, Mutia Ismail and Muda, I. (2017). Impact of The Online Car Rental Service Order System on Sales Turnover with Financial Literacy Customer as Intervening Variables.International Journal of Economic Perspectives. 14(16). 317-332.
[94] Marin, L., Martín, P. J., & Rubio, A. (2017). Doing Good and Different! The Mediation Effect of Innovation and Investment on the Influence of CSR on Competitiveness. Corporate Social Responsibility and Environmental Management, 24(2). 159-171. [95] Marinova, S., Nummela, N., & Larimo, J. (2017). Value Creation in
the Internationalization of SMEs. InValue Creation in International Business. 1-15. Springer International Publishing.
[96] Martin, K. D., Borah, A., & Palmatier, R. W. (2017). Data privacy: Effects on customer and firm performance.Journal of Marketing, 81(1), 36-58.
[97] Martinez, A. D., Russell, Z. A., Maher, L. P., Brandon-Lai, S. A., & Ferris, G. R. (2017). The Sociopolitical Implications of Firm Reputation: Firm Financial Reputation× Social Reputation Interaction on Firm Financial Performance.Journal of Leadership & Organizational Studies, 24(1), 55-64.
[98] Martinez, Conesa, I., Soto-Acosta, P., & Palacios-Manzano, M. (2017). Corporate social responsibility and its effect on innovation and firm performance: An empirical research in SMEs.Journal of Cleaner Production, 142(2). 2374-2383.
[99] Martínez, D., Herrera Madueño, J., J., Larrán Jorge, M., Larrán Jorge, M., & Lechuga Sancho, M. P. (2017). The strategic nature of corporate social responsibility in SMEs: A multiple mediator analysis.Industrial Management & Data Systems, 117(1). 2-31. [100] Matthiesen, M. L., Matthiesen, M. L., Salzmann, A. J., & Salzmann,
A. J. (2017). Corporate social responsibility and firms’ cost of equity: how does culture matter? Cross Cultural & Strategic Management, 24(1). 105-124.
[101] McCarthy, S., Oliver, B., & Song, S. (2017). Corporate social responsibility and CEO confidence.Journal of Banking & Finance, 75. 280-291.
[102] Min, M., Min, M., Desmoulins-Lebeault, F., Desmoulins-Lebeault, F., Esposito, M., & Esposito, M. (2017). Should pharmaceutical companies engage in corporate social responsibility?Journal of Management Development, 36(1). 58-70.
[103] Ministry of Environment. (2017). Environmental Destructor Company. Pollution Control and Environmental Degradation of Ministry of Environment and Forestry (KLHK). Republic of Indonesia. Jakarta.
[104] Mishra, D. R. (2017). Post-innovation CSR performance and firm value.Journal of Business Ethics, 140(2). 285-306.
[105] Muda, I and Abykusno Dharsuky (2015). Impact of Region Financial Information System (SIKD) Quality, Role Ambiguity And Training on Precision of Financial Statement of Local Government Presentation In North Sumatra.International Journal of Applied Business and Economic Research, 13(6): 4283-4304.
[106] Muda, I, Dharsuky. A., Siregar, H.S., and Sadalia, I. (2017). combined loading and Cross-dimensional loadings timeliness of presentation of financial statements of local government. IOP Conference Series : Materials Science and Engineering. 180. 1-5.
doi: 10.1088/1757-899X/180/1/012099.
[107] Muda, I, Marlon Sihombing, Erni Jumilawati and Abikusno Dharsuky (2016). Critical Success Factors Downstream Palm Oil Based Small And Medium Enterprises (SME) In Indonesia.
International Journal of Economic Research. 13(8). 3531-3538. [108] Muda, I, Rahmanta, S. Adi and Marhayanie. (2017). The Role of
Working Capital, Productivity, Applied Technology and Selling Market Prices on Fisherman’s Revenues.International Journal of Economic Research. 14(16). 291-302.
[109] Muda, I.,Dharsuky, A.,Sadalia, I., and Siregar, H.S. (2016). Impact of capital investments and cash dividend policy on Regional Development Bank (BPD) PT. Bank Sumut to the district own source revenue and economic growth. International Journal of Applied Business and Economic Research. 14(11). 7863-7880. [110] Muda, I; M. Weldi; Siregar, H.S, & Indra, N. (2017). The Analysis
of Effects of Good Corporate Governance on Earnings Management in Indonesia with Panel Data Approach. Iranian Economic Review. 21(4). 657-669.
[111] Muda, Iskandar (2017). The Effect of Allocation of Dividend of the Regional Government-Owned Enterprises and the Empowerment Efforts on the Revenue of Regional Government: The Case of Indonesia.European Research Studies Journal. XX(3A). 223-246. [112] Mun, E., & Jung, J. (2017). Change above the Glass Ceiling: Corporate Social Responsibility and Gender Diversity in Japanese Firms.Administrative Science Quarterly, 0001839217712920. [113] Nasir, Azwir. Yesi Mutia Basri, Kamaliah & Muda, I. (2017).
Effectiveness of Potential Tax Region as the Real Local Revenue Sources in Riau Coastal Area.International Journal of Economic Research. 14(12). 313-324.
[114] Nasir, Azwir. Yesi Mutia Basri, Kamaliah & Muda, I. (2017). Effectiveness of Potential Tax Region as the Real Local Revenue Sources in Riau Coastal Area.International Journal of Economic Research. 14(12). 313-324.
[115] Nègre, E., Verdier, M. A., Cho, C. H., & Patten, D. M. (2017). Disclosure strategies and investor reactions to downsizing announcements: A legitimacy perspective.Journal of Accounting and Public Policy.
[116] Nekhili, M., Nagati, H., Chtioui, T., & Rebolledo, C. (2017). Corporate social responsibility disclosure and market value: Family versus nonfamily firms.Journal of Business Research, 77, 41-52.
[117] Nurlina and Muda, I. (2017). The Analysis of The Effects of Capital Expenditure and Human Development Index on Economic Growth and Poverty in East Aceh Regency. International Journal of Economic Research. 14(16). 395-409.
[118] Nurzaimah, Rasdianto and Muda, I. (2016). The skills and understanding of rural enterprise management of the preparation of financial statements using Financial Accounting Standards (IFRs) financial statement on the Entities without Public Accountability (ETAP) framework on the implementation of village administration law.International Journal of Applied Business and Economic Research. 14(11): 7417-7429.
[119] Okazaki, S., & Menendez, H. D. (2017). Virtual Corporate Social Responsibility Dialog: Seeking a Gap Between Proposed Concepts and Actual Practices. In Handbook of Integrated CSR Communication. 225-234. Springer International Publishing. [120] Orlitzky, M., Louche, C., Gond, J. P., & Chapple, W. (2017).
Unpacking the drivers of corporate social performance: A multilevel, multistakeholder, and multimethod analysis.Journal of Business Ethics, 144(1). 21-40.
[121] Panicker, V. S. (2017). Ownership and corporate social responsibility in Indian firms.Social Responsibility Journal, 13(4). 714-727.
[122] Papasolomou, I. (2017). The Practice of Internal Corporate Social Responsibility in SMEs in Cyprus. InCorporate Social Responsibility in Times of Crisis(pp. 93-109). Springer International Publishing. [123] Park, S., Song, S., & Lee, S. (2017). Corporate social
respon-sibility and systematic risk of restaurant firms: The moderating role of geographical diversification. Tourism Management, 59, 610-620.
[124] Pedram, A., Pedram, P., Yusoff, N. B., & Sorooshian, S. (2017). Development of closed-loop supply chain network in terms of corporate social responsibility.PloS one, 12(4), e0174951. [125] Penn, V. C., & Thomas, P. H. (2017). Bank employees'
enga-gement in corporate social responsibility initiatives at a South African retail bank.Acta Commercii, 17(1). 1-10.