Pharmacokinetic Evaluation of Avicularin
Using a Model-Based Development Approach
Article
in
Planta Medica · March 2015
DOI: 10.1055/s-0035-1545728 · Source: PubMed
CITATION
1
READS
82
10 authors
, including:
Ravi Shankar Prasad Singh
University of Florida
21PUBLICATIONS
156CITATIONS
SEE PROFILE
Elza Kimura
Universidade Estadual de Maringá
28PUBLICATIONS361CITATIONS
SEE PROFILE
Hartmut Derendorf
University of Florida
582PUBLICATIONS
11,835CITATIONS
SEE PROFILE
Andréa Diniz
Universidade Estadual de Maringá
19PUBLICATIONS122CITATIONS
SEE PROFILE
All content following this page was uploaded by
Gabriela Amaral Buqui
on 07 August 2015.
Introduction
!
With an increasing awareness of a“healthy life-style”in todayʼs society, the consumption of nu-traceutical and phytopharmaceutical supple-ments has also increased in the general popula-tion. This is further enhanced by media advertise-ment positioning these products as nonsynthetic natural supplements. Many of the phytopharma-ceuticals are phenolic compounds and among them are flavonoids that are found in many vege-tal species. With 3000 chemical structures al-ready known for this class of phytopharmaceuti-cals, its development still lags behind pharmaceu-tical drug development in terms of utilizing tools to enhance the understanding of the pharmacoki-netic and safety properties of these compounds in both animals and humans [1–3]. A reason could be the lack of information on their metabolic pathways, for example, the enzyme kinetic infor-mation of flavonoids. Most of the metabolic stud-ies in the literature are drug-drug interactions of these compounds with other pharmaceuticals and very limited information is available on the enzyme kinetic profile of the flavonoids [1].
Phar-maceutical drug discovery currently has manyin vitroandin silicotools at its disposal to investi-gate a new molecule. Adapting those available tools in phytopharmaceutical development for predictive purposes will be extremely valuable. One such tool is utilizing population pharmacoki-netic and allometric scaling to other species, in-cluding humans. This modeling approach can sig-nificantly improve pharmacognosy, particularly in predicting the concentration of these plant medicines in humans where they are used exten-sively in the context of traditional medicine. Flavonoids, among the classes of phytopharma-ceuticals, are one of the most consumed products in the world, in terms of daily intake. Avicularin (quercetin-3-O-α-arabinofuranoside; l"Fig. 1) is
a flavone glycoside of quercetin, which was re-ported to be present in a variety of plant species, including apple [4, 5], cranberry, and medicinal plant species belonging to theBidensand Hyperi-cumgenera [6]. Given that some of its biological activities included suppression of lipid accumula-tion [7], inhibiaccumula-tion of alpha-glicosidase [5] and urease [8], as well as anti-inflammatory proper-ties [9], investigators have proposed the potential
Abstract
!
The aim of this study was to use the pharmacoki-netic information of avicularin in rats to project a dose for humans using allometric scaling. A highly sensitive and specific bioanalytical assay to deter-mine avicularin concentrations in the plasma was developed and validated for UPLC‑MS/MS. The plasma protein binding of avicularin in rat plasma determined by the ultrafiltration method was 64 %. The pharmacokinetics of avicularin in nine rats was studied following an intravenous bolus administration of 1 mg/kg and was found to be best described by a two-compartment model us-ing a nonlinear mixed effects modelus-ing approach.
The pharmacokinetic parameters were allomet-rically scaled by body weight and centered to the median rat weight of 0.23 kg, with the power co-efficient fixed at 0.75 for clearance and 1 for vol-ume parameters. Avicularin was rapidly elimi-nated from the systemic circulation within 1 h post-dose, and the avicularin pharmacokinetic was linear up to 5 mg/kg based on exposure com-parison to literature data for a 5-mg/kg single dose in rats. Using allometric scaling and Monte Carlo simulation approaches, the rat doses of 1 and 5 mg/kg correspond to the human equivalent doses of 30 and 150 mg, respectively, to achieve comparable plasma avicularin concentrations in humans.
Pharmacokinetic Evaluation of Avicularin Using a
Model-Based Development Approach
Authors Gabriela Amaral Buqui1, Dayana Rubio Gouvea1, Sherwin K. B. Sy2, Alexander Voelkner2, Ravi S. P. Singh2,
Denise Brentan da Silva1, Elza Kimura3, Hartmut Derendorf2, Norberto Peporine Lopes1, Andrea Diniz3
Affiliations 1NPPNS (Núcleo de Pesquisa em Produtos Naturais e Sintéticos), Departamento de Física e Química, Faculdade de Ciências
Farmacêuticas de Ribeirão Preto, Universidade de São Paulo, Ribeirão Preto, SP, Brazil
2Department of Pharmaceutics, College of Pharmacy, University of Florida, Gainesville, FL, USA 3Departamento de Farmacia, Universidade Estadual de Maringá, Maringá, Paraná, Brazil
Key words
l" avicularin
l" pharmacokinetic
l" translational research
l" model‑based development
l" pharmacognosy
Planta Med 2015; 81: 373–381
© Georg Thieme Verlag KG Stuttgart · New York · ISSN 0032‑0943
application of this compound for disease prevention. In phyto-pharmaceutical therapy, patients are administered medicinal products containing either a single herbal extract or a combina-tion of different extracts. The quantificacombina-tion of dose and dose op-timization are considerably more difficult in this setting. One methodology to quantify dose or exposure is to develop the rela-tionship between pharmacodynamic effects and the pharmaco-kinetic of one or more compounds, which are called marker com-pounds. Therefore, marker compounds need to represent the whole extract or the aggregate activities of the extract. In this
case, avicularin is a maker compound that is representative of the aggregate activities of the extract.
In this study, we developed a bioanalytical method for avicularin, which was prospectively used to quantify avicularin concentra-tion-time profiles in rats. The pharmacokinetics of avicularin in the rat was then characterized using a population pharmacoki-netic approach. Its pharmacokipharmacoki-netic information was further uti-lized to extrapolate avicularin concentrations in humans using allometry. This study represents an important shift in the devel-opment paradigm of phytopharmaceutical products to a more structured and cost-effective model-based development ap-proach.
Results
!
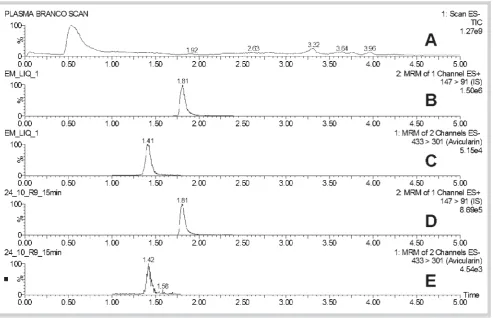
The selectivity of the bioanalytical assay was evaluated by com-paring the chromatograms of blank plasma, blank plasma spiked with avicularin, and a rat plasma sample after intravenous ad-ministration of avicularin 1 mg/kg (l"Fig. 2). The results showed
that there was no endogenous interference of the matrix at the retention times of avicularin and coumarin (IS).
The calibration curves of the peak area to the concentration were constructed using a 1/x weighted linear regression model. The calibration curves were prepared daily and showed good lin-earity in the corresponding range for avicularin (R2> 0.996). The
current assay resulted in an LLOQ of 25 ng/mL for avicularin in the plasma, which was considered adequate for the study of pharmacokinetics following a single intravenous administration
Fig. 2 Representative chromatograms of avicularin (1.41 min) and couma-rin (1.81 min).ABlank rat plasma,B plasma spiked with IS in LLOQ,C
plas-ma spiked with avicularin,D, Eplasma obtained after 15 min of the intrave-nous administration of avicularin (1 mg/kg) to rats.
Fig. 1 Chemical struc-ture of avicularin and coumarin (internal standard).
of avicularin (1 mg/kg). The extraction recovery and matrix effect data of avicularin are shown inl"Table 1. The results from the
study of the matrix effect showed that an ionization en-hancement (> 100 %) was present, but no significant differences between the matrix effect in the various concentrations were found. Thus, the matrix effect for avicularin was not considered significant. The data from the recovery study indicated that the sample preparation method was satisfactory and resulted in no appreciable matrix effect.
The validation results showed that the accuracy and precision of this method were 95.5 to 105 % and 0.3 to 8.1 %, respectively, as shown inl"Table 2. The evaluation of the assay for accuracy and
precision in rat plasma indicated that this analytical method was accurate and reproducible. Therefore, the analytical method us-ing UPLC‑MS/MS was highly sensitive, specific, and suitable for the pharmacokinetic study of avicularin in rats.
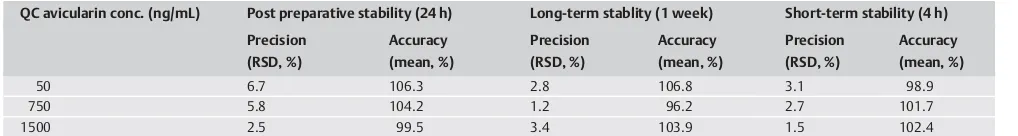
The stability evaluation (l"Table 3) showed that the differences
were between 96.2 and 106.8 % of the original concentrations, which were well within the 20 % relative standard deviation. Short-term and long-term stabilities demonstrated no significant degradation over all concentrations tested, as well as for post-preparative stability. These data indicated that avicularin was sta-ble in the plasma for at least a week.
Plasma protein binding results are shown inl"Table 4. For the
two higher concentrations (750 and 1500 ng/mL), the protein binding was the same, around 69 %, but for the lower concentra-tion (50 ng/mL), this proporconcentra-tion was significantly different (53 %), suggesting a nonlinear protein binding effect. Given that plasma protein binding has an impact on the drug pharmacokinetics and drug-drug interactions, the plasma protein binding of avicularin in the rat was evaluated to be 64 % using the ultrafiltration meth-od; consequently, the free drug component of avicularin is ap-proximately 36%.
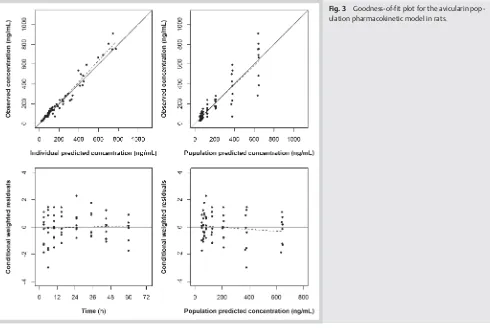
Total plasma concentrations collected from rats after 1 mg/kg ad-ministration of avicularin were analyzed using the validated
bio-analytical assay described above. The pharmacokinetics of avicu-larin is best described by a two-compartment body model. There is good agreement between the model-predicted concentrations and the observed concentration (l"Fig. 3). Conditional weighted
residuals were within the−2 to 2 unit ordinate. The parameters
of the population pharmacokinetic model are shown inl"Table 5.
Given that avicularin was dosed on the basis of body weight, the estimated parameters were centered on the body weight of 230 g, which was the median body weight of the nine rats. Avicularin is rapidly cleared from the systemic circulation with a clearance of 17.1 mL/min; the volumes of distribution for the central and pe-ripheral compartments were 200 and 760 mL, which translate to a volume at steady state of 960 mL (VSS= VC+ VP). The large
vol-ume of distribution indicates the likely distribution into the tis-sues. The corresponding half-lives were 3.3 and 59 min for the
α- andβ-phases of the biexponential decline, respectively. The
ωP, which represents the approximate coefficients of variation
for the interindividual variability for CL, Q, and VCwere 20, 49
and 32 %, respectively.
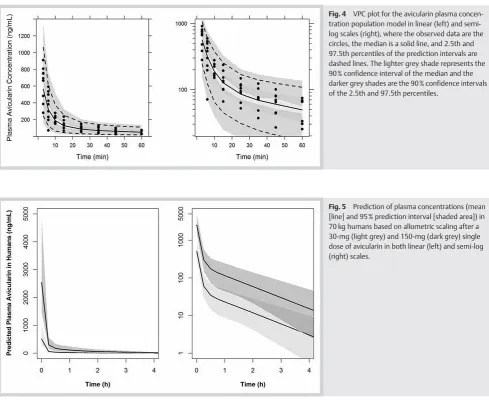
The accuracy of the final model was evaluated by a posterior vi-sual predictive check from the simulation of 500 profiles from the rat population with the same body weight distribution (l"Fig. 4).
Bootstrap-estimated 95 % confidence intervals of the parameters contained the population mean values (l"Table 5).
Table 2 Precision and accuracy for determination of avicularin in rat plasma. Reported values are means from a total of n = 5 per concentration.
QC avicularin Conc. (ng/mL) Intraday Interday
Precision (RSD, %) Accuracy (mean, %) Precision (RSD, %) Accuracy (mean, %)
25 4.9 100.2 8.1 105.0
50 7.9 96.4 5.5 98.6
750 0.8 101.7 1.3 100.9
1500 3.9 93.4 0.3 95.5
Table 3 Stability of avicularin in plasma samples. Reported values are means from a total of n = 5 per concentration.
QC avicularin conc. (ng/mL) Post preparative stability (24 h) Long-term stablity (1 week) Short-term stability (4 h)
Precision
1500 2.5 99.5 3.4 103.9 1.5 102.4
Table 4 Plasma protein binding of avicularin in the concentrations of 50, 750, and 1500 ng/mL (n = 3 per concentration).
Concentration (ng/mL) Protein binding (%) (mean ± SD)
50* 53.2 ± 3.0
750 68.5 ± 0.6
1500 69.8 ± 1.0
* p < 0.019
Table 1 Matrix effect (ME) and extraction recovery (RE) of avicu-larin in plasma samples. Reported values are means from a total of n = 5 per concentration.
QC Avicularin conc. (ng/mL) ME (%) RE (%)
25 108.8 105.2
50 125.4 107.5
750 123.6 114.2
1500 117.2 110.2
For the purpose of scaling to larger animals including humans, the allometric power coefficients were set to 0.75 and 1 for clear-ance and volume parameters, respectively. The mean pharmaco-kinetic parameters of avicularin in humans, assuming an average body weight of 70 kg, were 309 L/h, 423 L/h, 64 L, and 245 L for CL, Q, VCand VP, respectively. From equation 3, the estimated doses
in humans were 30 mg and 150 mg, which resulted in a compara-ble maximum concentration to that in the rats after 1 mg/kg and 5 mg/kg (l"Table 6). The maximum concentration after 5 mg/kg
avicularin in the rat was obtained from Zhang et al. [10], which was 2324 ± 423.7 ng/mL. The extrapolation to humans (l"Fig. 5),
using allometry, indicates that avicularin is rapidly cleared. A drop to 10 % of the initial concentration was predicted within the first half hour of administration (l"Table 6).
Discussion
!
After a single intravenous bolus administration of 1 mg/kg avicu-larin in rats, the plasma avicuavicu-larin concentration decreased rap-idly from approximately 700 ng/mL to less than 200 ng/mL in 10 min and reached approximately 100 ng/mL after an hour. This biphasic concentration-time profile, which was observed in all rats, was best characterized by a two-compartment pharmacoki-netic model. The pharmacokipharmacoki-netic analysis showed that avicular-in was rapidly cleared from the systemic circulation avicular-in rats. The rapid clearance of 17.1 mL/min is much faster than the rat glo-merular filtration, which is 1.8 mL/min [11], indicating the possi-bility of conversion to an active metabolite or several other me-tabolites. A study showed that human intestinal bacteria could
Fig. 3 Goodness-of-fit plot for the avicularin pop-ulation pharmacokinetic model in rats.
Table 5 Population pharmacoki-netic estimated parameters of avi-cularin after intravenous adminis-tration (1 mg/kg) in rats (n = 9).
Parameter Mean RSE (%) Median (95 % CI)*
Structural model parameters
Volume of central compartment (VC; mL) 200 25 205 (121, 321) Volume of peripheral compartment (VP; mL) 760 17 734 (478, 1124) Systemic clearance (CL; mL/min) 17.1 (1.03 L/h) 9.9 17.2 (14.5, 20.9) Intercompartmental clearance (Q; mL/min) 23.3 (1.40 L/h) 16 22.1 (16.1, 30.0) Interindividual variability
% CV of VC(ωVc) 58 49 50 (8.6, 88)
% CV of CL (ωCL) 33 20 30 (8.2, 47)
% CV of Q (ωQ) 39 32 36 (15, 57)
Residual variability
Proportional residual error 0.20 6 0.19 (0.13, 0.25)
RSE, relative standard error; % CV, coefficient of variation values were obtained by taking the square root of the diagonal values of the NONMEM omega (variance-covariance) matrix and multiplying by 100 %; * Median (95% CI) determined from 500 bootstrap resampling procedures
metabolize avicularin, and six metabolites were previously iden-tified, including aglycone quercetin, quercetin-3-O-rhamnoside, quercetin-3-O-glucoside, and quercetin-7-O-glucoside [12]. It is still unclear whether these metabolites of avicularin are present in rats or humans. More studies are required to elucidate the metabolic pathway of avicularin in animals and humans. The peak concentration after intravenous bolus administration of a 1 mg/kg dose of avicularin in our study was proportional to that observed in the study of Zhang et al. using a 5 mg/kg avicularin dose [10]. Theβ-phase half-life of approximately 1 h from this study was consistent with the terminal half-life of 0.75 ± 0.09 h reported previously [10]. The rapid clearance of avicularin could also indicate a rapid tissue distribution. The volume of distribu-tion of avicularin in the rat was very large at 960 mL, which
trans-lated to approximately 4.2 L/kg, given that the plasma volume of the rat was only 0.03 L/kg [13]. The 150-fold difference suggested an extensive distribution out of the plasma or the systemic circu-lation. Such a fold difference in the volume of distribution is not uncommon. One example is largazole-thiol, which is a potent histone deacetylase inhibitor derived from marine cyanobacte-rium and was shown to have a volume of distribution of 26.7 L/ kg in the rats [14].
We had attempted using a“buttom-up”approach with a physio-logically based pharmacokinetic model to predict human expo-sure [15]. However, due to the lack of information on the human metabolism of avicularin and the relative concentrations in the various organs, we elected to use allometric scaling instead. The allometric scaling approach compensates for the fact that larger
Fig. 5 Prediction of plasma concentrations (mean [line] and 95% prediction interval [shaded area]) in 70 kg humans based on allometric scaling after a 30-mg (light grey) and 150-mg (dark grey) single dose of avicularin in both linear (left) and semi-log (right) scales.
Fig. 4 VPC plot for the avicularin plasma concen-tration population model in linear (left) and semi-log scales (right), where the observed data are the circles, the median is a solid line, and 2.5th and 97.5th percentiles of the prediction intervals are dashed lines. The lighter grey shade represents the 90 % confidence interval of the median and the darker grey shades are the 90 % confidence intervals of the 2.5th and 97.5th percentiles.
Table 6 Summary statistics of si-mulated human avicularin concen-trations after intravenous adminis-tration of 30 mg and 150 mg avi-cularin from 500 simulated profiles assuming a human body weight of 70 ± 5 kg.
Dose (mg) Post-dose time (h) Median (ng/mL) Min, max (ng/mL)
30 0 509 287, 1010
0.5 34.5 14.1, 67.4
1 22.9 8.7, 49.8
4 3.0 0.5, 10.0
150 0 2540 1440, 5050
0.5 173 70.4, 337
1 115 43.5, 249
4 15.2 2.7, 50.0
animals normally have a slower metabolic rate and would re-quire a lesser dose based on body weight compared to smaller animals [16–19]. We utilized the mathematical power law ex-pression
Y¼a ðmedianweightÞb
whereYis the parameter of interest,weightrefers to body weight normalized by the median,ais the median weight-centered pa-rameter value, andbis the allometric exponent) [20, 21]. Using the allometric exponent of 0.75 for clearance relationship to body weight is similar to scaling by body surface area since body sur-face area increases by a power of 0.75 in relation to weight in-crease. Similarly, the extrapolated dose in humans was increased by the proportion of human weight to the rat weight to the same power exponent to account for scaling by body surface area. The simulation in humans indicated that avicularin was rapidly cleared from the systemic circulation within the first half hour of administration. We also showed that a 30- to 150-mg dose in humans, assuming an ideal body weight of 70 kg, would result in a similar exposure to that of a 1- to 5-mg/kg dose in rats. The si-mulated initial median concentration of 2540 ng/mL in humans after a 150-mg dose was close to that reported for the maximal concentrations of 2324 ± 423.7 ng/mL in rats administered a sin-gle dose of 5 mg/kg avicularin [10].
There are limitations to the allometric scaling approach as this approach was previously shown to perform poorly for interspe-cies scaling, even after several types of correction [19, 22, 23]. One of the primary reasons is because of the significant differ-ences in metabolic pathways and enzymatic activities between species. Sharma and McNeil described properties of drugs that may not be amenable to allometric scaling, including drugs that are highly protein bound, drugs that undergo extensive metabo-lism and active transport, drugs that undergo significant biliary excretion or renal secretion, drugs whose target are subject to significant interspecies differences, and biological drugs that ex-hibit target-binding effects [16]. Wojcikowski and Gobe dis-cussed the limitations of extrapolation to humans from animal studies, not only from the pharmacokinetic perspective but from pharmacodynamics and safety as well [17].
Avicularin could potentially exhibit extensive metabolism, given that its clearance in the rat is much higher than the glomerular filtration rate in the rat. Allometric scaling is the preferred choice for scaling to human equivalent doses in the absence of informa-tion on the metabolic pathway of avicularin. Avicularin metabolic information could potentially allow one to develop a physiologi-cally based pharmacokinetic model and use the model for inter-species scaling. Another limitation of the study is that the simu-lations assuming intravenous administration may not realisti-cally reflect the preferred route of administration in humans as extracts containing avicularin are commonly taken via the oral route. The difference in the route of administrations adds another layer of complexity, as it is not known whether avicularin is a substrate of intestinal transporters.
Extracts containing avicularin are already widely ingested in Bra-zilian traditional medicine as an herbal remedy for various ail-ments including inflammation. A recent study showed that avi-cularin suppressed adipogenesis using 3T3-L1 cells and demon-strated that this suppression occurred through the inhibition of the CCAAT/enhancer-binding proteins (C/EBP alpha-activated) GLUT4-mediated insulin-responsive glucose transporter, which mediates glucose uptake [7]. The inhibitory concentration is
re-ported at 50 µM, which is approximately 22 ng/mL. In another study, the anti-inflammatory properties of avicularin were shown to be mediated by suppression of the secretion of proin-flammatory cytokine IL-1βand also attenuated the activation of the ERK signaling pathway and the degradation of Iκβ[9].
A study by Dost et al., who investigated the effect of aHypericum
(St. Johnʼs wort) extract on the inflammatory and immune re-sponse in rats with induced inflammatory bowel disease [24], have shown that the low human equivalent dose that some ben-efits corresponds to the low dose in rats. Their study indicated that the beneficial effects observed in animals might be relevant to humans at relatively low doses. Their study showed the value of extrapolation to a human equivalent dose in the absence of any information on humans in order to design the low dose in hu-mans that was reasonably safe.
In this study, we utilized model-based development to extrapo-late a dose in humans for avicularin with the pharmacokinetic in-formation in rats. This approach is suitable for the extrapolation of a human equivalent dose. We also noted that this approach us-ing allometric scalus-ing has its shortcomus-ings, includus-ing some docu-mented poor predictability across species due to significant dif-ferences in metabolic pathways and enzyme activities between species [22]. This approach, nonetheless, brings us closer to understanding the dose requirement in humans to achieve phar-macological effects.
Materials and Methods
!
Chemical reagents
Avicularin was isolated from the aerial parts ofBidens sulphurea
(Cav.) Sch. Bip. (Asteraceae) and purified in our laboratory with a purity of 93.3 % [25, 26]. The structure was confirmed by compar-ing high-resolution mass spectrometry, and1H and13C nuclear
magnetic resonance data with previously reported data [5, 27]. Coumarin, as an internal standard (IS), was purchased from Sig-ma-Aldrich with a purity of 98 %.
Analytical studies
Chromatographic analysis was performed on an Acquity UPLC system (Waters Corp.), and the separation was performed at 40 ° C using a Waters Acquity C 18 BEH column (2.1 mm × 50 mm, 1.7 µm) with a linear gradient elution, using water (containing 0.1 % acetic acid) and acetonitrile (containing 0.1% acetic acid) as the mobile phase.
The elution program was as follows: 10 % (initial), 10–40 % (1 min), 40–100 % (2.5 min), 100 % (3 min), and 100–10% (5 min) acetonitrile with 0.1 % acetic acid. The flow rate was 0.3 mL/min, the injection volume was 5 µL, and the autosampler temperature was set to 20 °C.
Mass spectrometry detection was performed using a TQ detector (Waters Corp.) equipped with an electrospray ionization (ESI) source. Nitrogen was used as the desolvation gas (600 L/h) and as a cone gas (50 L/h). For collision-induced dissociation, argon was used as the collision gas at a flow rate of 0.15 L/h. The capil-lary voltage was set to 2.5 kV, the source temperature to 150 °C, and the desolvation temperature to 350 °C. The cone voltage and collision energy were optimized for each compound: 32 kV and 18 eV for avicularin, and 20 kV and 25 eV for IS, respectively. Quantification was performed using multiple reaction monitor-ing and with the transitions ofm/z433→301 for avicularin and m/z147→91 for IS. The negative ESI mode for avicularin and
itive mode for IS were applied. All analyses were performed using MassLynx V 4.1 Software (Waters Corp.)
The IS of choice was coumarin (l"Fig. 1) due to the absence of
en-dogenous interference and its improbable presence in the plant material used for the extraction of avicularin. Furthermore, the main reason for this choice was that its chromatographic behav-ior and extraction efficiency were similar to those of avicularin. A UPLC‑MS/MS analytical method for avicularin was developed in-dependently of the current method and utilized carbamazepine as their internal standard [10]. Their chromatographic conditions were different from the ones used in the current study.
Individual stock solutions of avicularin (400 µg/mL) and IS (2 mg/ mL) were accurately prepared in volumetric flasks, dissolved with acetonitrile : water (80 : 20 v/v). The stock solutions were se-rially diluted in order to get the standard working solutions with the desired concentrations. All stock solutions were stored at 4 ° C. Working solutions were prepared immediately before use. For the stability analysis, quality control (QC) samples of four concentrations at 25, 50, 750, and 1500 ng/mL were prepared in plasma. QC samples were stored at−80 °C until analysis.
For the sample preparation, 100 µL of the IS solution at 0.5 µg/mL in acetonitrile were added to 100 µL of the rat plasma sample. To this mixture, 100 µL of hexane were added. After vortexing for 2 min, the samples were centrifuged at 2140 ×g and 4 °C for 15 min. After this process, 5 µL of the supernatant liquid was in-jected onto the column.
Selectivity was assessed by analyzing blank plasma samples from six sources, blank plasma samples spiked with avicularin and IS, and rat plasma samples after intravenous administration of avi-cularin; interfering substances in the biological matrix were monitored as well.
An aliquot (50 µL) of appropriate avicularin standard working so-lution was spiked into the blank plasma samples to give concen-trations of 25, 50, 100, 250, 500, 750, 1000, 1500, and 2000 ng/ mL. An aliquot of 50 µL of IS solution (0.5 µg/mL) was added to all spiked samples, and then the sample solutions were prepared and analyzed as described above. The results were fitted to linear regression analysis using 1/x as the weighting factor. The concen-tration of avicularin in the plasma was directly calculated from the corresponding calibration curve.
The lower limit of quantification (LLOQ) was defined as the low-est avicularin concentration that could be determined with an ac-curacy of 80–120 % and precision of 20%, and the analyte re-sponse 5 times greater than the rere-sponse of the blank.
Recovery and the matrix effect were measured for LLOQ, and low-, medium-, and high-concentration QC samples (25, 50, 750, and 1500 ng/mL). The blank biological matrix was prepared with-out the addition of any standard. The extraction recovery was de-termined by comparing the analyte/internal standard peak area ratios obtained from extracted plasma samples with those origi-nally dissolved with the biological matrix extract.
The matrix effect was determined by comparing the analyte/in-ternal standard peak area ratios dissolved with the blank matrix extracted against those dissolved only with acetonitrile : water (80 : 20 v/v). The ion suppression of the analytes was evaluated [28, 29]. Each test was measured in triplicate.
The matrix effect and recovery of the extraction procedure were measured by comparing the absolute peak areas obtained in the solution standard (A), the corresponding peak areas for standards spiked after extraction into plasma extracts (B), and the peak areas for standards spiked before extraction (C), so the matrix ef-fect and recovery values can be calculated such that
matrix effect (%) = B/A · 100 and recovery (%) = C/B · 100
Intraday precision was tested by analysis of the QC plasma sam-ples at four concentrations (n = 5 for each concentration) in the same day. Interday precision (n = 5 per concentration) was deter-mined by repeated analysis of the QC samples over three consec-utive days. The concentrations were calculated from the corre-sponding calibration curve. The relative standard deviation and percentage difference between the amount spiked and deter-mined were taken as the measures of precision and accuracy. The stability studies were performed by evaluating the QC sam-ples in three different conditions at concentrations of 50, 750, and 1500 ng/mL of avicularin. Short-term stability was carried out with samples at room temperature for 4 h. Post-preparative stability was evaluated on the samples waiting for injection in the autosampler at 20 °C for 24 h. Long-term stability was studied by assaying samples following a period of one week of storage at
−80 °C. The results were expressed by the precision and accuracy
obtained and compared with the initial content of avicularin in the freshly treated samples.
Plasma protein binding
Protein binding of avicularin was evaluated in rat plasma at the concentrations of 50, 750, and 1500 ng/mL using an ultrafiltra-tion method as previously described [30]. The avicularin plasma was incubated at 37 °C for 30 min, then the plasma containing the drug was loaded onto the Centrifree Ultrafiltration Device (Milli-pore Corp.), and the filtrate device was centrifuged at 2000 ×gfor 25 min at 25 °C. The total drug before centrifugation and the free drug present in the filtrate were assayed by direct injection into the UPLC‑MS/MS, and the results were compared.
Pharmacokinetic studies in rats
Male Wistar rats, weighing 230 ± 20 g, were provided by the Cen-tral Animal Facility of the University of São Paulo, Ribeirão Preto, Brazil. This study was approved by the Animal Use Ethics Com-mittee (protocol number 058/2012). Nine male Wistar rats were used in this study and had free access to water and food. The avi-cularin (1 mg/kg) solution was prepared in saline containing 1 % DMSO and was administered to the rats by intravenous bolus ad-ministration via the left tail vein. 200 µL serial blood samples were drawn in heparinized polythene microtubes from the right tail vein at the following post-dose time points: 3, 6, 10, 15, 25, 35, 45, and 60 min. Samples were immediately centrifuged at 2000 ×gfor 5 min at room temperature, and the plasma was re-moved and stored at−80 °C until analysis by UPLC‑MS/MS.
Population pharmacokinetic model
The final structural model was a two-compartment body model assuming IV bolus administration, parameterized on clearance (CL), intercompartmental clearance (Q), volumes of distribution of the central (VC), and peripheral compartments (VP).
Exponen-tial interindividual variability terms were included in the phar-macokinetic parameters CL, Q, and VC.
Pi= P × exp (ηi) (1)
where P represents the population mean andηidescribes the
in-terindividual variability, which was assumed to be independently and normally distributed with zero mean and varianceωP2. In
or-der not to confound mixed interindividual variability to parame-ters VPand VC, no interindividual variability was included in the
VPterm. The subscript i represents the individual. The residual
variability was characterized by a proportional model.
The allometric size adjustment by weight was centered on 0.23 kg, which was the median weight of the rats. The relation-ship between body weight and parameters are described by the following equation:
Pi¼Pð weight medianÞ
x (2)
where weight is the weight of the individual rat, and median is the median weight of the study population;xis the power coeffi-cient which was fixed to 0.75 for the clearance (both CL and Q) and 1 for the volume of distribution (both VCand VP) parameters.
The same equation was used for the prediction of CL, Q,Vc, and Vp
in humans where the human body weight of 70 ± 5 kg (mean ± SD) is used for the weight parameter.
The predictability of the final model was evaluated using the vi-sual predictive check wherein plasma concentration-time pro-files were simulated in 500 replicates using the final population pharmacokinetic model. The median and 95% prediction interval of the time course of avicularin plasma concentrations were com-puted and overlaid with the observed data to evaluate the predic-tive performance of the final model. The majority of the individ-ual observations should be enclosed within the 2.5th and 97.5th percentiles of the simulated data if the final model adequately describes the original data. The 90 % confidence interval of the prediction interval was generated based on a bootstrap proce-dure as previously described [31].
The model stability was evaluated by a bootstrap resampling technique with 500 bootstrap procedures. Parameter uncertainty was assessed by comparing the model parameter estimates with the posterior distribution of the bootstrap estimates; the 2.5th and 97.5th percentiles of the parameter estimates from the pos-terior distribution from the bootstrap estimates were used. The population pharmacokinetic model of avicularin in rats was developed using a nonlinear mixed effects model with a first-or-der conditional maximum likelihood estimationη-interaction in
NONMEM (version VII.2) and an NM-TRAN preprocessor (ICON Development Solutions). The subroutine was ADVAN3 TRANS4. The models were run using G-Fortran 95. Bootstrap resampling and the visual predictive check were performed with Perl-speaks-NONMEM 3.5.5 running ActivePerl 5.12 (ActiveState) and Xpose4 package in R 3.1.0.
Allometric scaling to humans
The doses for the simulations in humans were determined by the following equation:
Where Dosehumans refers to the estimated dose in humans;
Doseratsrefers to the dose in rats; Weighthumansis the average
weight in humans; and Weightratsis the median rat weight of
0.23 kg. The human weight used in the simulation was 70 ± 5 kg. A total of 500 concentration-time profiles were simulated.
Acknowledgements
!
This work was supported by a scholarship from CNPq 136 255/ 2011–6 and grants from FAPESP 2014/50 265–3 and INCT‑if.
Conflict of Interest
!
There is no conflict of interest among the authors.
References
1Brantley SJ, Gufford BT, Dua R, Fediuk DJ, Graf TN, Scarlett YV, Frederick
KS, Fisher MB, Oberlies NH, Paine MF.Physiologically based
pharmaco-kinetic modeling framework for quantitative prediction of an herb-drug interaction. CPT Pharmacometrics Syst Pharmacol 2014; 3: e107
2Gao G, Law FC.Physiologically based pharmacokinetics of matrine in
the rat after oral administration of pure chemical and ACAPHA. Drug Metab Dispos 2009; 37: 884–891
3Schlosser PM, Borghoff SJ, Coldham NG, David JA, Ghosh SK.
Physiologi-cally-based pharmacokinetic modeling of genistein in rats, Part I: Mod-el devMod-elopment. Risk Anal 2006; 26: 483–500
4He X, Liu RH.Phytochemicals of apple peels: isolation, structure
eluci-dation, and their antiproliferative and antioxidant activities. J Agric Food Chem 2008; 56: 9905–9910
5Schmidt JS, Lauridsen MB, Dragsted LO, Nielsen J, Staerk D.Development
of a bioassay-coupled HPLC‑SPE-ttNMR platform for identification of alpha-glucosidase inhibitors in apple peel (Malus x domesticaBorkh.). Food Chem 2012; 135: 1692–1699
6Cirak C, Radusiene J, Camas N, Caliskan O, Odabas MS.Changes in the
contents of main secondary metabolites in two TurkishHypericum spe-cies during plant development. Pharm Biol 2013; 51: 391–399
7Fujimori K, Shibano M.Avicularin, a plant flavonoid, suppresses lipid
accumulation through repression of C/EBPalpha-activated GLUT4-me-diated glucose uptake in 3T3-L1 cells. J Agric Food Chem 2013; 61: 5139–5147
8Shabana S, Kawai A, Kai K, Akiyama K, Hayashi H.Inhibitory activity
against urease of quercetin glycosides isolated fromAllium cepaand
Psidium guajava. Biosci Biotechnol Biochem 2010; 74: 878–880
9Vo VA, Lee JW, Chang JE, Kim JY, Kim NH, Lee HJ, Kim SS, Chun W, Kwon
YS.Avicularin Inhibits Lipopolysaccharide-Induced Inflammatory Re-sponse by Suppressing ERK Phosphorylation in RAW 264.7 Macro-phages. Biomol Ther (Seoul) 2012; 20: 532–537
10Zhang WM, Li RF, Sun M, Hu DM, Qiu JF, Yan YH.UPLC‑MS/MS method
for determination of avicularin in rat plasma and its application to a pharmacokinetic study. J Chromatogr B Analyt Technol Biomed Life Sci 2014; 965: 107–111
11Goldman R.Endogenous creatinine clearance by rats. Proc Soc Exp Biol
Med 1967; 125: 1021–1024
12Zhao M, Xu J, Qian D, Guo J, Jiang S, Shang EX, Duan JA, Yang J, Du LY.
Ultra performance liquid chromatography/quadrupole-time-of-flight mass spectrometry for determination of avicularin metabolites pro-duced by a human intestinal bacterium. J Chromatogr B Analyt Technol Biomed Life Sci 2014; 949–950: 30–36
13Davis B, Morris T.Commentary: physiological parameters in laboratory
animals and humans. Pharm Res 1993; 10: 1093–1095
14Yu M, Salvador LA, Sy SK, Tang Y, Singh RS, Chen QY, Liu Y, Hong J,
Deren-dorf H, Luesch H.Largazole pharmacokinetics in rats by LC‑MS/MS. Mar
Drugs 2014; 12: 1623–1640
15Sy SK, Malmberg R, Matsushima A, Asin-Prieto E, Rosenkranz B, Cotton
MF, Derendorf H, Innes S.Effect of reducing the paediatric stavudine
dose by half: a physiologically-based pharmacokinetic model. Int J Antimicrob Agents, advance online publication 2015 Jan 19; DOI: 10.1016/j.ijantimicag.2014.12.016
16Sharma V, McNeill JH.To scale or not to scale: the principles of dose
ex-trapolation. Br J Pharmacol 2009; 157: 907–921
17Wojcikowski K, Gobe G.Animal studies on medicinal herbs:
predictabil-ity, dose conversion and potential value. Phytother Res 2014; 28: 22–
27
18Sy SK, Asin-Prieto E, Derendorf H, Samara E.Predicting pediatric
age-matched weight and body mass index. AAPS J 2014; 16: 1372–1379
19Mahmood I.Role of fixed coefficients and exponents in the prediction
of human drug clearance: how accurate are the predictions from one or two species? J Pharm Sci 2009; 98: 2472–2493
20Huang Q, Gehring R, Tell LA, Li M, Riviere JE.Interspecies allometric meta-analysis of the comparative pharmacokinetics of 85 drugs across veterinary and laboratory animal species. J Vet Pharmacol Ther, ad-vance online publication 2014 Oct 21; DOI: 10.1111/jvp.12174
21Huang Q, Riviere JE.The application of allometric scaling principles to
predict pharmacokinetic parameters across species. Expert Opin Drug Metab Toxicol 2014; 10: 1241–1253
22Nagilla R, Ward KW.A comprehensive analysis of the role of correction
factors in the allometric predictivity of clearance from rat, dog, and monkey to humans. J Pharm Sci 2004; 93: 2522–2534
23Mahmood I.Application of fixed exponent 0.75 to the prediction of
hu-man drug clearance: an inaccurate and misleading concept. Drug Me-tabol Drug Interact 2009; 24: 57–81
24Dost T, Ozkayran H, Gokalp F, Yenisey C, Birincioglu M.The effect of
Hy-pericum perforatum(St. Johnʼs Wort) on experimental colitis in rat. Dig
Dis Sci 2009; 54: 1214–1221
25Rodrigues ED, da Silva DB, de Oliveira DC, da Silva GV.DOSY NMR
ap-plied to analysis of flavonoid glycosides fromBidens sulphurea. Magn Reson Chem 2009; 47: 1095–1100
26Silva DB.Atividade antialérgica e estudos químicos das espéciesBidens
gardneriBak. eBidens sulphurea(Cav.) Sch. Bip. (Asteraceae)
[disserta-tion]. Ribeirão Preto: Universidade de São Paulo; 2009: 408
27Shu JC, Chou GX, Wang ZT.One new diphenylmethane glycoside from
the leaves ofPsidium guajavaL. Nat Prod Res 2012; 26: 1971–1975
28Matuszewski BK, Constanzer ML, Chavez-Eng CM.Strategies for the
as-sessment of matrix effect in quantitative bioanalytical methods based on HPLC‑MS/MS. Anal Chem 2003; 75: 3019–3030
29Marchi I, Viette V, Badoud F, Fathi M, Saugy M, Rudaz S, Veuthey JL.
Char-acterization and classification of matrix effects in biological samples analyses. J Chromatogr A 2010; 1217: 4071–4078
30Diniz A, Escuder-Gilabert L, Lopes NP, Villanueva-Camanas RM, Sagrado
S, Medina-Hernandez MJ. Characterization of interactions between
polyphenolic compounds and human serum proteins by capillary elec-trophoresis. Anal Bioanal Chem 2008; 391: 625–632
31Post TM, Freijer JI, Ploeger BA, Danhof M.Extensions to the visual predic-tive check to facilitate model performance evaluation. J Pharmacokinet Pharmacodyn 2008; 35: 185–202