Introduction
For almost ten years after the publication of
Fama’s classic exposition in 1970, the Efficient
Markets Hypothesis (EMH) dominated the aca-demic and business scene. According to this
hypothesis the market is efficient if its price are
formed on the basis of all available information.
Stock market is efficient not only if all relevant
information about the company are
incorpora-ted into stock price, but also influence investor
rationality in taking investment decisions. The assumption that investors are rational and therefore value investments rationally – that is, by calculating the net present values
of future cash flows, appropriately discounted
for risk – has not been supported by empirical
evidence. Rather the evidence shows that in -vestors are affected by herd instinct, a tendency to “churn” their portfolios, and a tendency to
under-react or over-react to news or asymmet -rical judgements about the causes of previous
profits and losses. Furthermore, many alleged
anomalies have been detected in the patterns of
historical share prices. The best known are cal -endar anomalies.
A number of researchers have begun exam-ined the calendar anomaly as early as 1980s and until the present time (e.g., French, 1980; Keim, 1983; Gultekin and Gultekin, 1983; Keim and
In Indonesia and Malaysia
Shari’ah
Compliance
Helma Malini*
Tanjungpura UniversityMohamad Jais**
University Malaysia Sarawak
This paper investigates the existence of two anomalies in Indonesia and Malaysia Shari’ah
compli-ance; the month of the year and pre-holiday effect, and their implication for stock market efficiency. Investing in Shari’ah compliant is different from investing in conventional stock. Conventional stock
market follows the capital market set of rules and law, while Shari’ah follows not only the capital
market set of laws but also the Islamic principles. Most of the previous studies investigated issues
related to conventional stock market, this study take one step further by investigating issue related to Shari’ah compliant instrument and make comparison between both Shari’ah compliance stock
market in Indonesia and Malaysia. We document high and significant returns in month and pre-day in Indonesia and Malaysia stock market that represent by the Shari’ah compliance. Our result indicate that the month of the year effect is prevalent in Indonesia and Malaysia Shari’ah compliance.
Keywords: Calendar effects, Indonesia and Malaysia Shari’ah compliance, Month of the year and
pre-holiday effects
* Faculty of Economics, Tanjungpura University, Jl. Prof . Hadari Nawawi, Pontianak, West Kalimantan, E-mail: helma [email protected].
Stambaugh, 1984; Rogalski, 1984; Jaffe and
Westerfield, 1985; Harris, 1986; Abraham and
Ikenberry, 1994; Ho and Cheung, 1994; Ha-kan and Halil, 2003; Kenourgios and Samitas,
2008). Most of their works, however, analyzed
the calendar anomaly of stock return in various
markets around the world using the convention -al stock index rather than Shari’ah compliance
index. Their findings conclude that the month
of the year and pre-holiday effect is present in
most market. However, very few studies exam -ined the calendar anomaly using Shari’ah
com-pliant. Husain (1998), for example, finds that the average return does not change significantly
in Ramadhan compared with other months. The objective of the present study is to examine the month of the year and pre-holiday effect focus-ing on the Shari’ah compliance stocks Indo-nesian Stock Exchange and Bursa Malaysia.
Specifically, we investigate whether the infor -mation processed over a month of the year and
pre-holiday will affect the index return in Indo -nesia and Malaysia Shari’ah compliance, this
will relate to elements of the efficient market
hypothesis (EMH).
Shari’ah capital market industry may still be
considered as a relatively new developing in -dustry, although for muslim countries like
In-donesia and Malaysia the growth of Shari’ah capital market is relatively progressive not only because of the muslim population in this coun-try is huge but also both countries has been trying for years in preparing the fundamental and tools to invest in Shari’ah capital market. Considering the fact, in order to provide a solid foundation and a comprehensive development direction, it requires a medium term develop-ment developdevelop-ment strategy, the strategy can
be impelemented in socialization process to withdraw investor to invest in Shari’ah capital
market where eventually can encourage the ac -celeration of Shari’ah capital market growth in Indonesia and Malaysia.
This fundamental reason is the main
fac-tor for the growth of Shari’ah capital market. This reason also brings tremendous attention to perform product and services in capital market according to Shari’ah compliance. Islamic In-deces or Shari’ah compliance has been a major
turnover for the beginning of the Islamitation in capital market and marked the beginning of Shari’ah capital market. The Shari’ah law is requirement that implemented to companies to
be classified as a stocks that follow or fulfill the
Shari’ah principle. For several countries the
rules for a company to be classified as Shari’ah stocks are different, depends on the require-ments that announced by the Shari’ah board in each country.
In Indonesia about 86.1% of 230 million of population are muslim, which makes Indone -sia the biggest muslim majority country in the
world. Therefore, Indonesia offers bright pros -pects for the development of Islamic capital market. Based on the 2012 Indonesian Islamic Capital Report, the development of Shari’ah stocks on the Indonesia Shar’iah Securities
List shows an increasing number from 173 in 2007 to 253 Shari’ah stocks in 2012. As March 2012, the percentage of Shari’ah stocks have exceeded the percentage of conventional stocks
at 50.7%. While in Malaysia the growth of
Shari’ah compliance is very significant showed
by number of listed companies in 2012 were 766
and the percentage of exceeded the percentage
of conventional stocks at 82.3%. Thus making comparison between Indonesia and Malaysia
Shari’ah compliance are appropriate since not only both countries are geographically closed but also of the strong correlation and integra-tion of Shari’ah stock market in both countries.
Literature Review
Ho (1990) examines twelve stock markets, including Australia, Japan, Korea, New Zea
-land, Singapore, Thai-land, UK and US, and find
consistent evidence of the January effect. Arsad
and Coutts (1997) and Choudhry (2001) find significant January effect in the UK stock mar -ket. Mehdian and Perry (2002) investigate the January effect in three US market indexes from
1964–1998: Dow Jones Composite, NYSE Composite and the SP500, they find positive and significant January returns in all three stock
year effect in eighteen emerging equity mar-kets, they observe that stock returns for January
were significantly higher than the returns for the
remaining eleven months only in Chile, Greece,
Korea, Taiwan and Turkey. Doran et al. (2008) and Rezvanian et al. (2008) find no significant
January effect in the Chinese stock market.
Giovanis (2009) examines fifty five stock mar -kets and the January effect is rejected, as it is
presented only in seven stock markets, while the most frequent significant higher monthly re
-turns are reported in December of twelve stock
markets. Keong et al. (2010) study the same is-sue in eleven Asian countries; Hong Kong, In-dia, Indonesia, Japan, Malaysia, Korea,
Philip-pines, Singapore, Taiwan, China and Thailand using GARCH (1,1) model. They find positive December effect, except for Hongkong, Japan,
Korea, and China. Only some countries do have positive January, April, and May effect and only Indonesia demonstrates negative August effect.
Marrett and Worthington (2011) examine the
month of the year effect in the Australian stock
market. Their results show that returns are sig
-nificantly higher in April, July and December along with evidence of a small cap effect with
systematically higher returns in January,
Au-gust and December. Patel (2012) finds that the
January effect no longer exists for many devel-oped and emerging markets.
Chong et al. (2005) examine pre-holiday ef
-fect across three important markets of the world
i.e. US, UK and Hongkong, during the last three
decades of the 20th century. Data on daily stock index returns was extracted from DataStream. S&P 500 index was used for US, FT 30 was
used as a representative of the UK market and
Hang Seng index was used for the Hongkong market. The time period under study was from 1973-2003. The sample period was divided into two categories for each of the three markets: the trading days before a specific holiday (when the stock market was closed) and the trading days
during the rest of the year. The descriptive
sta-tistics were then calculated for all the three in -dices under study, t-statistic for the differences
in the average of returns was also computed. The results showed a strong evidence for the
existence of the pre-holiday effect in all the
three indices, effect being most significant for UK and Hongkong indices. It was found that the average of returns on the days specifically before a certain holiday was more than the av -erage of the returns on other non pre holidays.
Another test was also conducted to analyze if
this anomaly persists or has declined over the years in these three markets. Time series
regres-sion analysis was used for deriving results and a declining pre-holiday effect was witnessed in the US market specifically in the 1990s. The de
-cline was not that evident in the other two mar -kets i.e. UK and Hong Kong. Al-Loughani
(2005) investigated the presence and causes of holiday effect on stock returns in the Kuwait
stock exchange (KSE). The general daily stock index published by the Global Investment
House was the data used. The time period under study was from 1984-2000. The holidays con
-sidered for the study were those that were de -clared by the government and that involved
clo-sure of the stock market. The data was split into two sub periods which were: the pre invasion period which was from 1984-1990 and the post liberation time period which was from
1993-2000. Returns during the trading days right
be-fore any specific holiday and the rest of the trading days of the year during the two sub pe
-riods were compared. T-statistics, Mann-Whit
-ney test and Kruskal Wallis test were conducted on the data to obtain results for analysis. It was apparent from the tests that there was not any noticeable difference between the two sub peri -ods, thereby indicating that holiday effect does not exist in the KSE. A further analysis using
Kruskal Wallis test was also conducted to deter
-mine if there was any particular pattern of re -turn observed during the time surrounding the
holidays and it was revealed that the returns on post holidays were higher than the returns on
pre-holidays or other trading days of the year.
The reason quoted in the paper was that the in -vestors engage in selling before the holidays and right after the holidays they develop their investment portfolios again.
Meneu and Pardo (2004) analyze the most
public holidays. Lucey (2005) finds a signifi -cant pre-holiday effect on the Irish equities
evo-lution. Hansen et al. (2005) test the calendar ef
-fects significance for capital markets from ten industrialized countries and their results indi
-cated that pre-holiday returns were among the best five for the United States, for Norway and for Italy, while the post-holiday returns were among the best five for Norway.
Marrett and Worthington (2007) investi
-gate twelve indices from the Australian stock market and find pre-holiday effects for three of them. There were, however, researches which
failed to provide any evidence of the holiday
effects. For example, Blandon (2010) analyzed
calendar anomalies for the LATIBEX market, formed by Latin-American companies
quot-ed in the Spanish Stock Exchange, finding no holiday effects. Several attempts were made to
explain the holiday effects since their discov-ery. Some of them are based on the behavioral
finance approaches and on the investor psy -chology. The optimism that animates inves-tors in the days that precede public holidays is
considered responsible for high returns, while the lower performances from post-holidays are viewed as corrections after these shocks, there
are also theories that examine the independ-ence of the calendar anomalies. For example,
Pearce (1996) revealed that almost half of the
public holidays occurred on Monday. Several paper revealed, for many stock markets, there
are significant influence of holiday effects. Sometimes, these changes were provoked by dramatic events such the financial crisis.
Research Method
Data
This section offers a brief description of the research method and the data set. Using daily closing price of Indonesia Shari’ah compliance and Malaysia shari’ah compliance from the
period of 2000 : 1 to 2010 : 12. The compa
-nies that classified as Shari’ah in Indonesia are
214 companies while in Malaysia there are 766
companies.
Since Indonesia and Malaysia Shari’ah
compliance has experienced major structural
changes with the potential for affecting market efficiency, we divide our chosen sample period into three following sub periods of differing market stages :
1. 1st January 2000 – 29th December 2004; pe
-riods during its early stages of Indonesia Shar’iah compliance and Malaysia Shari’ah compliance development. In the early stages
showed that many turbulences influence the
establishment of shari’ah indices in both countries specially in term of policy and
so-cialization.
2. 1st January 2005 – 29th December 2008; pe -riods during which the Indonesia Shari’ah Compliance and Kuala Lumpur Shari’ah
compliance stock market grew significantly in size and number. The growth of Indonesia
Shari’ah Compliance and Malaysia Shari’ah compliance are because both countries has
implemented and formulated socialization
process.
3. 1st January 2009 – 29th December 2010 peri
-ods after market crash. The period after
mar-ket crash showed that both shari’ah index in Indonesia and Malaysia are reluctant to sev-eral crisis such as Subprime mortgage crisis in US and debt crisis in Europe.
The stages allowed us to test for the pres -ence of the monthly and pre-holiday effect over shorts period of time. It also enables us to
deter-mine whether there was any persistent monthly
and pre-holiday effect in the Indonesia and Ma-laysia Shari’ah compliant.
Methodology
Monthly continuously compounded log re-turns are calculated as;
Rt = log *100 1)
The standard methodology employed in in-vestigating seasonality in monthly returns
en-tails estimating an OLS regression with dum -mies to capture month of the year effects as; R
R
tis the continuously compounded index re-turn on month t as shown in (1) and Ptdenotes the asset price at time t. The M
it are dummy var-iables so that M1t = 1 if month t is January and
zero otherwise; M2t =1 if the month t is
Febru-ary and zero otherwise and so forth. The OLS coefficients α1 to α12 are the mean returns for
January through December respectively and ɛt
is the stochastic term. The presence of monthly seasonality implies;
H0: α1 = α2,..., α12 = 0 against H
1 : αi ≠ 0 for i = 1,..., 12 3) If the null hypothesis is rejected, then stock returns must exhibit some form of monthly sea-sonality.
Previous evidence examined the month of the year effect in various markets in the con-text of equation (2), using the standard t and F
-test without paying attention to the time series
properties of the data. For instance the error in the model may be autocorrelated, resulting in misleading inferences. Also the error variances may not be constant over time, resulting in
in-efficient estimates if there is time-varying vari
-ance. The first drawback is resolved by includ
-ing autoregressive terms in (2). However, since we are dealing with monthly data, the issue of
non-synchronous trading is not so prominent
in our data. The second drawback that is of in -terest to us is resolved by making the variance time varying.
ht = ω + + βht-1 + ϕiMit 4)
Where Mit represents monthly dummies, ht is the conditional variance and α and β repre-sent the lagged squared error term and condi-tional. variance respectively. Equation (2) rep-resents our mean equation for the month of the year and equation (4) accounts for conditional heteroscedasticity in the month of the year
ef-fect. Thus we jointly estimate (2) and (4).
The pre-holiday effect is tested via the
fol-lowing regression;
Rt = ξ1 H1t + ξ2H2t + ɛt 5)
Where ξ1 and ξ2 are the mean returns for days
prior to holidays and all other days respectively. H
1t is a dummy that takes the value of unity at all times other than days immediately preceding a
public holiday, when it takes a value of zero. On
the other hand, H2ttakes the value of one before
a public holiday and zero at all other times. The
null hypothesis that means pre-holiday returns are equal to the mean for other days is;
H0 : ξ1 = ξ2 against H1: ξ1 ≠ ξ2 6)
A non-parametric Kruskal-Wallis test was
conducted to test for the equality of returns across the month of the year and see any returns for different stages of data that choosen for this
article. The Kruskal-Wallis test is based on the ranks of the observations. The formula for KW is as follows:
7)
Where k is the of trading months return (k = 12), n is the total number of sample observa-tions, ni is the sample size in i trading month, and Ri is the rank sum of the i trading month. The KW test statistics has a chi-square
distri-bution with (k-1) degrees of freedom. In this
study, there are eleven degrees of freedom with a 5% level of significance.
Result and Discussion
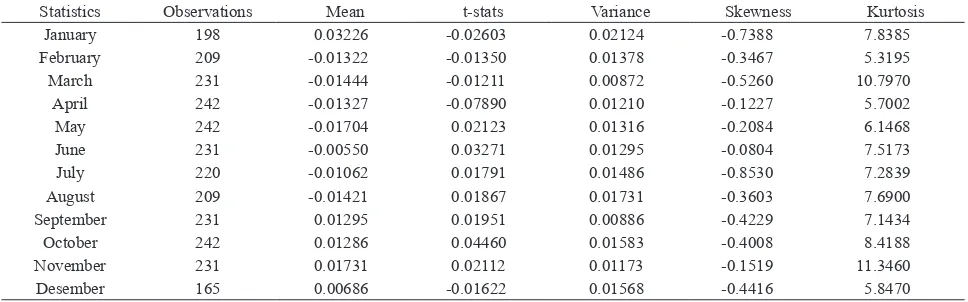
Table 1 provides a summary of statistics on the mean returns for each month of Indonesia Shari’ah compliance. The descriptive
statis-tics run for the whole periods: 2000-2010. The results showed that mean return for Indonesia
is positive in the month of May, June, August,
September, October and November while the rest of the month is showed negative returns, while March suffers lowest return, June ob -serves the highest return in stock market in In-donesia Shari’ah Market. Returns exhibit
nega-tive skewness (i.e., data are skewed to the left) for four months and positive skewness (i.e., data are skewed to the right) for eight months.
which represents leptokurtic distribution, i.e., flatter tails than the normal distribution.
Table 2 provides a summary of statistics on the mean returns for each month of Malaysia Shari’ah compliance. The descriptive
statis-tics run for the whole periods : 2000-2010. The results showed that mean return for Malaysia
Shari’ah compliance is positive in the month of January, September, October, November
and December. While the rest of the month is showed negative returns, while June suffers lowest return, January observes the highest
return in stock market in Malaysia Shari’ah
compliance. Returns exhibit negative skewness (i.e., data are skewed to the left) for four months and positive skewness (i.e., data are skewed to
the right) for eight months. Five months have
kurtosis greater than three which represents leptokurtic distribution, i.e., flatter tails than the
normal distribution.
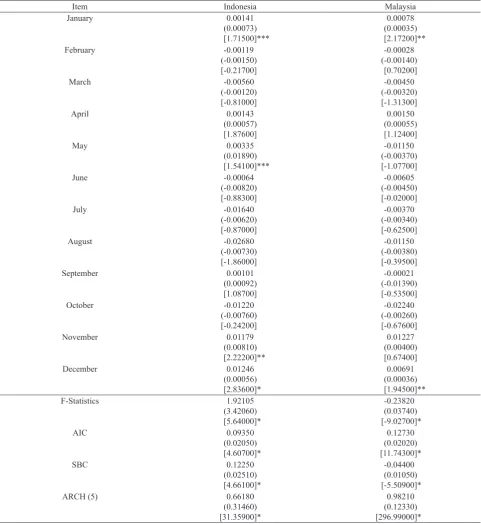
From Table 3, we can see similar pattern in
Indonesia and Malaysia Shari’ah compliance,
around January there are significant return showed that most of investor in Shari’ah
com-pliance are getting significant return in January as the result of wait and see strategy through what happened around December where most
of government rules, including tax rules are
announced. Companies year end financial re
-porting are due to the end of December, this announcement will cause several companies are more profitable or interesting to several in
-vestor because of their performance in finan -cial reporting and most of the companies that
showing a good performance are classified in
the Shari’ah compliance because most of the companies came from the background of food and beverages, properties, and mining
indus-tries where this industry during holiday has an
increasing in sales due to holiday or religion festivity such as Idul Fitri or Christmas holiday.
The Holiday Effect
The holiday effect causes higher-than-nor-mal returns to be observed around holidays,
mainly in the pre-holiday period. However, we define the holiday effect as the return from the
Table 2. Summary statistics of monthly returns Kuala Lumpur Shari’ah compliance
Statistics Observations Mean t-stats Variance Skewness Kurtosis
January 198 0.03226 -0.02603 0.02124 -0.7388 7.8385
February 209 -0.01322 -0.01350 0.01378 -0.3467 5.3195
March 231 -0.01444 -0.01211 0.00872 -0.5260 10.7970
April 242 -0.01327 -0.07890 0.01210 -0.1227 5.7002
May 242 -0.01704 0.02123 0.01316 -0.2084 6.1468
June 231 -0.00550 0.03271 0.01295 -0.0804 7.5173 July 220 -0.01062 0.01791 0.01486 -0.8530 7.2839
August 209 -0.01421 0.01867 0.01731 -0.3603 7.6900
September 231 0.01295 0.01951 0.00886 -0.4229 7.1434
October 242 0.01286 0.04460 0.01583 -0.4008 8.4188
November 231 0.01731 0.02112 0.01173 -0.1519 11.3460
Desember 165 0.00686 -0.01622 0.01568 -0.4416 5.8470
Table 1. Summary statistics of monthly returns Indonesia Shari’ah compliance
Statistics Observations Mean t-stats Variance Skewness Kurtosis
January 289 -0.0186 -0.2213 0.5576 1.2512 4.2594
February 231 -0.0221 -0.1626 0.2183 -2.8137 11.2397
March 242 -0.0022 -0.2893 0.3134 -0.0844 1.8952
April 231 -0.0125 -0.2344 0.2137 -0.2885 1.7653
May 242 0.0252 -0.0831 0.2396 1.0748 2.3908 June 231 0.0506 -0.0804 0.2859 1.0064 1.4775
July 220 -0.0081 -0.1431 0.1879 0.6904 0.3974
August 187 0.0109 -0.1566 0.1696 0.0160 1.7085
September 242 0.0271 -0.0618 0.3159 2.7519 10.1880
October 241 0.0413 -0.1521 0.5692 2.9903 12.9692
November 242 0.0191 -0.1714 0.2546 0.6453 0.4085
Table 3. Monthly Seasonality Indonesia and Malaysia Shari’ah Stock Returns
*denotes significance in 0.01 level , **denotes significance in 0.05 level *** denotes significance in 0.10 level - standard errors in parentheses, z-statistics in brackets
Table 4. Summary of National Holidays
Item National Holidays
Indonesia January; New Year (1st)#, Prophet Muhammad SAW Maulid (14th#), February; Chinese New Year (10th)#, March; Nyepi New
Years (12th)#, Isa Almasih (29th)#, May; Isa Almasih (9th)#, Waisak Celebration (25th)#, June; Prophet Muhammad SAW Isra’
Mi’raj (6th)#, August; Indonesian Independence Day (17th)#, December; Christmas (25th)#.
Malaysia January; New Year (1st)#, Prophet Muhammad Birthday (24th)#, Thaipusam (27th), February; Federal Teritory day (1st),
Chinese New Year (10th, 11th)#, May; Labor Day (1th), Wesak day (24th)#; June; Agongs Birthday (1st), Israk & Mikraj (6th)#;
August; Hari raya puasa (8 & 9th), National day (31st)#, September; Malaysia day (16th#), October; Hari raya haji (15th),
November; Deepavali (3rd), Awal Muharram (5th), December; Christmas (25th)#.
pre-holiday close to the post-holiday close. In
other words, the holiday returns are the daily returns for the trading weekday that follows a non-trading weekday. We summarize these for
Indonesia and Malaysia Shari’ah compliance.
From the table below we can see that there is
quite different of holiday in Indonesia and Ma-laysia related to the diversity of religion and culture in both countries.
Table 5 provides the result of pre-holiday re
-turn were positive for Shari’ah compliance in Indonesia and Malaysia. Several factors, includ-ing economic and behavioral, could contribute to the observed positive pre-holiday returns in Indonesia and Malaysia Shari’ah compliance.
One possible explanation is that the significant
pre-holiday returns are a manifestation of the
well-documented closing effect in which high
returns for securities are observed at market closings. Indonesia and Malaysia are emerging
markets with a long period establishment his -tory. On the behavioral side, explanations are related to the investor behavior and reaction of certain religion holiday that happened in both countries such as Ramadhan holiday that last
for one month where at this moment investor tend to slowing down their trading activity. This kind of reaction from investor are showing
a optimism and trusting the market about future prospects.
The behavioral perspective also explained
why after a short holiday (one day holiday) such as Maulid Nabi Muhammad SAW both in
Indonesia and Malaysia, trading tend to move
slowly, since investor were only having short
time period to make decision. Compared to long Holiday such as Idul Fitri holiday that last
for 3 days until a week both in Indonesia and
Malaysia, the mean return of trading tend to in-creased, particularly for Shari’ah compliance, since investor have a long time to make decision
in pre or post holiday, where in pre-holiday the investment decision that they make is whether
to sell or buy. Buying in pre holiday before a
very long holiday means that investor wants to
take advantages of the increasing due to high consumption of society such as foods, clothes, properties and other commodities. High con-sumption makes several companies in Food and
Beverages and other industries increased, while
selling after a long holiday could be meaning
investor wants to liquidate their investment in form of cash after a huge cash outflow during
holiday.
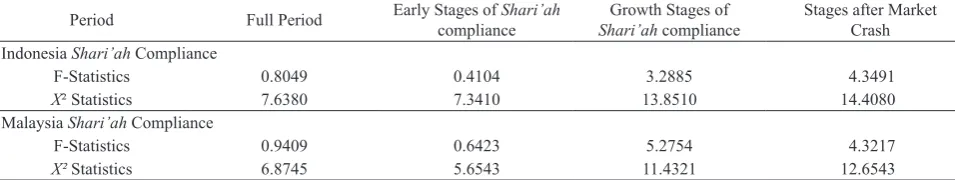
Table 6 shows the results for Wald test and Kruskal Wallis test. The F-test does not reject
the null hypothesis at 5% level of significance of all periods. For KW test the values of Χ²
sta-tistics are insignificant at 5% level for all peri
-ods. For each stages in the growth of Shari’ah compliance in Indonesia and Malaysia, there are no equality of means for each stages, it means there are adjusting period. From early
stages more into implementing the socializa -tion process about Shari’ah compliance to the
investor, where in each stages apparently also
Table 5. Pre-holiday effects in the Indonesia and Malaysia Shari’ah stock return
Item Indonesia Shari’ah Compliance Malaysia Shari’ah Compliance
Pre- Holiday 0.0004(0.362) 0.0002(0.313)
Other -0.0005(-1.57) 0.0017(0.768)
F-Stat 0.1390[0.289] 0.6520[0.343]
Notes: Estimates of equation (5).p-values are shown in [ ] while t-statistics are shown in ( ).
Table 6. Wald Test and Kruskal-Wallis test results for three different stages of Indonesia and
Malaysia Shari’ah compliance
Period Full Period Early Stages of Shari’ah
compliance
Growth Stages of
Shari’ah compliance
Stages after Market Crash
Indonesia Shari’ah Compliance
F-Statistics 0.8049 0.4104 3.2885 4.3491
Χ² Statistics 7.6380 7.3410 13.8510 14.4080
Malaysia Shari’ah Compliance
F-Statistics 0.9409 0.6423 5.2754 4.3217
Χ² Statistics 6.8745 5.6543 11.4321 12.6543
showing the growth for the number of investor
and companies and on the last stage apparently the Shari’ah market were more endure against
financial crisis.
Table 6 also showed some different among
Indonesia and Malaysia Shari’ah compliance,
not only from the growth side but also from the
Shari’ah screening. In the end of 2012 the
num-ber of companies that classified as Shari’ah in
Indonesia were 214 and 766 for Malaysia. The number showed Indonesia Stock Exchange
have to change the Shari’ah screening process system into more shorter period but also need
to establish a better socialization process and
regulation system of Shari’ah compliance not only to the investor but also for the society.
Conclusion
There is a difference between investing in
Shari’ah compliant stocks and conventional stocks. The conventional stocks are based on
the capital market set of rules and law, while
Shari’ah stock market has to follow both the
capital market set of laws and also the Is -lamic principles of transactions. The study on Shari’ah related issues are rare not only in
In-donesia and Malaysia but also elsewhere. This paper investigates two anomalies in security returns: the month of the year and the
pre-holiday effect, and accounted for condition-al volatility in the month of the year effect. The existence and persistence of anomalies tend to
contradict the notion of market efficiency, since
traders can earn abnormal returns just by exam-ining patterns and setting trading strategies ac-cordingly, resulting in returns that are not
com-mensurate with risk.
The study finds that January effect is pre -sented only in Malaysia Shari’ah Compliance.
On the contrary we find a December effect, where the highest significant return are reported in December, where the specific effects are pre
-sented in Indonesia, While for October, Indone -sia and Malay-sia Shari’ah compliance has quite similar return. Furthermore, a February effect is stronger than January, as it is presented in Ma-laysia Shari’ah compliance.
April effect is followed by Indonesia Shari’ah
compliance, some other weaker monthly anom -alies are March, September and November ef-fect that presented in Shari’ah stock market in both countries. For the holiday effect is only
significant for Malaysia Shar’iah compliance.
There are high and significant returns in days
preceding a holiday January returns are positive
and significant for Indonesia. February returns
are higher for Malaysia. The discoveries are
statistically significant. anomalies could imply
the ability of trading rules to yield superior
out-comes if they are also economically significant. The results also related to the market size, capitalization and number of companies that
listed in both Shari’ah compliance but these still need further investigation particularly
re-garding on how each investor in both countries
reacts to different holiday season in both coun-tries, For example in Malaysia they has deep-avali day that related to cultural festivity and in Indonesia has Isa Almasih holiday that related to religion festivity, the differences makes in-vestor react differently in term of investment decision.
The result suggests that the Shari’ah
compli-ance has not been purely efficient and makes
investors can take abnormal return market in
month and holiday, a findings similar to those
of conventional stock in various countries.
Abraham, A. and Ikenberry, D. (1994), The In
-dividual Investor and the Weekend Effect,
Journal of Finance and Quantitative Analy-sis, 29, 263-277.
Al-Loughani, N. E., Al-Saad, K. M., and Ali,
M.M. (2005), The Holiday Effect and Stock
Returns in the Kuwait Stock Exchange, Journal of Global Competitiveness, 13(1-2), 81-91.
Arsad, Z. and Coutts, J. A. (1996), The Week
-end Effect, Good News, Bad News and The
Index: 1935 – 9, Applied Economics Letters, 3, 797-801.
Blandon, J.G. (2010), Return’s Seasonalities in the LATIBEX Market, Revista de Analisis Economico, 25(1), 3-14, June 2010.
Chong, R., Hudson, R., Keasey, K., and Littler,
K. (2005), Pre-Holiday Effects: Internation
-al Evidence on the Decline and Revers-al of a
Stock Market Anomaly, Journal of Interna-tional Money and Finance, 24, 1226-1236.
Choudhry, T. (2001), Month of the Year Effect and January Effect: Evidence from a
Non-Linear GARCH Model, Int. J. Finance. Econ, 6, 1-11, http://dx.doi.org/10.1002/ ijfe.142.
Doran, J., Danling J., and Peterson, D. (2008),
Gambling in the New Year? The January Idiosyncratic Volatility Puzzle, MPRA Paper
8165, University Library of Munich, Ger -many.
Fama, E. (1970), Efficient Capital Markets: A Review of Theory and Empirical Work,
Journal of Finance, 25, 383-417.
Fountas, S. and Segredakis, K. N. (2002), Emerging Stock Markets Return
Season-alities: The January Effect and the
Tax-Loss Selling Hypothesis, Applied Finan-cial Economics, 12, 291-299. http://dx.doi.
org/10.1080/09603100010000839.
French, K.R. (1980), Stock Returns and the
Weekend Effect, Journal of Finance and Economics, 8, 55-70.
Giovanis, E. (2009), Calendar Effects in Fifty-Five Stock Market Indices, Global Journal of Finance and Management, 1(2), 75-98. Gultekin, M.N. and Gultekin, N.B. (1983),
Stock Market Seasonality: International
Evidence, Journal of Finance Economic, 12,
469-481.
Hakan, B. and Halil, K. (2001), The Day of the Week Effect on Stock Market Volatility,
Journal of Economics and Finance, 25(2): 181-190.
Hansen, P.R., Lunde, A., and Nason, J.M.
(2005), Testing the Significance of Calendar
Effects, Federal Reserve Bank of Atlanta,
Working Paper, 2005-2.
Harris, L. (1986), A Transaction Data Study of Weekly and Intradaily Patterns in Stock
Returns, Journal of Financial Economics,
16(1), 199-117.
Ho, P. C. and Kok, K. L. (1995), Day-Of-The-Week Effect of the Malaysian Second Board
Stock Market, Malaysian Management Re-view, 1-10.
Ho, R.Y. and Cheung, Y-L. (1994), Seasonal
Pattern in Volatility in Asian Stock Markets, Applied Financial Economics, 4, 61-67. Husain, F. (1998), A Seasonality in the Pakistani
Equity Market: the Ramadhan Effect, The Pakistan Development Review, 37, 77—81.
Jaffe, J. and Westerfield, R. (1985), A Pattern in Japanese Common Stock Return: Day of the Week Effect and Turn of the Year Effects, J. Finance and Quant. Analysis, 20(2),
261-272.
Keim, D.B. (1983), Size Related Anomalies and Stock Return Seasonality: Further Em -pirical Evidence, Journal of Finance and Economic, 12, 13-32.
Keim, D.B. and Stambaugh, R. (1984), A Fur
-ther Investigation of the Week End Effect in
Stock Return, Journal of Finance and Eco-nomic, 39, 819-835.
Kenourgios, D. and Samitas, A. (2008), The Day of the Week Effect Patterns on Stock Market Return and Volatility: Evidence for
the Athens Stock Exchange, International Research Journal of Finance and Econom-ics, 15, 70-81.
Keong, L., Yat, D., and Ling, C. (2010), Month-Of-The-Year Effects in Asian Countries: A
20-year Study (1990-2009), African Journal of Business Management, 4(7), 1351-1362.
Lucey, B.M. (2005), Are Local or International Influences Responsible for the Pre-Holiday
Behaviour of Irish Equities? Applied
Finan-cial Economic.
Marrett, G. and Worthington, A. (2011), The month-Of-The-Year Effect in the Austral -ian Stock Market, A Short Technical Note on
the Market, Industry and Firm Size Impacts,
Australasian Accounting Business and Fi-nance Journal, 5(1), 117-123.
Mehdian, S. and Perry, M. J. (2002), Anomalies
in US Equity Markets: A Re-Examination of
the January Effect.
Effect, Large Trades and Small Investor Behaviour, Journal of Empirical Finance,
11(2), 231-246, March 2004.
Patel, J.B. (2012), A Further Analysis of Small Firm Stock Returns, Managerial Finance, 38(7), 653-659, http://dx.doi.
org/10.1108/03074351211233113.
Pearce, D.K. (1996), The Robustness of Calen
-dar Anomalies in Daily Stock Returns, Jour-nal of Economics and Finance, 20(3), 69-80.
Rezvanian R., Turk R., and Mehdian, S. (2008), Anomalous Behavior in Security Markets:
Evidence from Equity Markets of the Peo-ple's Republic of China, retrieved from
www.apeaweb.org/confer.
Rogalski, R. (1984), New Findings Regarding Day of the Week Returns Over Trading and