Agricultural and Resource Economics Review 39/3 (October 2010) 468–484 Copyright 2010 Northeastern Agricultural and Resource Economics Association
Are Travelers Willing to Pay a Premium
to Stay at a “Green” Hotel? Evidence
from an Internal Meta-Analysis of
Hedonic Price Premia
Nicolai V. Kuminoff, Congwen Zhang, and Jeta Rudi
A growing number of hotels provide “green” lodging for travelers with strong environmental preferences. Twelve states have developed certification programs to regulate these claims. After describing the new market for green lodging, we use data on prices and amenities of “green” and “brown” hotels in Virginia to estimate a hedonic model of hotel room pricing. We find that travelers can expect to pay a significant premium for a standard room in a green ho-tel. An internal meta-analysis is used to evaluate the robustness of this result to subjective econometric modeling decisions. Our results indicate a premium between $9 and $26.
Key Words:green lodging, hedonic, hotel, internal meta-analysis
“Green” goods have become big business. Market prices reveal that consumers are willing to pay a premium for hybrid cars (Kahn 2007), solar elec-tricity (Kotchen and Moore 2007), fair-trade cof-fee (Loureiro and Lotade 2005), and eco-labeled seafood (Johnston et al. 2001), to name only a few examples. Paying a premium for these “green” goods lets people feel that they are doing their part to help the environment or to help workers in developing countries. Mainstream retailers are cashing in on this sentiment. Walmart, Kmart, and Target have all expanded their product line to include goods labeled as “green” or “sustainable,” while making great efforts to advertise their com-pany’s commitment to the environment.1 This
Nicolai Kuminoff is Assistant Professor in the Department of Eco-nomics at Arizona State University in Tempe, Arizona. Congwen Zhang is a Ph.D. student in the Department of Applied Economics at Virginia Tech in Blacksburg, Virginia. Jeta Rudi is an undergraduate student in the Department of Economics at Berea College in Berea, Kentucky.
The authors thank Joshua Duke, Chris Parmeter, Jaren Pope, and two anonymous referees for helpful comments and suggestions on this re-search. Kuminoff’s work on this project was supported by the USDA Cooperative State Research, Education and Extension Service, Hatch Project No. VA-135832. Research support for Jeta Rudi from Berea College is also gratefully acknowledged.
1
For example, a search on the word “green” on Walmart’s website returns links to green products, tips for “green living,” and information about the chain’s commitment to the environment.
growth seems likely to continue in the near fu-ture. Applications to the U.S. Patent and Trade-mark Office with the word “green” more than doubled between 2006 and 2007 (Dechert LLP 2008).
Is-land, Vermont, Virginia) and in other major travel destinations (California, Hawaii, Michigan, Wis-consin). All of the state programs share a similar objective: to reduce energy consumption, water consumption, and pollution in the lodging sector while allowing participating hotels and inns to take advantage of the demand for green goods and services. Similar programs exist in parts of Europe and Australia (Spilanis and Vayanni 2004, Dalton, Lockington, and Baldock 2008).
Going green can decrease a hotel’s rate of en-ergy and water consumption. However, the con-version process can require large sunk costs for energy-efficient and water-efficient appliances, as well as higher operating costs associated with purchasing environmentally benign cleaning sup-plies and recycled paper products. These costs may, in turn, be passed on to travelers through higher room rates. Are travelers willing to pay a premium to stay at a green hotel? We investigate this question.
Using data on the room rates and amenities of “green” and “brown” hotels in Virginia, we esti-mate a hedonic model of hotel room pricing. The results from a series of simple linear regressions suggest that, all else constant, a standard room in a green hotel is between $17 and $23 more ex-pensive than a standard room in a brown hotel. However, like most empirical hedonic studies, our estimate for this implicit price reflects our maintained assumptions about the true shape of the equilibrium price function and our choices for which hotel amenities to include as covariates in the model. Recent work in the broader literature on nonmarket valuation has suggested a need to assess the sensitivity of estimates for nonmarket values to the researcher’s subjective modeling de-cisions (Banzhaf and Smith 2007, Kuminoff 2009). Therefore, as a robustness check on our re-sults, we estimate a large number of randomly chosen specifications for the hedonic price func-tion (40,000) and then perform a meta-analysis to synthesize our results, following the procedure outlined by Banzhaf and Smith (2007). While we almost always find a statistically significant price premium for green hotels, the magnitude of the premium depends on which variables are in-cluded in the model as regressors.
Overall, our analysis makes three contributions to the literature on the demand for green goods and hedonic valuation of amenities. First, we
in-troduce the emerging domestic market for green lodging. With nearly a billion hotel and motel room nights purchased in the United States each year (Patkose, Burnett, and Cook 2007), lodging represents a major market with the potential to reveal new information about consumer prefer-ences for green goods and services. Second, our hedonic estimates suggest that travelers are will-ing to pay a premium for green lodgwill-ing. This re-sult builds on the evidence from past hedonic studies which have found that rental prices of vacation properties tend to depend on their prox-imity to environmental amenities (e.g., Taylor and Smith 2000, Mollard, Rambonilaza, and Vollet 2007) and that, in general, consumers are willing to pay a premium for a “greener” version of a pri-vate market good (e.g., Nimon and Beghin 1999, Johnston et al. 2001, Loureiro and Lotade 2005). Finally, our sensitivity analysis represents the first application of internal meta-analysis to evaluate the robustness of reduced-form hedonic estimates to subjective econometric modeling decisions. Re-cent quasi-experimental studies have stressed the need to think carefully about the implicit or ex-plicit assumptions that identify hedonic estimates for implicit prices (e.g., Pope 2008, Greenstone and Gayer 2009). Internal meta-analysis provides a simple way to decompose the identifying power of assumptions about hedonic functional form and which covariates to include in the model. The remainder of the paper proceeds as fol-lows. We begin by using national data on Internet traffic to document the growing consumer interest in green lodging. This is followed by a descrip-tion of Virginia’s green lodging certificadescrip-tion pro-gram. Then we develop a hedonic model of equi-librium room rates and use it to focus our subse-quent discussion of empirical modeling issues. After describing our data on green and brown hotels in Virginia, we present baseline economet-ric results and perform the meta-analysis. Finally, we conclude by discussing topics for future research.
Background
Tracking Consumer Interest in Green Lodging
are no national statistics on the number of annual visits to green hotels, we can develop a rough sense of recent trends in consumer interest by studying Internet traffic. According to national survey data from the U.S. Travel Industry Asso-ciation, 80.4 percent of travelers with Internet access used the Internet to plan their trips in 2007 (Fesenmaier and Sheatsley 2008). For these on-line travelers, the web provides a wealth of infor-mation about green lodging. For example, it has been profiled in multiple travel features for CNN
and MSNBC (e.g., Lovitt 2009). Moreover, the descriptions of individual hotels provided by the major booking websites (e.g., Expedia, Travel-ocity, Orbitz) include information about each hotel’s greenness. For example, Travelocity’s search results include a green leaf-shaped icon for “eco-friendly hotel” displayed prominently be-neath the universal blue icons for “wheelchair ac-cess” and “no smoking.” Alternatively, users can browse Travelocity’s directory of eco-friendly hotels.
To develop a quantitative measure of consumer interest in green hotels, we use the Google Trends search engine to track the online search volume for phrases that prospective travelers are likely to use in a search for green lodging. The Google Trends tool extracts normalized time-series data on searches for any word or phrase.2 Google does not provide raw data on the number of searches. Instead, it provides an index of search volume. For example, Panel A in Figure 1 displays a monthly index for the volume of U.S. Google searches from 2004 through 2008 that included the word “hotels.” The index is normalized by setting the mean search volume during this period equal to 1.0. The cyclical pattern in the volume of search traffic makes sense. The troughs occur in December and January when people tend to stay home for the holidays. The peaks occur in July when people tend to go on vacation. The large drop between 2007 and 2008 matches the onset of recession in the U.S. economy. We have also ad-ded a linear trendline to the figure, which demon-strates that, overall, the search volume for “ho-tels” trended down during this five-year period. Panel B in Figure 1 displays the search volume
2
Choi and Varian (2009) describe these data. Their econometric analysis suggests that the data can help to explain automotive sales, housing starts, and the volume of international travel.
for the phrase “green hotels” during the same five-year period. While the cyclical pattern is es-sentially the same as for “hotels,” the time trend is reversed. The volume of search traffic for “green hotels” trended up between 2004 and 2008. This would suggest a growing relative interest in green hotels on the part of prospective travelers.3 To help explain this interest and to provide a clearer definition of the management practices that char-acterize green lodging, we now turn to a descrip-tive summary of one of the largest state-operated certification programs.
A Closer Look at a State Certification Program: Virginia Green Lodging
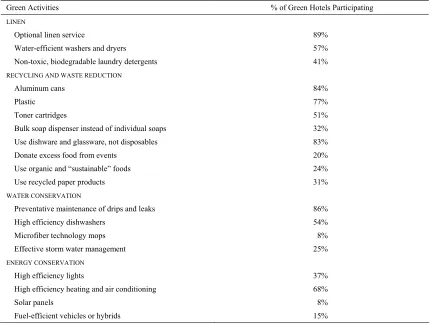
With just over 300 participating hotels and inns as of July 2009, Virginia Green Lodging is among the largest state programs. It is administered by the Virginia Department of Environmental Qual-ity (VDEQ). Hotels and inns seeking to obtain the “Virginia Green” seal must demonstrate that they participate in each of five “core” activities: (i) op-tional linen service, (ii) recycle and reduce waste, (iii) water conservation, (iv) energy conservation, and (v) developing the capacity for hosting green events, conferences, and meetings. Participation in each of these broadly defined activities can be demonstrated through one or more specific man-agement practices approved by VDEQ. Table 1 provides examples of the acceptable management practices in each of the five core areas, together with the share of green hotels that engage in that practice.4 For example, 89 percent of Virginia’s
green hotels and inns provide guests with the op-tion to reuse sheets and towels rather than wash-ing them every day, 84 percent recycle aluminum cans, and 83 percent avoid the use of disposable plates and cutlery. Other green activities are less common. Forty-one percent of the participating hotels and inns use biodegradable laundry deter-gent, 20 percent donate excess food from meet-ings and events, and only 8 percent have solar panels.
Once a hotel has applied for membership in the program, officials from VDEQ visit the facility to
3
Searches for the phrases “green travel” and “green lodging” suggest similar upward trends in interest.
4
A. Search volume for “hotels” B. Search volume for “green hotels”
Figure 1. Google Search Volume Indices for Key Words Related to Green Lodging
Note: These indices reflect monthly Google search volumes for the entire United States. The indices are normalized by the mean search volume for each key word from the beginning of 2004 through the end of 2008. Linear trendlines have been fitted to the search volume data for “hotels” and “green hotels.”
verify that it participates in the five core activi-ties. The lodging facility is then granted member-ship in the program and can display the “Virginia Green” seal in its advertisements. Most partici-pating hotels display this seal on their webpages. Travelers can also learn about Virginia’s green hotels by browsing Internet travel sites. For ex-ample, the homepage of the Virginia Bed and Breakfast Association prominently features a searchable database of Virginia’s certified bed and breakfast inns. Likewise, the state’s official tourism program (“Virginia is for lovers”) fea-tures a searchable online database of all of Vir-ginia’s green lodging facilities. Travelers seeking more information about the management practices of specific hotels can browse through the VDEQ
website, which profiles each green hotel and de-scribes the management practices it has under-taken to obtain certification.
Virginia’s green lodging program is fairly representative of the programs operated by other states. Most programs provide detailed descrip-tions of the green activities undertaken by each hotel and feature searchable databases of hotels for prospective travelers. The main difference be-tween Virginia’s program and those in other states is that membership in Virginia’s program is discrete. Every hotel and inn in Virginia is either certified green or not certified at all. In contrast, the programs operated in California, Florida, and
Michigan distinguish between various levels of participation. For example, California green ho-tels that satisfy a minimum level of participation in the program are awarded “one palm” status, whereas hotels that participate in additional ac-tivities are awarded “two palm” status.
The Virginia Green Lodging program main-tains that its certification process conveys multi-ple benefits to hotels and travelers, including pollution reduction, conservation of natural re-sources, and marketing strategies that target envi-ronmentally conscious guests. Some in the hos-pitality industry also view green lodging as an op-portunity to hedge against potential future regula-tion (Butler 2008). In equilibrium, all of these supply and demand shifters should affect the price charged for a room.
A Hedonic Model of Hotel Room Pricing
Table 1. Activities Performed by Hotels in Virginia’s Green Lodging Programa
Green Activities % of Green Hotels Participating
LINEN
Optional linen service 89%
Water-efficient washers and dryers 57%
Non-toxic, biodegradable laundry detergents 41%
RECYCLING AND WASTE REDUCTION
Aluminum cans 84%
Plastic 77%
Toner cartridges 51%
Bulk soap dispenser instead of individual soaps 32%
Use dishware and glassware, not disposables 83%
Donate excess food from events 20%
Use organic and “sustainable” foods 24%
Use recycled paper products 31%
WATER CONSERVATION
Preventative maintenance of drips and leaks 86%
High efficiency dishwashers 54%
Microfiber technology mops 8%
Effective storm water management 25%
ENERGY CONSERVATION
High efficiency lights 37%
High efficiency heating and air conditioning 68%
Solar panels 8%
Fuel-efficient vehicles or hybrids 15%
aThese practices serve as examples of the activities that can be used to qualify a hotel for “Virginia green” status. A more
com-plete list is available from the program website: http://www.deq.virginia.gov/p2/virginiagreen. In order to qualify for “Virginia green” status, hotels must also be willing to offer a “green” package for conferences, meetings, and other events.
and sellers in a market. Under the assumptions of his model, regressing product prices on their at-tributes can reveal consumers’ marginal willing-ness-to-pay (MWTP) for individual attributes of a differentiated product.
Hedonic models are frequently used to estimate the implicit prices of amenities capitalized into residential property values, such as water clarity near lakefront property (Gibbs et al. 2002), prox-imity of a home to agricultural open space (Geo-ghegan, Lynch, and Bucholtz 2003), and tree dam-age from invasive species (Holmes, Murphy, and Bell 2006). Previous studies have also developed hedonic models of rental rates for vacation prop-erties (Taylor and Smith 2000, Mollard, Rambo-nilaza, and Vollet 2007) and of green goods such as eco-labeled apparel (Nimon and Beghin 1999). However, this study is the first to estimate the
price premium for green lodging in the market for hotel rooms.
(1)
, ,
max , , ; subject to ,
b gX U b g XD y b P g X .
The first-order conditions to this utility maximi-zation problem provide one of the key results of the hedonic model. Equation (2) shows the first-order condition for g:
(2) P g
, U gg U b
w w w
w w w
X
.
Travelers will maximize their utility by choosing a hotel which provides them with the level of environmental stewardship at which their ginal willingness-to-pay exactly equals its mar-ginal implicit price.
To model the supply side of the market, let
C(g,X;E) denote the hotel’s cost function, where
E is a vector of parameters describing the costs faced by the hotel. The hotel’s profit-maximiza-tion problem can be defined as
(3)
,
max , , ;
gX S P g X C g Xȕ .
Each hotel chooses the g,X combination that maxi-mizes its profits, given E. Equation (4) defines the corresponding first-order conditions for g:
(4) P g
, C g , ;g g
w w E
w w
X X
.
The hotel chooses g to set the marginal cost of environmental stewardship equal to its marginal implicit price. Assuming perfect competition, equilibrium in the market for green lodging oc-curs when the first-order conditions in equations (2) and (4) are simultaneously satisfied for all travelers and hotels.
The gradient of the equilibrium price function that satisfies equations (2) and (4) provides an es-timate of what travelers are willing to pay for green lodging. It also provides an estimate of the marginal cost of providing green lodging. There-fore, the empirical challenge is to estimate
P(g,X) econometrically using data on room rates and characteristics.
Empirical Model
Data Sources and Modeling Issues
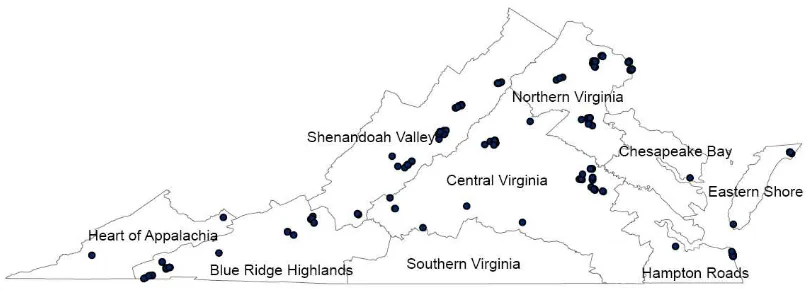
Empirical hedonic analysis begins by defining the scope of the market. We chose to focus on the market for hotels, as opposed to bed and breakfast inns, because hotels represent the vast majority of the hospitality industry. To collect data on the characteristics of Virginia hotels, we used the “Hotel-Guides” online search engine to system-atically extract information on the room rates and characteristics of hotels throughout the state of Virginia in the summer of 2008.5 This allowed us to assemble a comprehensive set of hotel charac-teristics, as well as the minimum price charged for a single night stay in a standard room at each hotel. Then we checked each hotel against the database of “Virginia Green” hotels provided by the Virginia Department of Environmental Qual-ity in order to determine which ones had received green certification. Finally, we used GIS software to measure the distance from each hotel to the following amenities: the city of Washington, D.C., the city of Richmond, public beaches on the Vir-ginia coast, and the Appalachian Trail, which serves as a proxy measure of opportunities for mountain recreation.6 Figure 2 shows the loca-tions of the 223 hotels in the data we assembled overlaid on the nine “tourism regions” defined by the Virginia Department of Tourism.
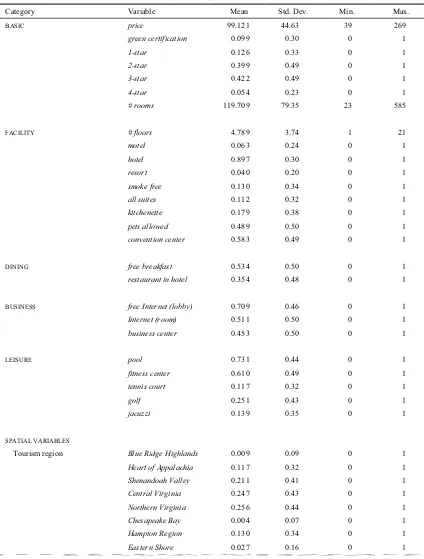
Table 2 reports summary statistics for the char-acteristics of hotels. The minimum rate for a basic room ranged from $39 to $269. The average fa-cility had 5 floors with 120 rooms and a room rate of $99. All other characteristics were meas-ured using indicator variables. Common charac-teristics include an indoor swimming pool (73 percent), free Internet in the lobby (71 percent), a fitness center (61 percent), a convention center (58 percent), and free continental breakfast (53 percent). Uncommon characteristics include in-room kitchenettes (18 percent), being entirely smoke-free (13 percent), and tennis courts (12
5 We chose this search engine over other candidates such as Expedia,
Travelocity, and Orbitz because it offered the most comprehensive set of hotel characteristics for Virginia. Its website is http://hotel-guides. us/virginia/va-hotels.html. The data were collected in July 2008.
6
Figure 2. Locations of 223 Hotels within Virginia’s Tourism Regions
Note: It is often the case that several hotels are located too close together to distinguish them on the map. As a result, a single dot often represents two or more hotels.
percent). Most of the facilities in our data were hotels with either 2 or 3 stars, and 10 percent of them had received the “Virginia Green” certifica-tion from VDEQ. Most of the hotels are located in the Central Virginia, Northern Virginia, and Shen-andoah Valley tourism regions. Just over 80 per-cent of the hotels are located in a Census-defined urban area, and many of them are located within 20 miles of the Appalachian Trail (42 percent), a public beach (22 percent), Washington, D.C. (17 percent), or the city of Richmond (15 percent). In order to develop an estimable hedonic model from our data on hotel characteristics and room rates, three modeling issues must be addressed. The first issue is the distinction between market prices and offer prices. The market price of lodging that would be consistent with the hedonic model in equations (1)–(4) is determined by the distribution of rooms that are actually rented. Ideally, one would collect data on this distribu-tion by combining posted room rates with occu-pancy records. The difficulty is that occuoccu-pancy records are not publicly available.7
Without occupancy records, our analysis must
7
One way to obtain occupancy data is to contact firms directly. This is most effective in situations where a small number of firms account for a large share of transactions. For example, Taylor and Smith (2000) persuaded four property management firms to share their occupancy records for hundreds of beach rental homes on North Carolina’s Outer Banks. These firms accounted for about 40 percent of the market. In contrast, there are hundreds of hotels in Virginia, each of which ac-counts for a small share of the market.
rely on the maintained assumption that transac-tions actually occurred at the offer prices we ob-served. A parallel assumption is often made in the hedonic property value literature when the “price of housing” is defined using Census data on the values that homeowners report for their homes (e.g., Greenstone and Gayer 2009). Kiel and Za-bel (1999) investigate the validity of this assump-tion by comparing actual sale prices to self-re-ported values. They found that the median home-owner overstated the sale price of his or her home by 5.1 percent. Importantly, the size of the error declined with the homeowner’s experience in the market, specifically his or her tenure in the home.8 We would expect there to be a similar ef-fect from experience in the market for lodging. Hotel managers have near continuous feedback on market conditions, which should give them the information needed to post prices that will lead to high occupancy rates. Furthermore, unlike the market for housing, there is little or no scope for bargaining once room rates are posted.
If the rates that were posted during the summer of 2008 exceeded what travelers were actually willing to pay, so that vacancy rates were high, we would expect to see posted rates decline. In fact, we observe the opposite. The average posted
8
Table 2. Summary Statistics Describing 223 Virginia Hotelsa
Category Variable Mean Std. Dev. Min. Max.
BASIC price 99.121 44.63 39 269
green certification 0.099 0.30 0 1
1-star 0.126 0.33 0 1
2-star 0.399 0.49 0 1
3-star 0.422 0.49 0 1
4-star 0.054 0.23 0 1
# rooms 119.709 79.35 23 585
FACILITY # floors 4.789 3.74 1 21
motel 0.063 0.24 0 1
hotel 0.897 0.30 0 1
resort 0.040 0.20 0 1
smoke free 0.130 0.34 0 1
all suites 0.112 0.32 0 1
kitchenette 0.179 0.38 0 1
pets allowed 0.489 0.50 0 1
convention center 0.583 0.49 0 1
DINING free breakfast 0.534 0.50 0 1
restaurant in hotel 0.354 0.48 0 1
BUSINESS free Internet (lobby) 0.709 0.46 0 1
Internet (room) 0.511 0.50 0 1
business center 0.453 0.50 0 1
LEISURE pool 0.731 0.44 0 1
fitness center 0.610 0.49 0 1
tennis court 0.117 0.32 0 1
golf 0.251 0.43 0 1
jacuzzi 0.139 0.35 0 1
SPATIAL VARIABLES
Tourism region Blue Ridge Highlands 0.009 0.09 0 1
Heart of Appalachia 0.117 0.32 0 1
Shenandoah Valley 0.211 0.41 0 1
Central Virginia 0.247 0.43 0 1
Northern Virginia 0.256 0.44 0 1
Chesapeake Bay 0.004 0.07 0 1
Hampton Region 0.130 0.34 0 1
Eastern Shore 0.027 0.16 0 1
Table 2 (cont’d.)
Category Variable Mean Std. Dev. Min. Max.
SPATIAL VARIABLES
Within 20 miles of ... Washington, D.C. 0.166 0.37 0 1
Richmond 0.152 0.36 0 1
Appalachian Trail 0.417 0.49 0 1
Public Beach 0.215 0.41 0 1
Located in a census urban area 0.807 0.40 0 1
aInformation on green certification is from the
VDEQ green lodging program (http://www.deq.virginia.gov/p2/virginiagreen). In-formation on hotel room rates and all other amenities come from the “Hotel-Guides” search engine accessed during July 2008 (http://hotel-guides.us/virginia/va-hotels.html).
rate increased by 14 percent between July 2008 and September 2009.9 Meanwhile, relative prices were fairly stable. The average price change for the cheapest quartile of hotels (+ 14.2 percent) was only slightly larger than for the most expen-sive quartile (+ 13.4 percent). The stability in relative prices over this short period is consistent with the standard depiction of equilibrium in the empirical hedonic literature, and the increase in the average price is consistent with our main-tained assumption that market transactions were occurring at the room rates posted during the summer of 2008.10
The second empirical modeling issue is the need to select a parametric form for the hedonic price function. The difficulty is that the true shape of the price function is unknown and estimates for implicit prices will be conditioned on our as-sumption about its parametric form. While theory suggests the price function is generally nonlinear (Ekeland, Heckman, and Nesheim 2004), most em-pirical hedonic studies use a specification that is linear in parameters. This follows from Cropper, Deck, and McConnell’s (1988) Monte Carlo
9
This comparison is based on 191 of the 223 hotels that reported rates for both periods. Specifically, the comparison is between rates posted in July 2008 for reservations in early September 2008 and rates posted in September 2009 for reservations in mid October 2009. As a robustness check, we also collected data on reservations for mid Janu-ary 2010. Rates were virtually unchanged from October 2009 (less than one-tenth of one percent higher). We thank an anonymous referee for suggesting the idea of examining changes in pricing behavior over time.
10 While Rosen’s (1974) theoretical model depicts equilibrium at a
single point in time, it is common in the empirical literature to use in-tercept shifters to control for changes in the price of the composite good, holding the relative implicit prices of its characteristics fixed. See Palmquist (2005) for a discussion.
sis of how the accuracy in predicting MWTP
varies across competing functional form assump-tions. They find that simpler parametric specifi-cations for the price function—linear, log-linear, log-log, and linear Box-Cox—outperform more flexible specifications in the presence of omitted variables. Therefore, adopting one of these sim-pler functional forms can help to hedge against the risk of omitted variable bias. Given the di-chotomous nature of almost all the potential inde-pendent variables in Table 2, the linear and log-linear functional forms seem most appropriate for our study. Yet there is no a priori rationale for choosing between these two functional forms. Therefore, it seems prudent to estimate the model both ways.
The final modeling issue is that it is difficult to determine which hotel characteristics should enter the equilibrium price function. Omitting hotel characteristics that travelers care about may bias estimates for the marginal implicit price of g if the omitted characteristics are correlated with g or with any other independent variables. On the other hand, including characteristics in the model that do not affect travelers’ choice process can re-duce the efficiency of the estimator, artificially inflating the standard errors on g and the other independent variables. This is a general problem that applies widely within hedonic modeling and elsewhere in applied econometrics, and is of par-ticular concern when the sample size is relatively small, as in the current application.11
11
It seems likely that the hedonic price function should include measures of overall service and quality such as the facility’s star rating and at least a subset of the on-site amenities it provides, such as Internet access for business travelers and opportunities for leisure. It is less clear whether room rates should depend on features of the fa-cility that seem unlikely to affect the marginal cost of service, such as the presence of a conven-tion center or a restaurant in the hotel. It is also unclear whether travelers actually consider all of the variables in our data when they choose where to stay. Green-certified hotels typically display the Virginia Green seal prominently on their main webpage, but one often has to delve more deeply to learn about many of the other amenities listed in Table 2. Recent evidence suggests that con-sumers may not seek out information on all of the characteristics of a differentiated product, even when making major purchases. For example, Pope (2008) finds that while homeowners are willing to pay a substantial premium to avoid living in an airport noise zone, many homebuyers appear to be unaware of whether their home is located inside a noise zone at the time of pur-chase. It seems reasonable to expect similar be-havior in the hotel industry; that is, at least some travelers are probably uninformed about some hotel amenities. Thus, it would be prudent to es-timate a variety of specifications for the price function, using different combinations of covari-ates, and then report the sensitivity of estimates for the green lodging price premium to the choice of covariates.
With two potential choices for the shape of the price function (linear, log-linear), and 24 poten-tial independent variables that could be included or excluded from the model (assuming that the “basic” variables in Table 2 are always included), there are over 33 million possible specifications for the estimating equation.12 While the
dimen-sions of an empirical hedonic specification search cluded, and i is the number that are actually included. Inclusion of all the tourism region indicator variables is treated as a single modeling choice.
are rarely defined in such explicit terms, the problem itself is quite common. The standard ap-proach is to perform an ad hoc specification search that involves estimating a manageable number of models that seem intuitively plausible and then reporting an even smaller subset of the results in published research. This highly selec-tive approach to reporting the results from a specification search has two disadvantages. It can omit potentially useful information and, more importantly, it can invalidate the statistical prop-erties of the research design (Leamer 1983). A more satisfying approach would be to find a con-cise way to report the robustness of results to a broad class of plausible specifications. This can be done using meta-analysis.
Using Meta-Analysis to Decompose the Identification of Price Premia
Since the pioneering studies by Smith and Kaoru (1990) and Walsh, Johnson, and McKean (1989), meta-analysis has been widely used in environ-mental economics to summarize the empirical evi-dence on important problems and to conduct benefit transfers. Meta-analysis can provide a simple and informative way to summarize results across a large number of distinct studies that in-vestigate a common problem. This has been the primary use of the method over the past twenty years (Nelson and Kennedy 2009). Recently, Banzhaf and Smith (2007) proposed a second role for meta-analysis. It can also be used in the con-text of a single study to investigate how the re-searchers’ subjective modeling decisions influ-ence their economic predictions. Since the objec-tive is to explain systematic variation in the re-sults within a single study, Banzhaf and Smith dub their approach “internal” meta-analysis.13 An internal meta-analysis begins by estimating a large number of plausible econometric specifi-cations for the same underlying model. The set of specifications can be defined systematically using all possible permutations of modeling choices made along a small number of predefined dimen-sions, as in Banzhaf and Smith (2007). Or the set
13
of specifications can be randomly chosen within predefined bounds on a large number of dimen-sions, as in our subsequent analysis. In either case, each candidate specification for the true model is defined by a set of indicator variables describing its econometric features (such as func-tional form, the set of regressors, and the defini-tion for the choice set) and by a set of variables describing economic outcomes (such as statistical significance of key parameters, elasticities, or welfare measures). Regressing economic outcomes on indicator variables for features of the econo-metric specification can help to summarize the ways in which the researchers’ subjective model-ing decisions influence their findmodel-ings.
There are at least three reasons why an internal meta-analysis can be especially valuable in the context of a new application such as green lodg-ing. First, the lack of prior evidence on economet-ric specification underscores the importance of performing a specification search. The specifica-tion-generating process used to create the data for the meta-analysis can be designed to address Leamer’s (1983) concern about the ad hoc nature of conventional specification searches. Second, a single table of meta-regression coefficients can be used to synthesize the key results from a compre-hensive sensitivity analysis that would take far too much space to include in a journal article or even a supplemental appendix. The comprehen-sive nature of this approach can provide strong evidence on the robustness of a key result or re-veal its fragility. Third, by identifying which sub-jective modeling decisions make the largest con-tributions to economic outcomes, an internal meta-analysis can reveal the modeling issues that are most deserving of attention in future research.
Baseline Econometric Results
We begin by presenting the results from estima-tion of a simple linear hedonic price funcestima-tion. These results serve as a baseline for comparison to the subsequent meta-analysis. Equation (5) dis-plays the general specification.
The dependent variable (Pj) denotes the minimum price for a standard room at hotel j, independent variables for “green,” “rooms,” and “floors” rep-resent scalars, and all other independent variables represent vectors of variables from the corre-sponding categories in Table 2, except for spacej, which represents a vector of the following spatial variables: (i) fixed effects for tourism regions, (ii) a fixed effect for hotels located within Census-defined urban areas, (iii) fixed effects for hotels located within 20 miles of Washington, D.C., Richmond, a public beach, and the Appalachian Trail, and (iv) interactions between the “20-mile” fixed effects and the linear distance to each amenity. The “20-mile” fixed effects measure the price differential associated with being located “near” a specific amenity—i.e., within a short drive. The interactions measure the continuous variation in the price differential that occurs as we move closer to the amenity, within the 20-mile zone of proximity.
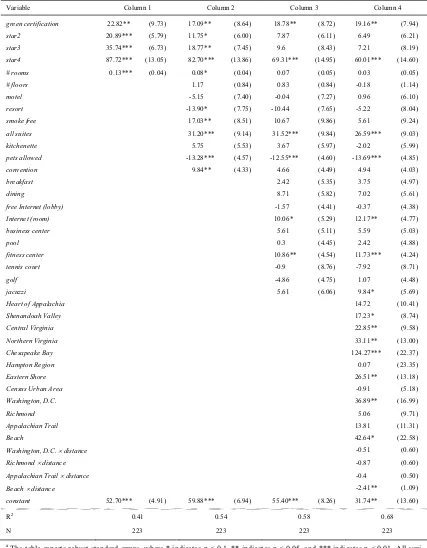
Table 3. Coefficients (std. errors) for Models of Hotel Room Pricinga
Variable Column 1 Column 2 Column 3 Column 4
green certification 22.82** (9.73) 17.09** (8.64) 18.78** (8.72) 19.16** (7.94)
star2 20.89*** (5.79) 11.75* (6.00) 7.87 (6.11) 6.49 (6.21)
star3 35.74*** (6.73) 18.77** (7.45) 9.6 (8.43) 7.21 (8.19)
star4 87.72*** (13.05) 82.70*** (13.86) 69.31*** (14.95) 60.01*** (14.60)
# rooms 0.13*** (0.04) 0.08* (0.04) 0.07 (0.05) 0.03 (0.05)
# floors 1.17 (0.84) 0.83 (0.84) -0.18 (1.14)
motel -5.15 (7.40) -0.04 (7.27) 0.96 (6.10)
resort -13.90* (7.75) -10.44 (7.65) -5.22 (8.04)
smoke free 17.03** (8.51) 10.67 (9.86) 5.61 (9.24)
all suites 31.20*** (9.14) 31.52*** (9.84) 26.59*** (9.03)
kitchenette 5.75 (5.53) 3.67 (5.97) -2.02 (5.99)
pets allowed -13.28*** (4.57) -12.55*** (4.60) -13.69*** (4.85)
convention 9.84** (4.33) 4.66 (4.49) 4.94 (4.03)
breakfast 2.42 (5.35) 3.75 (4.97)
dining 8.71 (5.82) 7.02 (5.61)
free Internet (lobby) -1.57 (4.41) -0.37 (4.38)
Internet (room) 10.06* (5.29) 12.17** (4.77)
business center 5.61 (5.11) 5.59 (5.03)
pool 0.3 (4.45) 2.42 (4.88)
fitness center 10.86** (4.54) 11.73*** (4.24)
tennis court -0.9 (8.76) -7.92 (8.71)
golf -4.86 (4.75) 1.07 (4.48)
jacuzzi 5.61 (6.06) 9.84* (5.69)
Heart of Appalachia 14.72 (10.41)
Shenandoah Valley 17.23* (8.74)
Central Virginia 22.85** (9.58)
Northern Virginia 33.11** (13.00)
Chesapeake Bay 124.27*** (22.37)
Hampton Region 0.07 (23.35)
Eastern Shore 26.51** (13.18)
Census Urban Area -0.91 (5.18)
Washington, D.C. 36.89** (16.99)
Richmond 5.06 (9.71)
Appalachian Trail 13.81 (11.31)
Beach 42.64* (22.58)
Washington, D.C. u distance -0.51 (0.60)
Richmond u distance -0.87 (0.60)
Appalachian Trail u distance -0.4 (0.50)
Beach u distance -2.41** (1.09)
constant 52.70*** (4.91) 59.88*** (6.94) 55.40*** (8.26) 31.74** (13.60)
R2
0.41 0.54 0.58 0.68
N 223 223 223 223
aThe table reports robust standard errors, where * indicates p < 0.1, ** indicates p < 0.05, and *** indicates p < 0.01. All
hotel related to dining, business, and leisure. Fi-nally, column 4 adds spatial variables. Even after controlling for the average price differentials as-sociated with the tourism regions, we find that room rates are significantly higher for hotels lo-cated within 20 miles of Washington, D.C. ($36.89) and for hotels located within 20 miles of a beach ($42.64). While the interaction terms all have the expected negative signs, the only one that is statistically different from zero is the coef-ficient on distance to a public beach. Its coeffi-cient indicates that, all else constant, moving 1,000 meters (0.62 miles) closer to a public beach increases the minimum room rate by $2.41 within the 20-mile zone of proximity. Including all of the covariates in the model increases the coeffi-cient of variation substantially (R2 = 0.68) com-pared to the parsimonious specification in column 1 (R2 = 0.41).
Overall, the regression results appear to make intuitive sense. As we move from left to right in the table, the coefficients on the indicator vari-ables for star rating decline in magnitude and in statistical significance. This reflects the correla-tion between star rating and linear combinacorrela-tions of the facility, dining, business, and leisure op-portunities provided by the hotel. In other words, the star ratings largely reflect differences in these amenities. The most general specification in col-umn 4 implies that travelers are willing to pay a substantial premium to stay in a suite ($26.59), to avoid staying in a hotel that allows pets ($13.69), to have access to a fitness center ($11.73), and to obtain 4-star service ($60.01). Travelers are also willing to pay more for Internet access in their rooms ($12.17), but not for Internet access in the lobby.
Based solely on the results in Table 3, we would conclude that travelers are willing to pay a premium of between $17.09 and $22.82 to stay in certified “Virginia Green” hotels relative to Vir-ginia hotels without certification. However, this conclusion is conditioned by our subjective deci-sions about the econometric features of the model.
Internal Meta-Analysis of the Econometric Specification
To generate the data for our internal meta-analy-sis, we ran 40,000 regressions based on two gen-eral specifications for the parametric form of the
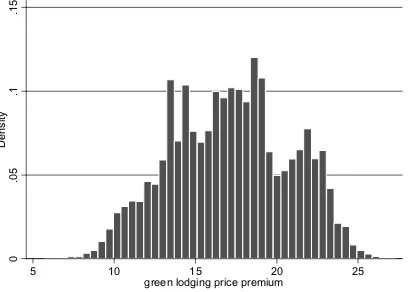
equilibrium hedonic price function. The specifi-cations differ in whether they define the depend-ant variable as Pj or log (Pj). For each specifica-tion, we ran 10,000 regressions using different combinations of covariates. Every specification included the “basic” group of hotel characteristics (green certification, star rating, and number of rooms). The specifications differed in which of the remaining 18 hotel characteristics were in-cluded in the set of covariates. On each of the 10,000 individual replications, we used random draws from a uniform distribution to select be-tween 1 and 18 of these characteristics to serve as regressors. Finally, the entire process was re-peated with and without the spatial variables. After estimating each of the 40,000 randomly chosen models, we saved the OLS point estimate for the green lodging price premium, the p-value from a test of whether the point estimate is statis-tically different from zero, and dummy variables for each modeling decision.14 These summary sta-tistics serve as the data for our meta-analysis. Figure 3 illustrates the distribution of 40,000 estimates for the green lodging price premium. The estimates range from $5.72 to $27.29, with a mean of $17.16. Table 4 presents the results from our meta-analysis based on this distribution. Col-umn 1 reports the results from an OLS regression of the green lodging price premium on indicator variables for econometric modeling choices:
(6) wi D O× covariatesi Q× depvari Si.
In the equation, wi represents our point estimate for the price premium from model i,covariatesi is a vector of dummy variables indicating whether each covariate was included in the model, and
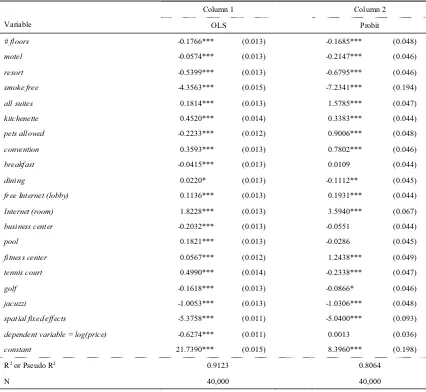
depvari is an indicator variable for whether the dependent variable was measured in levels or logs. TheR2 of 0.9123 indicates that almost all of the variation in our point estimates for the price premium can be explained by the econometric features of the model.15 The constant ($21.74) defines our prediction for the green lodging price
14
The premium in the logarithmic model is adjusted using the Hal-vorsen-Palmquist (1980) correction.
15 As a second measure of goodness of fit, notice that the results in
0
.0
5
.1
.1
5
D
e
n
s
it
y
5 10 15 20 25
green lodging price premium
Figure 3. Distribution of Estimates for the Green Lodging Price Premium
Note: This figure displays the distribution of 40,000 estimates for the green lodging price premium used in the internal meta-analysis.
premium when only the basic variables are in-cluded in the model (star rating and number of rooms). All of the other coefficients describe how each modeling decision tends to influence our estimates. For example, all else constant, includ-ing an indicator variable for whether all the rooms in the hotel are suites (all suites) leads to a small (18 cents) increase in our estimate for the price premium.
There are two conclusions to be drawn from column 1. First, our initial finding of a positive price premium in the simple linear model is quite robust to the definition for the dependent variable and our choice of covariates. Any combination of econometric modeling choices will lead us to pre-dict a positive price premium. If we exclude all of the variables that tend to increase our estimates for the price premium (i.e., those with positive coefficients), we would still predict a premium of $8.97. That said, our second conclusion is that the
magnitude of the predicted price premium is quite sensitive to the econometric features of the model. There is one hotel characteristic that has a sub-stantial negative effect on our estimate for the price premium: whether the hotel is smoke-free (-$4.36). Four other characteristics collectively decrease the price premium by another two dol-lars (resort, jacuzzi, pets allowed, and business center). The spatial variables are quite important. Including them in the model tends to decrease our prediction for the price premium by $5.38. Our decision about how to define the dependent vari-able also contributes to the magnitude of our econometric estimates. Measuring the dependent variable in logs decreases the point estimate by $0.63.
Table 4. Meta-Analysis of Alternative Model Specificationsa
Column 1 Column 2
Variable OLS Probit
# floors -0.1766*** (0.013) -0.1685*** (0.048)
motel -0.0574*** (0.013) -0.2147*** (0.046)
resort -0.5399*** (0.013) -0.6795*** (0.046)
smoke free -4.3563*** (0.015) -7.2341*** (0.194)
all suites 0.1814*** (0.013) 1.5785*** (0.047)
kitchenette 0.4520*** (0.014) 0.3383*** (0.044)
pets allowed -0.2233*** (0.012) 0.9006*** (0.048)
convention 0.3593*** (0.013) 0.7802*** (0.046)
breakfast -0.0415*** (0.013) 0.0109 (0.044)
dining 0.0220* (0.013) -0.1112** (0.045)
free Internet (lobby) 0.1136*** (0.013) 0.1931*** (0.044)
Internet (room) 1.8228*** (0.013) 3.5940*** (0.067)
business center -0.2032*** (0.013) -0.0551 (0.044)
pool 0.1821*** (0.013) -0.0286 (0.045)
fitness center 0.0567*** (0.012) 1.2438*** (0.049)
tennis court 0.4990*** (0.014) -0.2338*** (0.047)
golf -0.1618*** (0.013) -0.0866* (0.046)
jacuzzi -1.0053*** (0.013) -1.0306*** (0.048)
spatial fixed effects -5.3758*** (0.011) -5.0400*** (0.093)
dependent variable = log(price) -0.6274*** (0.011) 0.0013 (0.036)
constant 21.7390*** (0.015) 8.3960*** (0.198)
R2 or Pseudo R2 0.9123 0.8064
N 40,000 40,000
aThe table reports robust standard errors, where * indicates p < 0.1, ** indicates p < 0.05, and *** indicates p < 0.01. All 40,000
regressions included the “basic” set of covariates (green certification, star rating dummies, and the number of rooms).
reports the results from a probit model where the dependent variable is set to equal 1 if and only if the green lodging price premium is positive and
statistically different from zero at the 90 percent level. Since all of the covariates are indicator variables, their coefficients are directly compara-ble. Thus, the probit results indicate that the two most important modeling decisions are whether to include the spatial variables and the dummy vari-able for whether the hotel is entirely smoke-free. While we are agnostic about the inclusion of the
smoke free dummy, we feel strongly that the spa-tial variables are necessary to help control for local attractions that may lead to higher prices in resort areas or near major cities.
price premium for green hotels is very robust to alternative specifications for the hedonic price function. We interpret this as strong revealed pre-ference evidence that consumers are willing to pay a premium for green lodging.
Conclusions
Ten of the twelve state programs for certifying green hotels were established between 2004 and 2008, and trends in Internet traffic during this period suggest that prospective travelers have shown a growing interest in opportunities for green travel. Using data from a cross-section of green and brown hotels in Virginia, we have demonstrated that travelers can expect to pay a price premium for a standard room in a green hotel. Our point estimate for the size of this pre-mium ranges from $8.97 to $25.43. This range does not reflect a confidence interval on a single point estimate. It reflects upper and lower bounds on our prediction for the price premium based on an internal meta-analysis of 40,000 possible econometric specifications for the hedonic price function. In other words, rather than report a sin-gle point estimate that is conditioned by our (un-tested) assumptions about the shape of the price function, we have reported a range of estimates that reflects our uncertainty about the true shape of the equilibrium price function and our uncer-tainty about which other hotel amenities would be capitalized into equilibrium prices. While this approach reveals our uncertainty about the exact magnitude of the price premium, the positive lower bound on the resulting range of estimates increases our confidence that a premium for green lodging does, in fact, exist.
In principle, one could develop a more precise point estimate for the price premium by exploit-ing the continuexploit-ing certification process as an in-strumental variable. In other words, one could collect data on room rates for individual hotels before and after they receive certification and then use a first-differenced regression to estimate the rate at which green certification is capitalized into hotel room prices. This approach would par-allel the discontinuity designs that have become increasingly popular in the hedonic literature on the capitalization of amenities into residential property values (e.g., Pope 2008, Greenstone and Gayer 2009). It would also purge time-constant
characteristics. Since the green certification proc-ess is unlikely to affect other hotel amenities, these amenities would drop out of the model, de-creasing the dimensionality of subjective model-ing choices to be evaluated through meta-analy-sis. This could increase the precision of econo-metric estimates for the green lodging price pre-mium.
Another direction for future research would be to survey the travelers who visit green hotels to learn about their personal characteristics and their behavior in other markets. Kahn (2007) finds that registered voters of the Green Party tend to put their money where their mouth is when it comes to long-term decisions such as where to live, what type of car to drive, and whether to commute by public transportation. The market for green lodg-ing offers a window into the short-term decisions of consumers. Are the travelers who visit green hotels doing so because it is consistent with the rest of their lifestyle? Or are these travelers taking a vacation from a lifestyle that is less environ-mentally oriented? The answers to these ques-tions could help to clarify the relaques-tionship be-tween individual consumption of durable and non-durable green goods.
References
Banzhaf, S.H., and V.K. Smith. 2007. “Meta Analysis in Model Implementation: Choice Sets and the Valuation of Air Quality Improvements.” Journal of Applied Economet-rics 22(6): 1013–1031.
Butler, J. 2008. “The Compelling ‘Hard Case’ for ‘Green’ Hotel Development.” Cornell Hospitality Quarterly 49(3): 234–244.
Choi, H., and H.R. Varian. 2009. “Predicting the Present with Google Trends.” Google research paper. Available at http:// google.com/googleblogs/pdfs/google_predicting_the_prese nt.pdf (accessed December 15, 2009).
Cropper, M.L., L.B. Deck, and K.E. McConnell. 1988. “On the Choice of Functional Form for Hedonic Price Func-tions.” Review of Economics and Statistics 70(4): 668–675. Dalton, G.J., D.A. Lockington, and T.E. Baldock. 2008. “A
Survey of Tourist Attitudes to Renewable Energy Supply in Australian Hotel Accommodation.” Renewable Energy
33(10): 2174–2185.
Dechert LLP. 2008. “2008 Dechert LLP Annual Report on Trends in Trademarks.” Dechert LLP, New York, NY. Ekeland, I., J.J. Heckman, and L. Nesheim. 2004.
“Identifica-tion and Estima“Identifica-tion of Hedonic Models.” Journal of Politi-cal Economy 112(1): S60–S109.
D.C.
Geoghegan, J., L. Lynch, and S. Bucholtz. 2003. “Capitaliza-tion of Open Spaces into Housing Values and the Residen-tial Property Tax Revenue Impacts of Agricultural Ease-ment Programs.” Agricultural and Resource Economics Re-view 32(1): 33–45.
Gibbs, J.P., J.M. Halstead, K.J. Boyle, and J. Huang. 2002. “An Hedonic Analysis of the Effects of Lake Water Clarity on New Hampshire Lakefront Properties.” Agricultural and Resource Economics Review 31(1): 39–46.
Greene, W.H. 2000. Econometric Analysis (4th edition). Up-per Saddle River, NJ: Prentice Hall.
Greenstone, M., and T. Gayer. 2009. “Quasi-Experimental and Experimental Approaches to Environmental Economics.”
Journal of Environmental Economics and Management
57(1): 21–44.
Halvorsen, R., and R.B. Palmquist. 1980. “The Interpretation of Dummy Variables in Semilogarithmic Equations.” Ameri-can Economic Review 70(3): 474–475.
Holmes, T.P., E.A. Murphy, and K.P. Bell. 2006. “Exotic Forest Insects and Residential Property Values.” Agricul-tural and Resource Economics Review 35(1): 155–166. Johnston, R.J., C.R. Wessells, H. Donath, and F. Asche. 2001.
“Measuring Consumer Preferences for Ecolabeled Seafood: An International Comparison.” Journal of Agricultural and Resource Economics 26(1): 20–39.
Kahn, M.E. 2007. “Do Greens Drive Hummers or Hybrids? Environmental Ideology as a Determinant of Consumer Choice.” Journal of Environmental Economics and Man-agement 54(2): 129–145.
Kiel, K., and M. Williams. 2007. “The Impact of Superfund Sites on Local Property Values: Are All Sites the Same?”
Journal of Urban Economics 61(1): 170–192.
Kiel, K., and J. Zabel. 1999. “The Accuracy of Owner-Pro-vided House Values: The 1978–1991 American Housing Survey.”Real Estate Economics 27(2): 263–296.
Kotchen, M.J., and M.R. Moore. 2007. “Private Provision of Environmental Public Goods: Household Participation in Green-Electricity Programs.” Journal of Environmental Economics and Management 53(1): 1–16.
Kuminoff, N.V. 2009. “Decomposing the Structural Identifi-cation of Nonmarket Values.” Journal of Environmental Economics and Management 57(2): 123–139.
Leamer, E.E. 1983. “Let’s Take the Con Out of Economet-rics.”American Economic Review 73(1): 31–43.
Loureiro, M.L., and J. Lotade. 2005. “Do Fair Trade and Eco-Labels in Coffee Wake Up the Consumer Conscience?”
Ecological Economics 53(1): 129–138.
Lovitt, R. 2009. “Eclectic Accommodations for Eco-Travel-ers.” MSNBC (April 14). Available at http://www.msnbc. msn.com/id/30195754/ (accessed January 30, 2010). Messer, K.D., W.D. Schultz, K.F. Hackett, T.A. Cameron, and
G.H. McClelland. 2006. “Can Stigma Explain Large Prop-erty Value Losses? The Psychology and Economics of Superfund.” Environmental and Resource Economics 33(3): 299–324.
Mollard, A., T. Rambonilaza, and D. Vollet. 2007. “Environ-mental Amenities and Territorial Anchorage in the Recrea-tional-Housing Rental Market: A Hedonic Approach with French Data.” Land Use Policy 24(2): 484–493.
Nelson, J.P., and P.E. Kennedy. 2009. “The Use (and Abuse) of Meta-Analysis in Environmental and Natural Resource Economics: An Assessment.” Environmental and Resource Economics 42(3): 345–377.
Nimon, W., and J. Beghin. 1999. “Are Eco-Labels Valuable? Evidence from the Apparel Industry.” American Journal of Agricultural Economics 81(4): 801–811.
Palmquist, R.B. 2005. “Property Value Models.” In K.-G. Mäler and J. Vincent, eds., Handbook of Environmental Economics (Vol. 2). Amsterdam: North Holland Press. Patkose, M., T.T. Burnett, and S.D. Cook. 2007. “Domestic
Travel Market Report.” Travel Industry Association, Washington, D.C.
Pope, J.C. 2008. “Buyer Information and the Hedonic: The Impact of a Seller Disclosure on the Implicit Price for Air-port Noise.” Journal of Urban Economics 63(2): 498–516. Rosen, S. 1974. “Hedonic Prices and Implicit Markets:
Prod-uct Differentiation in Pure Competition.” Journal of Politi-cal Economy 82(1): 34–55.
Smith, V.K., and Y. Kaoru. 1990. “Signals or Noise? Explain-ing the Variation in Recreation Benefit Estimates.” Ameri-can Journal of Agricultural Economics 72(2): 419–433. Spilanis, I., and H. Vayanni. 2004. “Sustainable Tourism:
Utopia or Necessity? The Role of New Forms of Tourism in the Aegean Islands.” In B. Bramwell, ed., Coastal Mass Tourism: Diversification and Sustainable Development in Southern Europe. Clevedon, UK: Channel View Publica-tions.
Taylor, L.O., and V.K. Smith. 2000. “Environmental Ameni-ties as a Source of Market Power.” Land Economics 76(4): 550–568.