Manajemen dan Rekayasa Struktur C-47
NUMERICAL STUDY OF CARBONATION DEPTH DETECTION OF
CONCRETE DAMAGED FROM ULTRASONIC AXYSIMMETRIC
LOADING USING REFLECTIVE WAVES
IFTA MINKA1,2, TA-PENG CHANG2, DATA IRANATA1
1
Department of Civil Engineering, Institut Teknologi Sepuluh Nopember (ITS), Surabaya, Indonesia, 60111
2
Department of Construction Engineering, National Taiwan University of Science and Technology (NTUST), Taipei, Taiwan, 106
Abstract- Concrete exposed to environment, such as urban and industrial site, were easily
attacked by either aggressive agents or reactive agents. One of the major and unavoidable
concrete deterioration was carbonation. Generally, carbonation depth detection was
measured using chemical phenolphthalein solutions 1%. However, from the previous
experiment conducted by Y. Lo and H. M. Lee (2001), it was known that phenolphthalein
could not give the significant result again.
In this investigation, the numerical analysis conducted using the commercial finite element
software LS-DYNA 970. It is used to simulate the 2-D plate 100 x 200 mm with difference
acoustic impedance (Z) subjected to ultrasonic axysimmetric loading. The signal resulted
from numerical simulations were analyzed using reflective waves. Reflective waves as a
filter to measure the depth of concrete carbonation damaged.
Numerical results show that accuracy of depth detection depends on the impedance (Z)
value of material. Measurement of carbonation depth could be detected with accuracy
under 3%.
Keywords-numerical, carbonation depth, ultrasonic, reflective waves
1. INTRODUCTION
Concrete as a widely used material for
construction must resist from some aggressive
agents or reactive agents. Carbonation of
concrete is one type of concrete deteriorations
which are able to deliver corrosion of
reinforced bars and change the characteristic
Manajemen dan Rekayasa Struktur C-48
traditional detection method of concrete
carbonation was conducted by traditional
measurement using phenolphthalein 1%
solution. From the previous research
conducted by Y. Lo and H. M. Lee (2001) [1],
it was known that the phenolphthalein test did
not indicate a significant result. Moreover, the
carbonation detection using phenolphthalein is
not an in-situ carbonation detection method.
Ultrasonic wave propagation is one of
non-destructive method for concrete damaged
detection. Reflection wave method is one of
ultrasonic method that usually been used as a
tool to identify and detect the thickness/depth
of concrete cracks [2, 3]. Therefore, in this
study, reflection method will be used to
identify the depth/thickness of carbonation
damaged of concrete.
2. METHODOLOGY
Numerical simulation is conducted using
commercial finite element software LS-DYNA
970. Geometry of finite element model is a
concrete element of 100 mm height 200
mm length. It is used to simulate the
carbonation condition of concrete subjected to
ultrasonic loading using 2-D axysimmetric
elements. The element mesh size is 0.0625
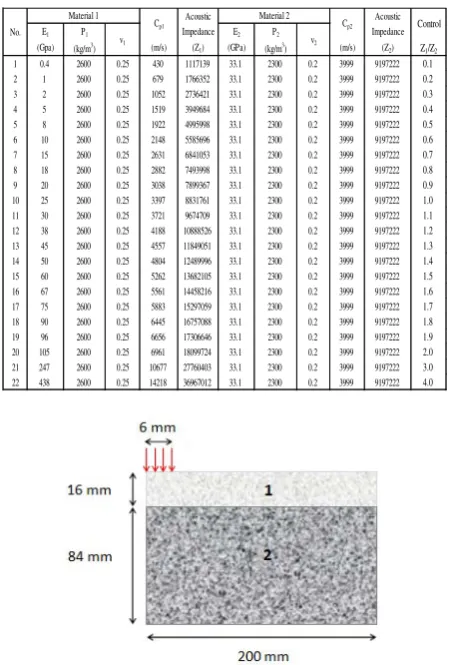
0.0625 mm. The material properties
including Young’s Modulus (E), density (ρ) and Poisson’s ratio (ν) of concrete are
presented in Table 1. Hence, simulation model
is presented in Figure 1.
Table 1 Material properties of simulation model
Acoustic Acoustic
E1 P1 Impedance E2 P2 Impedance
(Gpa) (kg/m3) (m/s) (Z
1) (GPa) (kg/m3) (m/s) (Z2) Z1/Z2
1 0.4 2600 0.25 430 1117139 33.1 2300 0.2 3999 9197222 0.1
2 1 2600 0.25 679 1766352 33.1 2300 0.2 3999 9197222 0.2
3 2 2600 0.25 1052 2736421 33.1 2300 0.2 3999 9197222 0.3
4 5 2600 0.25 1519 3949684 33.1 2300 0.2 3999 9197222 0.4
5 8 2600 0.25 1922 4995998 33.1 2300 0.2 3999 9197222 0.5
6 10 2600 0.25 2148 5585696 33.1 2300 0.2 3999 9197222 0.6
7 15 2600 0.25 2631 6841053 33.1 2300 0.2 3999 9197222 0.7
8 18 2600 0.25 2882 7493998 33.1 2300 0.2 3999 9197222 0.8
9 20 2600 0.25 3038 7899367 33.1 2300 0.2 3999 9197222 0.9
10 25 2600 0.25 3397 8831761 33.1 2300 0.2 3999 9197222 1.0
11 30 2600 0.25 3721 9674709 33.1 2300 0.2 3999 9197222 1.1
12 38 2600 0.25 4188 10888526 33.1 2300 0.2 3999 9197222 1.2
13 45 2600 0.25 4557 11849051 33.1 2300 0.2 3999 9197222 1.3
14 50 2600 0.25 4804 12489996 33.1 2300 0.2 3999 9197222 1.4
15 60 2600 0.25 5262 13682105 33.1 2300 0.2 3999 9197222 1.5
16 67 2600 0.25 5561 14458216 33.1 2300 0.2 3999 9197222 1.6
17 75 2600 0.25 5883 15297059 33.1 2300 0.2 3999 9197222 1.7
18 90 2600 0.25 6445 16757088 33.1 2300 0.2 3999 9197222 1.8
19 96 2600 0.25 6656 17306646 33.1 2300 0.2 3999 9197222 1.9
20 105 2600 0.25 6961 18099724 33.1 2300 0.2 3999 9197222 2.0
21 247 2600 0.25 10677 27760403 33.1 2300 0.2 3999 9197222 3.0
22 438 2600 0.25 14218 36967012 33.1 2300 0.2 3999 9197222 4.0
Control
Figure 1 Model of numerical simulation with the thickness of carbonation is 16 mm
The basic procedure of this research is
determining the depth (thickness) of
carbonation damaged from the ultrasonic
signals products.
The thickness was calculated using reflected
wave method based on the value of internal
P-wave velocity, Cp, as presented in the
following expression [4]:
(2-1)
where T is thickness (m), Cp is the P-wave
(m/s), t1 and t2 are the occurring times
correspond to the amplitude A1 and A2,
Manajemen dan Rekayasa Struktur C-49
travels was obtained using similar equation as
(2-1), presented in the following equation:
(2-2)
Figure 2 Time travels from first layer and second layer of carbonated concrete
Figure 2 above shows that t1 and t2 are time
traveling at first layer, while t3 is time
traveling at second layer.
3. RESULTS
Numerical simulations using ultrasonic
loading were conducted on carbonated and
un-carbonated concrete model to obtain
signals and carbonation damage (i.e. thickness)
of concrete. Figure 3 shows the signals output
from LS DYNA. Detection of carbonation
thickness was shown in Table 2.
0 1E-005 2E-005 3E-005 4E-005
Time (s)
(a) Results of numerical simulation with Z1/Z2
0 1E-005 2E-005 3E-005 4E-005
Time (s)
(b) Results of numerical simulation with Z1/Z2
0 1E-005 2E-005 3E-005 4E-005
Time (s)
(c) Results of numerical simulation with Z1/Z2
0 1E-005 2E-005 3E-005 4E-005
Time (s)
(d) Results of numerical simulation with Z1/Z2
0 1E-005 2E-005 3E-005 4E-005
Manajemen dan Rekayasa Struktur C-50
0 1E-005 2E-005 3E-005 4E-005
Time (s)
(f) Results of numerical simulation with Z1/Z2
0 1E-005 2E-005 3E-005 4E-005
Time (s)
(g) Results of numerical simulation with Z1/Z2
0 1E-005 2E-005 3E-005 4E-005
Time (s)
(h) Results of numerical simulation with Z1/Z2
0 1E-005 2E-005 3E-005 4E-005
Time (s)
(i) Results of numerical simulation with Z1/Z2
0 1E-005 2E-005 3E-005 4E-005
Time (s)
(j) Results of numerical simulation with Z1/Z2
0 1E-005 2E-005 3E-005 4E-005
Time (s)
(k) Results of numerical simulation with Z1/Z2
0 1E-005 2E-005 3E-005 4E-005
Time (s)
(l) Results of numerical simulation with Z1/Z2
Manajemen dan Rekayasa Struktur C-51
0 1E-005 2E-005 3E-005 4E-005
Time (s)
(n) Results of numerical simulation with Z1/Z2
0 1E-005 2E-005 3E-005 4E-005 Time (s)
(o) Results of numerical simulation with Z1/Z2
0 1E-005 2E-005 3E-005 4E-005
Time (s)
(p) Results of numerical simulation with Z1/Z2
0 1E-005 2E-005 3E-005 4E-005
Time (s)
(q) Results of numerical simulation with Z1/Z2
0 1E-005 2E-005 3E-005 4E-005 Time (s)
(r) Results of numerical simulation with Z1/Z2
0 1E-005 2E-005 3E-005 4E-005 Time (s)
(s) Results of numerical simulation with Z1/Z2
0 1E-005 2E-005 3E-005 4E-005 Time (s)
(t) Results of numerical simulation with Z1/Z2
Manajemen dan Rekayasa Struktur C-52
0 1E-005 2E-005 3E-005 4E-005 Time (s)
(v) Results of numerical simulation with Z1/Z2
Figure 3 Results of numerical simulation from LS-DYNA
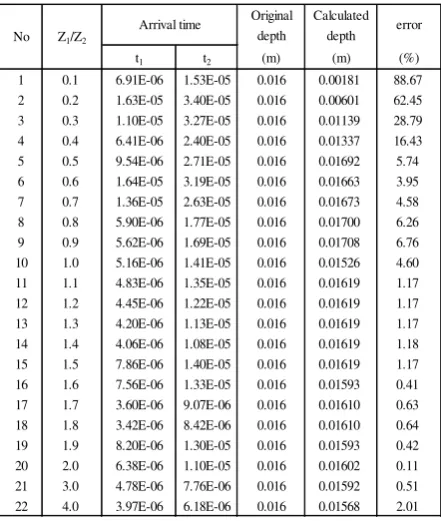
Table 2 Results of carbonation depth detection using reflected wave theory
= 4.0
Original Calculated depth depth t1 t2 (m) (m) (%) 1 0.1 6.91E-06 1.53E-05 0.016 0.00181 88.67 2 0.2 1.63E-05 3.40E-05 0.016 0.00601 62.45 3 0.3 1.10E-05 3.27E-05 0.016 0.01139 28.79 4 0.4 6.41E-06 2.40E-05 0.016 0.01337 16.43 5 0.5 9.54E-06 2.71E-05 0.016 0.01692 5.74 6 0.6 1.64E-05 3.19E-05 0.016 0.01663 3.95 7 0.7 1.36E-05 2.63E-05 0.016 0.01673 4.58 8 0.8 5.90E-06 1.77E-05 0.016 0.01700 6.26 9 0.9 5.62E-06 1.69E-05 0.016 0.01708 6.76 10 1.0 5.16E-06 1.41E-05 0.016 0.01526 4.60 11 1.1 4.83E-06 1.35E-05 0.016 0.01619 1.17 12 1.2 4.45E-06 1.22E-05 0.016 0.01619 1.17 13 1.3 4.20E-06 1.13E-05 0.016 0.01619 1.17 14 1.4 4.06E-06 1.08E-05 0.016 0.01619 1.18 15 1.5 7.86E-06 1.40E-05 0.016 0.01619 1.17 16 1.6 7.56E-06 1.33E-05 0.016 0.01593 0.41 17 1.7 3.60E-06 9.07E-06 0.016 0.01610 0.63 18 1.8 3.42E-06 8.42E-06 0.016 0.01610 0.64 19 1.9 8.20E-06 1.30E-05 0.016 0.01593 0.42 20 2.0 6.38E-06 1.10E-05 0.016 0.01602 0.11 21 3.0 4.78E-06 7.76E-06 0.016 0.01592 0.51 22 4.0 3.97E-06 6.18E-06 0.016 0.01568 2.01 No Z1/Z2 Arrival time error
4. DISCUSSIONS
Results of signal from numerical simulation
using ultrasonic loading could be seen in
Figure 4 and calculation of depth could be
seen in Table 2. Figure 4 showed the resulting
signal from different variations ratio of
acoustic impedance (Z). In the analysis of
depth detection, the highest first peak of each
resulting signal could be neglected, if
necessary. This condition is caused by that
peak did not contain any information of
reflected wave from surface that could be used
to detect the depth of carbonation damaged. In
reality, this peak comes from sensor that was
used along detection. Even in the geophysics
science, this highest first peak is a direct wave
which is come from geophone [5]. Therefore,
this peak could be neglected also in this
detection.
According to Table 2, it was known that
accurate detection could be obtained at
material with ratio of acoustic impedance
(Z1/Z2) higher than 1.1. Accurate detection in
this study is detection which has an error of
detection less than 3%. From Table 2, it was
shown that double layer of carbonation model
could be detected in the range of acoustic
impedance ratio (Z1/Z2) of 1.1 – 4.0. This
condition occurred because of acoustic
impedance has big influence on the reflection
and refraction/transmission of waveform. In
the acoustic impedance theory, if Z2 becomes
very smaller than Z1, Areflection approaches and
Arefraction/transmission approaches zero. It means
that the compressive wave and refraction will
not occur [4]. In other words, attenuation from
another signals occurred before the real
Manajemen dan Rekayasa Struktur C-53
5. CONCLUSIONS
1. Reflected wave theory could be applied to
identify the thickness/depth of concrete
damaged from ultrasonic testing with an
error of detection under 3%.
2. Detection of carbonation damaged using
reflected wave is accurate in material
with ratio of acoustic impedance (Z)
higher than 1.1.
REFERENCES
[1] Lo, Y., H. M. Lee (2001), Curing Effects
on Carbonation of Concrete Using a
Phenolphthalein Indicator and
Fourier-Transform Infrared Spectroscopy,
Journal of Building and Environment,
Pergamon.
[2] Morishige, H. and Tanaka, S (2004),
Non-Destructive Inspection of Concrete
Structures Using Ultrasonic Sensor, SICE
Annual Conference in Sapporo, Hokkaido
Institute of Technology, Japan.
[3] Islam, Muhammed Mazharul.
Yamamoto, Hiroya. Tanaka, Shogo,
(2006), Non-Destructive Inspection of
Multiple Concrete Cracks Using
Ultrasonic Sensor, SICE-ICASE
International Joint Conference, Bexco,
Busan, Korea, Oct. 18-21.
[4] Boggess, Albert, (2001),A First Course in
Wavelets with Fourier Analysis, New
Jersey, Prentice-Hall.
[5] Sansalone, M. J and Streett, W. B., (1997),
Impact Echo: Nondestructive Evaluation
of Concrete and Masonry, Ithaca, New