Saccharomyces C.
UTILIZATION OF SEED CORN WASTE FROM SEED CORN INDUSTRY INTO
BIOETHANOL
Ni Ketut Sari, K. Y. Dharmawan, A. Gitawati
Jurusan Teknik Kimia Fakultas Teknologi Industri UPN” Veteran “ Jatim
Jl. Raya Rungkut Madya Gunung Anyar, Surabaya 60294, E-mail : [email protected].
E-mail: [email protected]
Abstract
Alcohol or often referred to a s ethanol (ethyl alcohol) in the industrialized world which is often used as a solvent, can be produced by fermentation using the yeast Saccharomyces cereviceae. The basic ingredients that can be fermented among other materials that contain saccharin, starch, and selullosa. Production of bioethanol to the current research done using basic materials derived from waste starch corn kernels from the corn seed breeding industry (PT.BISI INTERNATIONAL Tbk) is 63% starch content. Before the fermentation process, first performed by the process of hydrolysis using the enzyme-producing bacterial α-amylase is Bacillus subtilis to obtain a solution containing sugar (glucose). A solution containing the results of hydrolysis of 15,22% glucose is then fermented for a certain time interval by using yeast species Saccharomyces Cereviceae. F rom the experimental results obtained a conclusion that the maximum yield is obtained on 6 days hydrolysis bacillus 7,5% and a fermentation process using Saccharomyces cereviceae 7,5% which took place on 9 days with levels of bio-ethanol produced by 6,14%.
Key words: Waste Seed Corn, hydrolysis, fermentation, Bioethanol
1. INTRODUCTION
Growth in world consumption of ethanol has grown rapidly over the last few years. The growth of ethanol consumption during the 2001-2009 average of 17.8% per year. This growth is due to many countries in the world to encourage the use of ethanol as a fuel. It can be seen through the policies of countries in the world. In 2010, ethanol consumption in the world is estimated at 21.7 million gallons While in 2015 is expected to increase 45.24 million gallons. In Indonesia, the ethanol industry is less developed due to constrained raw materials in general use drops or molasses. In addition to drip factor is a necessary ingredient for other industries such as brewing and the manufacture of cooking spices, industrial or production capacity of sugar factories in Indonesia also declined.
Waste non-seed corn seeds are currently available 20 tons of untapped and the average waste production of seed corn reached 2-4 tons / month. With a potential source of raw materials to make sure bioethanol will be available in large enough quantities.
2. STRUCTURE OF WRITING
The process of hydrolysis
Hydrolysis, the process of breaking compounds into simpler compounds with the aid of water molecules (Othmer, 1967).
(C6H10O5) + H2O (C6H12O6) Star Bacillus s. Glucose
The process of hydrolysis is influenced by several factors, among others:
a. the content of starch in raw materials change in an organic substrate through the activity of enzymes produced by microbes.
Principle the formation of bio-ethanol reaction to the fermentation process as follows
C6H12O6 2C2H5OH + 2CO2 Glucose Bioethanol
Factors that affect the fermentation process are as follows
3. METHODOLOGY
This study uses the raw material waste starch content of corn kernels with ± 63%. The
catalyst used was Bacillus subtilis,
Saccarhomyces cereviceae. First done soaking, washing, drying and grinding to get the raw materials of corn flour.
Materials - materials that are needed
Materials - materials that are needed in this
• The condition specified
a.The volume of waste corn kernels = 50
Time of Fermentation = 3;6;9;12;15 (days) Bioethanol Making Procedures
Waste corn kernels soaked up the red color present in waste seed corn is gone, after washing and drying. Then finely ground into a homogeneous size (corn flour). Waste corn seed that has been the corn flour mixed with a ratio of 1:3 H2O (333.3 g of corn and 1 liter of Saccharomyces cereviceae starter with a concentration of 5; 7.5; 10 (% v / v), fermentation conducted for 3, 6, 9, 12, 15 days. Filtered, the filtrate was taken and analyzed bioethanolnya level.
4. RESULTS AND DISCUSSION 1. Analysis of Raw Materials
Analyses were performed using a
spectrophotometer at the laboratory
derived starch content of 63% and levels of pesticide to 1:3 is 5.52 mg/l, to 1:5 is 1.244 mg/l, while in general the level of normal starch in corn kernels is about 80 - 85%. 2. The results of hydrolysis
Table 1. The results of the analysis of glucose and starch remaining in the process of hydrolysis
Based on Figure 1, shows that longer hydrolysis produced glucose levels increase, because the longer the hydrolysis, more starch is hydrolyzed to form glucose. At the same hydrolysis, bacillus addition of glucose 7.5% yield the greatest. In addition to its smaller bacillus (5%), hydrolyzed starch into smaller glucose that is because large amounts of starch by bacillus low. At high concentrations of bacillus with a certain amount of starch resulted in bacillus die for lack of flour. The optimum conditions obtained at the level of bacillus subtilis at 7.5% with 9.52% glucose.
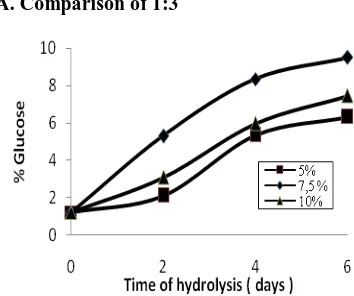
A. Comparison of 1:3
Figure 1. Effect time of hydrolysis on the % glucose
Based on Figure 1, shows that longer hydrolysis produced glucose levels increase, because the longer the hydrolysis, more starch is hydrolyzed
to form glucose. At the same hydrolysis, bacillus addition of glucose 7.5% yield the greatest. In addition to its smaller bacillus (5%), hydrolyzed starch into smaller glucose that is because large amounts of starch by bacillus low. At high concentrations of bacillus with a certain amount of starch resulted in bacillus die for lack of flour. The optimum conditions obtained at the level of bacillus subtilis at 7.5% with 9.52% glucose.
Figure 2. Effect time of hydrolysis on the % residual
starch
Based on Figure 2, shows that the longer time of hydrolysis of starch content the smaller the residual, because it takes longer hydrolysis, more starch is hydrolyzed to form glucose. At the
same time the hydrolysis, the addition of 7.5% is bacillus remaining starch at its lowest at 10.01%.
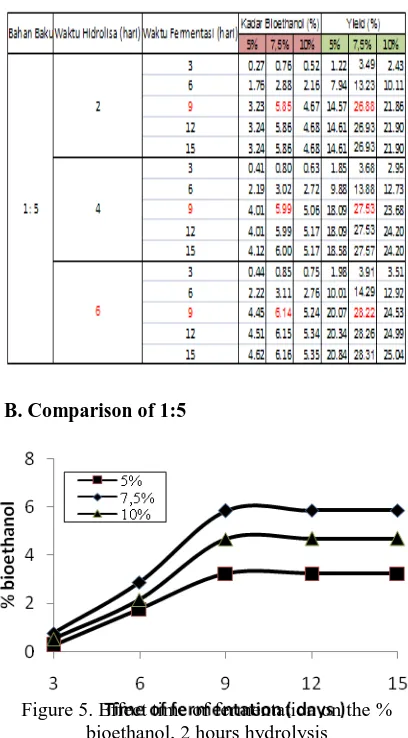
B. Comparison of 1:5
Based on Figure 3, shows that longer hydrolysis produced glucose levels increase, because the longer the hydrolysis, more starch is hydrolyzed to form glucose. At the same hydrolysis, bacillus addition of glucose 7.5% yield the greatest. In addition to its smaller bacillus (5%), hydrolyzed starch into smaller glucose that is because large amounts of starch by bacillus low. At high concentrations of bacillus with a certain amount of starch resulted in bacillus die for lack of flour. The optimum conditions obtained at the level of bacillus subtilis glucose level of 7.5% to 15.22%.
Figure 4. Effect time of hydrolysis on the % residual starch
Based on figure 4, it appears that the longer time of hydrolysis of starch content the smaller the residual, because it takes longer hydrolysis, more starch is hydrolyzed to form glucose. At the same time the hydrolysis, the addition of 7.5% is bacillus remaining starch is at its lowest in 7,13%.
3. Fermentation Results
Table 2. Analysis results on the levels of bio-ethanol fermentation process
B. Comparison of 1:5
Figure 5. Effect time of fermentation on the % bioethanol, 2 hours hydrolysis
Based on Figure 5, shows that the longer
the fermentation rate increases obtained
bioethanol and bioethanol at some point level to be constant, this is because the life of microorganisms Saccarhomyces logarithmic form. At the same fermentation, Saccarhomyces addition of 7.5% produces the largest bio-ethanol
is 5.85% to 26.88% results. Because
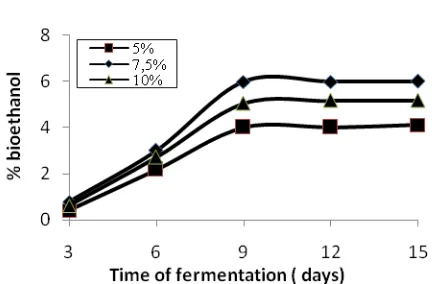
Figure 6. Effect of time fermentation on the % bioethanol, 4 day hydrolysis
Based on Figure 6, shows that the longer
the fermentation rate increases obtained
bioethanol and bioethanol at some point level to be constant, this is because the life of microorganisms Saccarhomyces logarithmic form. At the same fermentation, Saccarhomyces Addition of 7.5% produces the largest bio-ethanol
is 5.99% to 27.53% results. Because
Saccarhomyces low, so the disintegration of glucose into bioethanol small because a large amount of glucose by Bacillus low. At high concentrations Saccarhomyces with a certain amount of glucose that resulted Saccarhomyces
die from lack of glucose.
Figure 7. Effect time of fermentation on the % bioethanol, 6 hours hydrolysis
Based on the number 7, shows that the longer the fermentation rate increases obtained bioethanol and bioethanol at some point level to be constant, this is because microorganisms Saccarhomyces logarithmic forms of life. At the same fermentation, Saccarhomyces Addition of 7.5% produces the largest bio-ethanol is 6.14% to
28.22%. Because Saccarhomyces low, so the disintegration of glucose into bioethanol small because a large amount of glucose by Bacillus low. At high concentrations Saccarhomyces with a certain amount of glucose that resulted Saccarhomyces die from lack of glucose.
5. CONCLUSION
Saccarhomyces 7.5% bio-ethanol
obtained the best level of 6:14%. 4. The results obtained in the fermentation
process at a ratio of 1:5 (weight per solvent) with a fermentation time of 9 days and 7.5% Saccarhomyces obtained 28.22% rate of return of the best.
Suggestion
We recommend that the process of hydrolysis of starch into glucose using the bacillus is not so good results that suggest the need to use hydrochloric acid hydrolysis.
2002. Basic Microbiology.
Muhammadiyah University. Malang. [6] Groggins, P. H. 1958. Unit Process in
[7] Hudiko, Teo. 2009. Fuel Grade Ethanol
Factory Of Elephant Grass. UPN
"Veteran" East Java, Surabaya.
[8] Kirk, R. E., Othmer, D. F. 1952.
Encyclopedia of Chemical Thecnology. 2rd ed. Volume 10. Peinhold Van Nostrand Company: New York.
[9] PT.Bisi International Tbk, 2010
[10]Rahman, Ansori. 1989. Introduction to Fermentation Technology. Ministry of
Education and Culture Directorate
General of Higher Education Inter-University Centre for Food and Nutrition IPB: Bogor.
[11]Sa'id, E., Gumbira. 1987. Application of Fermentation Technology. PT. Melton Son: New York.
[12]Sa'id, E., Gumbira. 1989. Fermenters. IPB: Bogor.
[13]Sari, Ketut. 2010. Purification
Purification of Bioethanol From Grass Elephant With Batch Distillation. Journal
of Chemical Indonesia (Acepted).
Faculty of Chemical Engineering ITB: New York.
[14]Tjokroadikoesoemo, P., Soebijanto.
1986. HFS and Other Industrial Cassava. PT. Scholastic Press: New York.
[15]Winarno, F.G., 1994. Food Chemistry
and Nutrition. PT. Scholastic Press: New York.
[16]Yuliana, Devi.2005. Liquid Waste