RAFT FOUNDATION ANALYSIS USING MATLAB AND CRYSTAL BALL
PROGRAM
Publication
to complete the requirements to
achieve S-1 graduate degree in Civil Engineering
Prepared by :
Aulia Rahman Al-Alaby
NIM : D 100 102 001
To
CIVIL ENGINEERING DEPARTMENT
ENGINEERING FACULTY
RAFT FOUNDATION ANALYSIS USING MATLAB AND CRYSTAL
BALL PROGRAM
Aulia Rahman Al-Alaby
1) 1)Civil Engineering Engineering Faculty Universitas Muhammadiyah Surakarta, Jl. A. Yani
Tromol Pos 1 Pabelan Kartasura Surakarta
e-mail : [email protected]
ABSTRACTION
Solo city is a city that is located in central of java, as the result solo city becomes trade center in java island. Furthermore, the position of the town as a solo 3-way intersection of the east of the area east of Java, north of the area and the coast road west of the city of Yogyakarta. This opportunity is needed to
make any investment such as hotel. Hotel Anugerah Palace is built on area of 1100 m2, consists of 9
floors and 1 Basement. The project is scheduled to finish in June 2013. Due to the construction of this hotel, it is located in center of the city and make the access is easy to get there.
This final project analyzes raft foundation using probability and structural design. There are 2 program analysis, MATLAB and Crystal Ball which total load is 11602456,667 kg and width of area
1026,930 m2. CPT-Test data is analyzed using statistics method to obtain frequency of distribution and
statistics parameter such as Mean, Standard Deviation, coefficient of variation. The value of qc as variable
to calculate raft foundation and results the value of Chi-Square ( ) that make 4 type of distribution,
normal distribution, gamma, beta and log-normal.
The result of MATLAB program analysis can be seen that for qc at point 1 (S1), 2 (S2), 3 (S3)
and 4 (S4) the distribution value that represent is Normal and at all point that combined the distribution value that represent is Normal. The result of analysis program of MATLAB 7.0 can be seen that the
result for best fit distribution at all point and combined all point < (0.05 ; 3) (11,071). The result of
Crystal Ball program analysis by level of confidence 90% - 95% value of SF is 1,5 or more than it and it is used for structural design for raft foundation. The result of structural design of raft foundation which
the thickness of mat is 1,26 m. The determination of reinforcement for coordinate x and y axis, for area at
sphere is used D25-140 and for area at pillar is used D25-140 as main bar and D25-190 as prop bar.
Keyword: CPT-Test, Raft Foundation, MATLAB, Crystal Ball, Structural Design
INTRODUCTION
The development of technology and
information at this century 21 increased very
rapidly. Evidenced by the many discoveries
found in the fields of science, health, astronomy,
education and even in the construction that very
helpful the Engineer for making or facilitate
projects. So many approaches were carried out
by the researchers. In the era of λ0’ there were
quite a lot of analysis designing geotechnical
project were based on analysis of the
deterministic models. Although the approach in
deterministic method has been carried out
extensively, in fact almost all soil properties
varies and the possibility of homogeneous
extremely rare (Listyawan, 2006). So the
concept of probability analysis is better solutions
to handle the less precision of deterministic
methods.
The deterministic way uses only one
value of certain soil properties which considered
representative, the concept of probability of soil
properties uses all the data existing to
soil properties that show high variation in the
data are the results of cone penetration test
(CPT), which in Indonesian is better known as
‘sondir’. The high variation of data can be seen
in the value of tip resistance (qc) and sleeve
friction (fs) from the CPT. Processing data to be
used in the analysis of probability models then
used for raft foundation stability analysis.
Hotel Anugerah Palace is built on area
of 1100m2, consists of 9 floors and 1 Basement.
The projects is scheduled to finish in June 2013.
Due to the construction of this hotel located in
the city for acces is very easy to get there, let
alone the town solo is destination city for trade.
Besides, the position of the town as a solo 3-way
intersection of the east of the area east of Java,
north of the area and the coast road west of the
city of Yogyakarta. Not only as a trade center, a
solo also serves as a transit town to the big cities
so that means no lodging to be a highly
promising.
In first design the Hotel Anugerah
Palace will construct using bore pile foundation,
but after testing using sondir the value of tight
soil is too far, so bore pile foundation method
cannot be applied for this construction.
Consolidation in soil also in different descent
which different area, if using bore pile
foundation that make building consolidate with
different velocity. Then to avoid it, choosing
other method for foundation that is raft
foundation. Because raft foundation is
constructed like a mat that cover all area of
building, not only around of column.
In previous research, Murdhiyanto
(2012) represent the manually calculation
(fellinius method) and the Crystal Ball program
analysis, the value of the safety factor the most
variation happened to the field of landslides III
that is 1.2885( for manual) and the percentage of
the value of F > 1 for 87.770% (Crystal Ball).
Variations performed on Fellinius method
allows the slope will be stable or not eroding as
more security value of 1. While the results of the
program Crystal Ball can be concluded that the
slope it probably persist > 80.
The method used in previous research using the
slope media as research material, but for raft
foundation no one has done research.
Statement of The Research
Based on the problems that have been
have a high building.
2. Finding the value of safety factors for
raft foundation using various CPT data
to obtain the smallest value of the
safety.
Limitation of The Research
Order to this research will be focused on
the problem, it is necessary to add any
boundaries. The boundaries problem as below:
1. Sondir Data is obtained from CPT test in
construction of the Hotel Anugerah
2. Stability method of raft foundation is
used on the project buildings.
3. The type of raft foundation that used is
flat plate.
4. The method of raft foundation that used
is rigid conventional method.
CPT (Cone Penetration Test)
This inspection is intended to determine the
penetration of tip resistance and soil sleeve
friction. Penetration of tip resistance is the
resistance of the soil of the tip conus is
expressed in wide unity force. Sleeve
friction is the shear resistance with biconus
cover in length unity force.
Statistics
Statistics is the study of the collection,
organization, analysis, interpretation and
presentation of data. It deals with all aspects of
data including the planning of data collection in
term of design of surveys and experiment. When
analyzing data, it is possible to use one of two
statistics or interferential statistics.
Chi-Square Test
Chi Square test is useful to test the relationship
or influence of two nominal variables and
measure the strength of relationships between
variables with each other nominal variables (C =
Coefficient of contingency).
Introduction Program MATLAB
MATLAB (Matrix Labolatory) is a
program for the analysis and numerical
computation and an advanced mathematical
programming language that created with the idea
to use eel and matrix form.
Introduction Program Crystal Ball
Crystal Ball is a software that is used to
do the Monte Carlo simulations in Ms Excel
spreadsheet. Crystal Ball calculates thousands of
cases of "what if" automatically, save the input
and the results of each calculation as self
scenarios. Analysis of each scenarios will
provide an explanation of limitation of posibility
‘outcome’, where the input section has the
maximum result and where the focus of
attention.
RESEARCH METHOD
At this research the problem is to
analyze CPT-Test Data which accommodate all
the variations, that display all the data to
frequency distributions forms. The research data
that needed is CPT data with clay soil that taken
at the construction site of Anugerah Palace
Hotel, Surakarta.
Research Tools
1. MATLAB Program 2. Crystal Ball Program
3. Drawing Program (AutoCad 2007)
4. Microsoft Program (Office 2010)
RESEARCH STEP
Step I : Litelature study
Step II : Collection of data sondir
Step III : Statics analyze consist of :
a) Density function of
probability
1) Normal distribution
3) Beta distribution
4) Log-normal distribution
b) Statistical parameters
1) Mean
2) Deviasi standard
3) Coefficientof variation
Step IV : Chi-square test
Step V : Foundation stability analysis
consist of :
a. Manually calculation
b. Analysis using probability
method (MATLAB and Crystal
Ball program)
Step VI : Design Structure of Raft
Foundation
Step VII : Discussion
Step VIII : Conclusion
Step IX : Finish
ANALYSIS AND DISCUSSION CPT Data Hotel Anugerah Palace
In order to design and construct Hotel
Anugerah Palace has implemented soil
investigation work that taken using sondir for 4
points, with the design total load 11602456,667
kg.
Capacity Analysis of Raft Foundation
Table V.1. Bearing capacity formula for raft
foundation :
Point S1 S2 S3 S4 Combi nation Bearing
Capacity (kg/cm2)
20308 ,6322
18347, 0029
14308, 3545
19731, 6824
18173, 918
Statistical Analysis
Data Preparation at MATLAB Program
Statistical analysis was performed on
a raft foundation with 4 points and the combined
sondir of all sondir point.
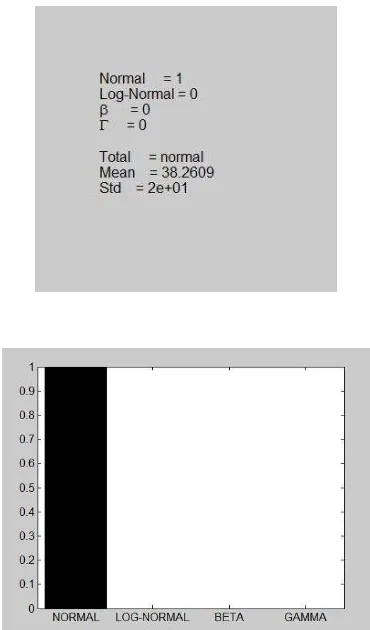
Value of Chi-Square (χ2)
In addition to the total value, the
mean, the standard deviation of the statistical
tests that produce the value of χ2(Chi-Square)
best fit distribution in tip resistance (qc). With
Figure V.1. Statistical test graphic for point 1
(S1).
Table V.2. results of statistical tests for the value
of χ2best fit distribution (qc)
c) combined all the points.
Point χ2
Normal 0.27462
Log Normal 0.96657
Beta ( ) 0.35807
Gamma ( ) 0.47073
Chi-Square Test (χ2)
Table V.4. calculation results best fit χ2
distribution (qc) at any point and combined.
Point α k d.b
each point and combined all points.
Parameter S1 S2 S3 S4 Combinati on
Mean (µ) kg/cm2
Standard deviation
Table V.6. The results of the calculation of the
standard deviation value for each point and
combined all points.
Parameter S1 S2 S3 S4 Combin ation Standard Deviation
(σ) kg/cm2
16, 979
16, 010
12,83 2
15, 661
15,371
The coefficient of variation (V)
Table V.10. The results of the calculation of the
coefficient of variation for each point and
combined all points.
Parameter S1 S2 S3 S4 Combination Coefficient
variation (V)
0,444 0,463 0,476 0,421 0,449
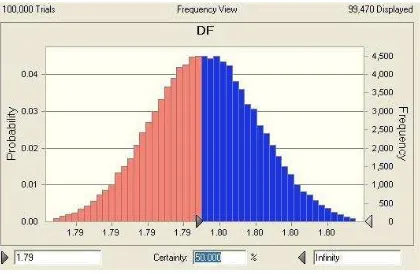
Raft Foundation Analysis with Probability Method Using Crystal Ball Program Calculation at point 1 (S1)
By using the value of the standard deviation (σ)
= 16,λ7λ and the mean ( ) = γ8,β61.
Thus, the graph obtained as follows:
Figure V.2. frequency graph beginning at point 1
(S1).
Figure V.3. cumulative frequency graph
beginning at point 1 (S1).
Figure V.4. The results of statistical tests at
point 1 (S1).
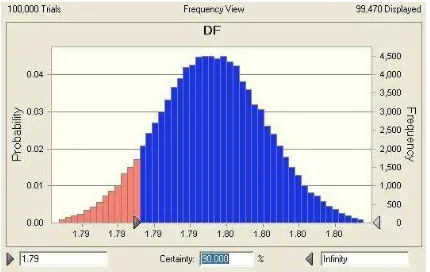
Figure V.5. 50% SF frequency graph at point 1
Figure V.6. End of the frequency graph at point
1 (S1).
Structural Design of Raft Foundation Step 1 :
Total load of building = 11602456,667 kg.
Step 2 :
The pressure on the soil q, below the raft
foundation, by using equation :
q = + +
The location of the line of action of the resultant
column load is shown :
(13,678) (18,891) = 13215,481 kg/m2
Step 3 :
Compare the values of the soil pressures
determined in step 2 with the net allowable soil
pressure to determine whether q < qall(net).
Because 13215,481 < 13328,051 , so the value
of q is accepted.
Step 4 :
Divide the mat into several strips in the x and y direction. (see Figure V.1)
Step 5 :
Draw the shear V and the moment M diagram for
each individual strip (in the x and y direction).
Then divide the mat into several strips.
Strip a b g f :
321702,041kg 343355,462 kg 344017,033 kg 344017,033 kg 344017,033 kg 343355,462 kg 231638,691 kg
A E I M Q U Y
Figure 5.14. Load, shear, and moment diagram
for strips abgf
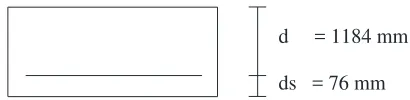
1. Determination of The Thickness of The Mat
For this problem, the critical section for diagonal
tension shear will be at the column carrying
steel bars to be used are 25 mm in diameter, the
total thickness of the slab is
h = 1,152 + 0,076 + 0,025 =1,253 = 1,26 m
the thickness of this mat will satisfy the wide
beam shear condition across the four strips under
consideration.
2. Detemination of Reinforcement
From the moment diagram it can be seen that the
maximum positive moment is located in strip
3. Calculation Length of Pressure Distribution
The prop bar that set in frame which is cut in
certain place, then that calculated length of
pressure distribution or d. Beside that, because
using the main bar D25 (22 < ), so using formula
of d from table IV.1 (Balok dan Pelat Bertulang
: Ali Asroni ), as follow :
Using dh = 340 mm > 150 mm (Okey).
CONCLUSION AND SUGGESTION
The analysis that has done can be taken
conclusion as follow :
1) The result of MATLAB program analysis can
be seen that result for qc at point 1 (S1), 2
(S2), 3 (S3) and 4 (S4) the distribution value
that represent is Normal and at all point that
combined the distribution value that
2) The result of analysis program of MATLAB
7.0 can be seen that the result for best fit
distribution at all point and combined all
point < (0.05 ; 3) (11,071) that taken from
table of distribution value , that mean the
normal distribution can be used.
3) The result of Crystal Ball program analysis
by level of confidence 90% - 95% value of
SF is 1,5 or more than it and it is used for
structural design for raft foundation.
4) The result of structural design of raft
foundation which the thickness of mat is 1,26
m.
5) The determination of reinforcement for
coordinate x and y axis, for area at sphere is
used D25-140 and for area at pillar is used
D25-140 as main bar and D25-190 as prop
bar.
There are some kind that must be noticed for this
final project :
1) Need to do an observation other type of raft
foundation which variety depth.
2) Need to do other observation which variety
sondir data.
3) Learn more about raft foundation from
obtaining a soil data until reinforcement for
its foundation.
REFERENCE
- Anonym, Mekanika Tanah II, Laporan
Praktikum, S1 Teknik Sipil, Universitas
Muhammadiyah Surakarta, Surakarta.
- berandakami.files.wordpress
- Bowles, J.E, 1986, Analisa dan Desain
Pondasi, Penerbit Erlangga, Jakarta.
- dhianadhe.at.ua.
- Listiyonobudi.blogspot.com
- Subagyo, P dan Djarwanto, 2005, Statistika
Induktif (edisi V), BPFE-Yogyakarta,
Yogyakarta.
- Walpole, R.E., Myers, R.H., and Myers, S.L.,
2000, Probabilitas dan Statistik Untuk
Teknik dan Sains, Prenhalindo, Jakarta.
- Widyaprakarsa, D.R.,2012, Analisis Stabilitas
Lereng Tanah Lempung Jenuh Dengan
Variasi Bidang Longsor Berdasarkan
Teori Probabilitas, Tugas Akhir, S1
Teknik Sipil, Universitas
Muhammadiyah Surakarta, Surakarta.