Rahmayeni et al., JMES, 2017, 8 (5), pp. 1634-1643 1634 JMES, 2017 Volume 8, Issue 5, Page 1634-1643
1.
Introduction
The development of technology and industry leads to increasing environmental problems such as surface and ground water contamination. Organic dyes from the textile industry are a major source of water pollution because they are not decomposed by microorganisms [1]. Congo red [1-naphthalene sulfonic acid, 3,30-(4,40-biphenylenebis (azo)) bis (4-amino-)disodium salt] is one of the azo dyes often used in the textile industry [2]. This dye has a stable structure, is toxic and possibly a carcinogen [3] that can cause various diseases harmful to the human body if it accumulates in large amounts. Therefore, it is necessary to treat waste containing this dye to reduce its existence in aquatic environments. Many efforts have been made to reduce the negative impact of waste dyes such as adsorption, coagulation, chlorination, and biological treatment [4] but these approaches are not very effective and cause new problems. To overcome these problems, the photocatalytic process using a semiconductor as the catalyst to degrade the azo dye has recently attracted extensive attention. This photocatalytic process is a promising technology because in this process highly active hydroxyl radicals are produced, by irradiation of photocatalysts by visible or ultraviolet light, that are capable of oxidizing various organic materials into CO2 and H2O or other harmless simple compounds [5, 6, 7].
In recent years, the semiconductor ZnO has attracted much attention in the application of the photocatalytic process due to it being cheaper, having higher quantum efficiency, being environmentally friendly, biodegradable, and having good photocatalytic activity [8]. However, ZnO has a large band gap of about 3.37 eV so that it can only absorb UV light with a wavelength of less than about 387 nm. Therefore, this material is unfavorable if used for a photocatalytic process in the visible region of solar light [9]. A wide variety of materials and methods have been used to modify ZnO in an effort to improve its activity in visible light region. These include doping ZnO with metal atoms such as Fe/ZnO [10], and Co/ZnO [11], or with non-metals such as ZnO N-doped [12]. In addition, ZnO doped with metal oxides has been tested such as CuO/ZnO [13], and ZnO/TiO2 [14]. However, most of these materials are difficult to separate from the liquid and use for subsequent
processes [15].
Ferrite materials with the formula MFe2O4 having a narrow band gap such as ZnFe2O4 have been used to
improve the photocatalytic activity of ZnO in visible light. Spinel ZnFe2O4 with a narrow band gap of 1.9 eV,
Journal of Materials and
Photocatalytic Performance of ZnO-ZnFe
2O
4Magnetic Nanocomposites on
Degradation of Congo Red Dye under Solar Light Irradiation
Rahmayeni*, A. Ramadani, Y. Stiadi, N. Jamarun, Emriadi, S. Arief
Chemistry Department, Mathematics and Natural Sciences Faculty, Andalas University, Padang, 25163, Indonesia
Abstract
Nanocomposites of ZnO-ZnFe2O4 were synthesized in two steps using a sol-gel
process and a hydrothermal. Photocatalytic performances of nanocomposites were investigated using Congo red as a model dye under solar light. Various techniques were used to investigate the structure, morphology, composition, interaction, magnetic and optical properties of the samples. XRD measurements were consistent with the wurtzite phase of ZnO and the spinel phase of ZnFe2O4. SEM
images showed that the nanocomposites were constructed from lots of sphere-like nanoparticles. The magnetic properties of all ZnO-ZnFe2O4 nanocomposites
showed paramagnetic behavior and their magnetization saturation increased with increasing amounts of ZnFe2O4. The photocatalytic activity of the nanocomposites
Rahmayeni et al., JMES, 2017, 8 (5), pp. 1634-1643 1635 which gives rise to the visible-light response, as well as outstanding photochemical stability, and low cost has become increasingly attractive in the area of photocatalytic processing [16]. In addition, since it is a magnetic metal oxide, the particles produced can be separated from the liquid using an external magnetic field [17, 18]. Several previous studies have used this ferrite to increase the activity of TiO2 and enhance its absorbtion of light
in the visible region of the spectrum [19, 20].
Nanocomposites of ZnO-ZnFe2O4 have attracted the attention of researchers in the past decade and have been
synthesized by various methods and then used for photocatalytic processes. Shao et al. prepared this composite by an ultrasonic agitation process and examined the degradation of methylene blue using UV light [8]. ZnFe2O4/ZnO nanocomposites immobilized with various amounts of graphene were prepared using an
ultrasound aided solution method and then used to degrade Rhodamine B using light from a xenon lamp [9]. ZnO-ZnFe2O4 composite photocatalysts supported on activated carbon have been prepared by a
co-precipitation/annealing process and used as an effluent adsorbent [21]. ZnFe2O4/ZnO nanoparticles have also
been synthesized by a co-precipitation method using polyvinyl alcohol as a surfactant and were used to degrade methyl orange and methylene blue [22].
In this paper, we report synthesis of nanocomposite photocatalysts of ZnO-ZnFe2O4 by a two-step method, a
sol-gel method to produce zinc ferrite nanoparticles and a hydrothermal method to produce the nanocomposites. Their photocatalytic activity was evaluated by measuring degradation of Congo red under solar light irradiation. Three parameters that determine the efficiency of the photocatalytic process (initial concentration of dye, amount of catalyst used, and duration of irradiation) were investigated.
2.
Experimental details
2.1.Materials
Zn(NO3)2.4H2O and Fe(NO3)3.9H2O were used as starting materials for the preparation of ZnFe2O4 and
ZnO-ZnFe2O4. Citric acid, NaOH, and ethanol were purchased from Merck. Congo red dye was purchased from a
local firm. Deionized water used in this work and all the chemicals used were analytical grade and were used without further purification.
2.2. Synthesis of ZnFe2O4 by a sol-gel process
Zinc ferrite nanoparticles were synthesized by the sol-gel process used previously work [23]. The metal salts of Zn(NO3)2.4H2O and Fe(NO3)3.9H2O (mole ratio 1:2) were dissolved in 40 mL of ethanol with stirring at room
temperature. Citric acid (30 mmol) was separately dissolved in 40 mL of ethanol. Then the citric acid was added to the zinc and ferrite solution with the mole ratio of Zn+2 : Fe+3 : citric acid of 1 : 2 : 3. The mixture was stirred
vigorously at 500 rpm for 1 h at 70°C to form a wet gel and then dried in an oven at 120°C for 24 h to form a dry gel. The dried gel was grinded with a mortar and pestle and the resulting ZnFe2O4 powder was calcined in a
furnace at 600°C for 2 h. The nanoparticles of ZnFe2O4 obtained were used to synthesize the ZnO-ZnFe2O4
composites.
2.3.Synthesis of ZnO-ZnFe2O4 a by hydrothermal method
Nanocomposites of ZnO-ZnFe2O4 were synthesized by the hydrothermal method used previously [24]: 20 mmol
of Zn(NO3)2.4H2O and ZnFe2O4 nanoparticles were mixed into 40 mL of distilled water with mole ratio of Zn+2 :
ZnFe2O4 of 1 : 0.05. To adjust the pH to 12, NaOH (2M) solution was added drop wise to the mixture. Then the
mixture was transferred to a Teflon-lined stainless steel autoclave and heated at 180°C for 3 h before being left at room temperature to cool. The ZnO-ZnFe2O4 powder was filtered and washed with distilled water to change
the pH to 7. Finally, the sample was dried in oven at 100°C for 2 h. The as-obtained sample was labeled NCP0.05. To produce NCPs with different morphologies the same reactions were performed with mole ratios of
Zn+2: ZnFe
2O4 of 1 : 0.01 and 1 : 0.1 with the other reaction parameters kept unchanged. These samples were
named NCP0.01 and NCP0.1, respectively. The same procedure, using Zn(NO3)2.4H2O alone as precursor, was
used to prepare ZnO as a control.
2.4.Characterization of products
Rahmayeni et al., JMES, 2017, 8 (5), pp. 1634-1643 1636 PW3040). Magnetic properties of the samples were investigated by Vibrating Sampler Magnetometer (VSM OXFORD 1.2H). Fourier transformed infrared (FT-IR) spectra were obtained on a FTIR Thermo Nicolet iS5 using the KBr pellet technique. A Diffuse reflectance UV-Vis spectrophotometer (Shimadzu UV-Vis 2450) was used to record the absorbance spectra of samples at room temperature. The thermogravimetry (TG) curve of NCPs was recorded at a heating rate of 10/min using a thermogravimetric analyzer (LECO TGA 701). Adsorption-desorption isotherms analysis was conducted using a surface area and pore size analyzer (Quantachrome Nova 1200 E).
2.5.Photocatalytic activity
The photocatalytic activity of the NCPs was determined by degradation of Congo red in aqueous solution under solar light. The procedure, based on an earlier study [24], was as follows: the ZnO-ZnFe2O4 catalyst (15 mg)
was dispersed in 20 mL of Congo red solution (25 mg/L). The mixture was exposed to solar radiation for 1, 2 and 3 h (from 11:00 am to 14:00 pm, light intensity around 40-60 klx). After that, the NCPs were removed from the liquid and the absorbance of the solution was measured by UV-Vis spectroscopy at a wavelength of 496 nm to determine the percentage of Congo red degraded. As a control experiment, ZnO was used. The effect of initial dye concentration was determined by varying Congo red concentration from 15 to 40 mg/L. Catalyst loadings from 5 to 20 mg were tested and the duration of irradiation varied from 0.5 to 3 h.
3.
Results and Discussion
3.1. Morphology and chemical composition
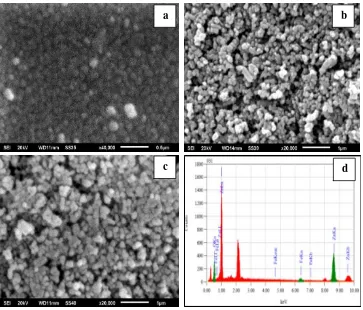
Surface morphology of samples was investigated by Scanning Electron Microscopy (SEM). Figure1illustrates the SEM images of ZnFe2O4, NCP0.05 and NCP0.01. It can be observed that ZnFe2O4 (Fig. 1a) consists of uniform
spherical shaped particles. The NCP samples (Fig. 1b and 1c) seem to form of roughly uniform spheres.
Figure 1: SEM images of (a) ZnFe2O4, (b) NCP0.01, (c) NCP0.05 and (d) the EDS spectra of NCP0.05
NCP particles are larger than the ZnFe2O4 particles because the NCPs comprise a ZnFe2O4 core covered by a
ZnO shell. The NCP0.01 particles are smaller than the NCP0.05 particles due to the smaller content of ZnFe2O4.
a b
Rahmayeni et al., JMES, 2017, 8 (5), pp. 1634-1643 1637 The nanocomposite NCP0.05 has a porous uniform spherical like form. However, some aggregates were observed
on the surface of NCP0.01 particles. That the NCP particle sizes are in the nanometer region helps the
photocatalytic degradation of dye due to the large surface area of the catalyst. The elemental composition of the
NCP0.05 sample was analyzed by energy dispersive X-ray spectroscopy (EDS). The NCP0.05 sample was chosen
for this analysis because it showed slightly better photocatalytic activity than the other NCPs tested (see below). Figure 1d shows the EDS spectra of NCP0.05 synthesized at 180°C. The percentages of Zn, Fe and O elements in
the composite are 79.96% 2.22% and 17.82%, respectively. There are no impurities present and the observed atomic percentages of Zn, Fe and O match with their initial amounts. The sharp peaks at around 2.1-2.2 keV and several lower peaks in the EDS spectra of the sample are due to the presence of gold, which was coated on the samples before the SEM analysis to enhance visibility of the surface morphology.
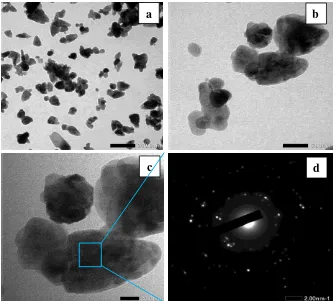
To more precisely estimate the particle size of the as-prepared sample, a TEM image of NCP0.05 was recorded
(Fig. 2). It can be clearly seen that the nanocomposite particles are composed of small grains which spread well with an average particle size of 48 nm (Fig. 2a). The nanoparticles of ZnFe2O4 (black part) were either attached
to ZnO particles (white part) or coated with ZnO forming a shell and core structure (Fig. 2 b-c). However, a few free ZnO particles were also observed. Our results show that the hydrothermal method has a significant effect on the homogeneity and size of composites compared to a co-precipitation method [22]. The existence of ferrite
particles in nanocomposites increases the material’s activity under visible light. SAED can provide information
on the crystallography and crystal orientation of an individual. The selected area diffraction (SAED) pattern of
NCP0.05 shows the typical characteristic ring of a crystallized phase (Fig. 2d).
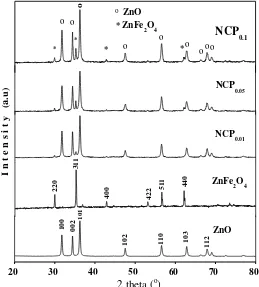
3.2. Structural Study by XRD
The crystalline phase of the as-prepared samples was characterized by XRD. Figure 3 shows the XRD patterns of (a) ZnFe2O4, (b) ZnO, and (c) the three different NCPs. The distinct diffraction peaks at 2θ =32o, 34o, 36o,
48o, 56o, 63o, 68o, and 69o were indexed to the hexagonal wurtzite phase of ZnO being very close to the standard
(ICSD no.01-080-0074). The characteristic peaks at 2θ = 30o, 35o, 43o, 54o, 57o, and 62o were indexed to the
cubic phase of ZnFe2O4 being in agreement with the standard diffraction pattern (ICSD no.01-079-1150). The
NCPs show patterns consent with the presence of both ZnO and ZnFe2O4 phases. The strong signal from
ZnFe2O4at 2θ = 35o increased in intensity from NCP0.01 to NCP0.05 to NCP0.1 consistent with increasing amounts
c
Figure 2: TEM images of (a-c) NCP0.05 at different magnifications and (d) the SAED pattern ofNCP0.05
a
b
Rahmayeni et al., JMES, 2017, 8 (5), pp. 1634-1643 1638 of ZnFe2O4 in the nanocomposites. There are no other diffraction peaks, which indicates the purity of the
hexagonal wurtzite phase of ZnO and the cubic phase of ZnFe2O4 in these nanocomposites. Using the equation:
D = 0.9λ/(β cos θ) (1)
where D is the average crystallite size, λ is the wavelength of Cu Kα, β is the full width at half maximum of the
diffraction peaks and θ is Bragg’s angle [25] the average ZnO crystallite sizes in NCP0.01, NCP0.05, NCP0.1 were
estimated to be about 31.3 nm, 28.2 nm, and 32.1 nm, respectively.
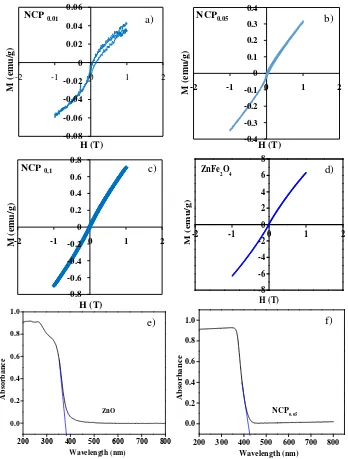
3.3. Magnetic and Optical properties
Magnetic properties of the as-prepared samples were analyzed by Vibrating Sampler Magnetometer. The magnetic hysteresis curves for the different NCPs are shown in Figure 4 (a, b, and c). The magnetic saturation value increases with increasing amounts of ZnFe2O4 in NCP. The specific magnetic saturation of NCP0.01,
NCP0.05, and NCP0.1 were 0.044, 0.32 and 0.7 emu/g, respectively. These values are typical for paramagnetic
properties of NCPs. However, the magnetic properties of these NCPs is lower than those of ZnFe2O4 (6.5
emu/g) shown in Figure 4d. It is due to the small amount of ZnFe2O4 in the NCPs. The magnetic saturation
value of these ZnFe2O4 nanoparticles is similar to the value obtained by a previous researcher [18]. The
magnetic properties of these NCPs means that they can be separated from the liquid using an external magnetic field so they can be reused in subsequent photocatalytic processes.
The optical properties of the samples were analyzed using UV-Visible diffuse reflectance spectroscopy. Figure 4 (e-f) shows the spectrum of the ZnO control sample and NCP0.05. The nanoparticles of ZnO absorb in the UV
range whereas ZnFe2O4 (not shown) absorbs in the visible light range with a band gap of 1.9 eV. The
absorbance range of the NCP sample was shifted into the visible range because of the presence of ZnFe2O4. The
point of interception of the tangent to the descending part of the absorption peak with the wavelength axis gives the value of the diffuse absorption edge (nm). The diffuse absorption edges of ZnO (385 nm) and NCP0.05 (429
Rahmayeni et al., JMES, 2017, 8 (5), pp. 1634-1643 1639
3.4. Fourier Transform Infrared (FTIR)spectroscopy analysis
The possible interaction between ZnO and ZnFe2O4 in the sampless was investigated by FTIR spectroscopy.
The FTIR spectra of ZnFe2O4 and NCP0.05 are shown in Figure 5a. In the spectrum of ferrite (ZnFe2O4) the sharp
peak around 562 cm-1 is attributed to stretching vibration of the Fe-O bond and the peak around 1641 cm-1
corresponds to the bending vibration of -OH. The FTIR spectrum of the NCP0.05 nanocomposite showed a sharp
peak around 437 cm-1 which corresponds to the Zn-O vibration, while the peak due to Fe-O stretching has
shifted to 560 cm-1. The wide peak in the area around 3412 cm-1 is the vibration of the O-H groups of water
molecules.
In order to determine the thermal stability of NCP0.05, the as-prepared sample was subjected to TGA. Figure 5b.
shows the thermogravimetry curve for NCP0.05. The weight loss around 100°C is due to evaporation of adsorbed
water. The weight loss at 254-278°C is attributed to the loss of residual nitric. At temperatures from 300 to 1000°C there is no significant weight loss. The total weight loss for the sample was about 7%. This indicated the thermal stability of the nanocomposite.
200 300 400 500 600 700 800
0.0
200 300 400 500 600 700 800
0.0
Figure 4: The magnetic properties of (a-c) NCPs with different compositions, (d) ZnFe2O4
and (e-f) the optical properties of ZnO and NCP0.05
b)
c) d)
Rahmayeni et al., JMES, 2017, 8 (5), pp. 1634-1643 1640
3.5.Thermogravimetric analysis (TGA)
3.6. Adsorption-desorption isotherms analysis
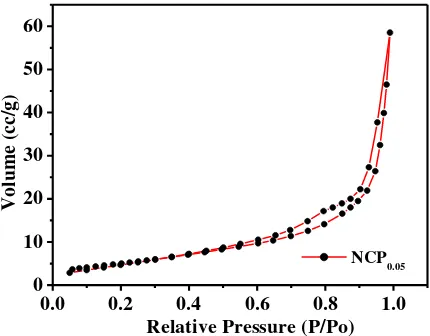
The nitrogen adsorption-desorption isotherms of the NCP0.05 sample was measured by the
Brunauer-Emmett-Teller (BET) technique to investigate the specific surface area and porous structure of the NCP (Fig. 6). BET studies reveal the specific relation between the concentration of the adsorbate and its adsorption degree onto the adsorbent surface [26]. According to the IUPAC classification, the isotherms of NCP0.05 are type IV with a
narrow hysteresis loop, indicative of a mesoporous structure. The increase in adsorption branch with the sharp decline in desorption branch observed at P/Po greater than 0.9 due to the capillary condensation of N2 into the
mesoporous structure indicating good homogeneity of the nanocomposite [27]. The BET specific surface area of NCP0.05 is 16.517 m2g-1 and the average pore diameter of the sample calculated using the Barret-Joyner-
Halenda equation is 30.842 Å.
3.7. Photocatalytic performance
The photocatalytic activities of as-prepared samples were examined by following the degradation of Congo red. The experiments were carried out by adding 15 mg of nanocomposite into 20 mL of Congo red solution (25 mg/L). The photocatalytic degradation of Congo red was conducted under ambient conditions in direct solar radiation. Therefore, it is important to estimate the contribution of direct photolysis to the overall photocatalytic degradation. Blank experiments were carried out using Congo red without catalyst for this purpose. The percentage degradation of Congo red was determined using the following equation:
Degradation (%) = [(Ao-At)/Ao] x 100% (2)
4000 3500 3000 2500 2000 1500 1000 500
NCP0.05
Figure 6: Nitrogen adsorption-desorption isotherms of the NCP0.05
Rahmayeni et al., JMES, 2017, 8 (5), pp. 1634-1643 1641
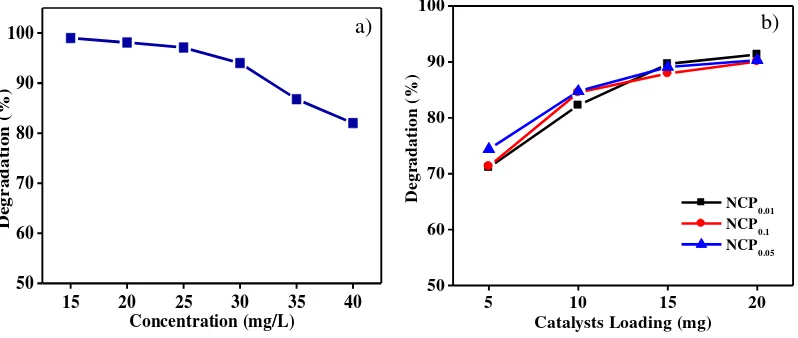
where Ao is the initial absorbance and At is the absorbance at time “t” [28]. Figure 7a shows the percentage
degradation versus Congo red concentration in the presence of 15 mg NCP0.05. The percentage degradation
decreases with increasing concentrations of the dye. At high concentrations of dye, the Congo red molecules stop more of the sunlight reaching the composite decreasing photocatalytic degradation. At Congo red concentrations up to 25 mg/L the percentage degradation was greater than 97%. A concentration of 25 mg/L was used for subsequent experiments.
The amount of catalyst loaded in the photocatalytic process is an important factor for heterogeneous catalysts from an economic viewpoint. Experiments were, therefore, carried out using different amounts of catalyst, from 5 to 20 mg, for 2 h in the presence of NCP0.05. In Figure 7b the effect of catalyst loading on the percentage
degradation of Congo red can be seen. Generally, the percentage degradation of this dye increases with increasing amounts of catalyst, and the optimum condition was obtained at a loading of 15 mg catalyst. For efficiency purposes, the next experiments used 15 mg catalyst.
Figure 8a shows the percentage degradation of Congo red versus time in the presence of ZnO, NCPs with various compositions of ZnO:ZnFe2O4 and without catalyst. In the absence of catalyst the percentage
degradation of Congo red only reaches 51.7 %, and with ZnO alone was only 71 % after 3 h. A high level of degradation occurs only if NCPs are used as a catalyst. The percentage degradation of Congo red under solar radiation for 3 h in the presence of NCP0.01, NCP0.05, and NCP0.1 was 95.3, 97.1 and 96.5%, respectively. The
best result was obtained using NCP0.05 but the result is not too different with NCP0.01 and NCP0.1. This can be
related to the morphology of NCP0.05 which was smaller, more homogeneous and porous than the others.
Homogeneity and small particle size enhances the photocatalytic activity of the composite so that the degradation process is faster.
The kinetics of degradation was studied by irradiation of the Congo red solution (25 mg/L) in the presence of catalyst (15 mg) for 0.5-3h under solar light. Using the Langmuir-Hinshelwood equation, ln(Co/Ct) = kt, where Co is the initial concentration of Congo red dye, Ct is concentration of Congo red at time t and slope k is the apparent rate constant [6], the curve for degradation of Congo red (Fig. 8b) follows pseudo-first order kinetics. The values of R2 for NCP
0.01, NCP0.05, and NCP0.1 are 0.9892, 0.9827 and 0.9745, respectively.
The photocatalytic degradation of Congo red dye by ZnO-ZnFe2O4 nanocomposites under solar light could be
described by the following reaction mechanism: the ZnO valence band (VB) and conduction band (CB) are located below the VB and the CB of ZnFe2O4. Under solar light irradiation, the electrons from the VB of
ZnFe2O4 were excited and transferred to the CB, and the electrons moved into the CB of ZnO. Then the
electrons from the CB of ZnO react directly with absorbed O2 producing O˙2̄ which is a super active radical
anion [8]. This super active radical anion will react with H+ that is produced from the decomposition of water
molecules to form H2O2. This peroxide forms hydroxyl radicals (.OH) in the presence of e- which are
responsible for degrading the Congo red molecules (Fig. 9).
15 20 25 30 35 40
Figure 7: The effect of (a) initial concentration and (b) catalyst loading on the degradation of Congo red
Rahmayeni et al., JMES, 2017, 8 (5), pp. 1634-1643 1642
Furthermore, the holes (h+) formed by the excitation of electrons in ZnO move to the valence band of ZnFe 2O4.
Therefore, recombination of the e- - h+ pair is prevented and the photocatalytic efficiency of the sample is
enhanced. The hole (h+) oxidizes OH- formed from the decomposition of water molecules into .OH. The hydroxyl radical attacks the Congo red molecules forming CO2 and H2O [3, 8]. The process can be summarized
in the following set of reactions:
ZnFe2O4 + hv → e- + h+
ZnO-ZnFe2O4 nanocomposites with enhanced photocatalytic activity have been synthesized in two steps (using
the sol-gel and hydrothermal methods) from zinc nitrate and ferric nitrate salts. Photocatalytic performances of nanocomposites were investigated by following degradation, under solar light, of Congo red as a model dye. The results indicate that nanocomposites exhibited higher activity than pure ZnO and the highest activity was obtained for the nanocomposite with a molar ratio of ZnO to ZnFe2O4 of 1 : 0.05 with which the percentage
degradation of Congo red reached 97.1 % after 3 h. XRD measurements reflected the wurtzite phase of ZnO and
0 1 2 3
Figure 8: The degradation of Congo red (a) in the presence and absence of catalyst and (b) pseudo first
order reaction kinetics using NCPs[catalyst 15 mg, dye 25 mg/L]
Figure 9: Molecular structure of Congo red
Rahmayeni et al., JMES, 2017, 8 (5), pp. 1634-1643 1643 spinel phase of ZnFe2O4. SEM images showed that the nanocomposites are constructed of sphere-like
nanoparticles. All ZnO-ZnFe2O4 nanocomposites showed paramagnetic behavior and their magnetization
saturation increases with increasing ZnFe2O4 content. The nitrogen adsorption-desorption isotherm analysis
showed narrow hysteresis loops, indicating a mesoporous structure for the NCPs.
Acknowledgments
-The authors are grateful to Chemistry Department, Mathematics and Natural Sciences Faculty, Andalas University for providing the facilities for the research.References
1. Saikia L., Bhuyan D., Saikia M., Banajit M., Dipak K.D., Pinaki S., Applied Catal. A, Gen. 490 (2015) 42–
49.
2. Afkhami A., Moosavi R., J. Hazard. Mater.174 (2010) 398–403.
3. Dafare S., Deshpande P.S., Bhavsar R.S., Indian J. Chem. Technol. 20 (2013) 406–410.
4. Rahimi R., Kerdari H., Rabbani M., Sha M., Desalination 280 (2011) 412–418.
5. Lamba R., Umar A., Mehta S.K., Kansal S.K., J. Alloys Compd. 620 (2015) 67–73.
6. Guo H., Zhu H., Li Q., Appl. Catal. B Environ. 160–161 (2014)408–414.
7. Han A., Khuan G., and Jaenicke S., J. Mater. Environ. Sci. 5 (2014) 3–4.
8. Shao R., Sun L., Tang L., Chen Z., Chem. Eng. J. 217(2013) 185–191.
9. Sun L., Shao R., Tang L.Q., Zhidong C., J. Alloys Compd. 564 (2013) 55–62.
10. Dhiman P., Chand J., Kumar A., Kotnala R.K., Batoo K.M., Singh M., J. Alloys Compd. 578 (2013) 235–
241.
11. Lu Y., Lin Y., Wang D., Wang L., Xie T., Jiang T., Nano Res. 4 (2011) 1144-1152.
12. Wu C., Appl. Surf. Sci. 319 (2014) 237-243.
13. Giahi M., Badalpoor N., Habibi S., Taghavi H., Bull. Korean Chem. Soc. 34 (2013) 2176–2182.
14. Shalaby A., Nedelcheva A.B., Iordanova R., Dimitrev Y., J. Chem. Technol. Metall. 48 (2013) 585-590.
15. Wilson A., Mishra S. R., Gupta R., Ghosh K., J. Magn. Magn. Mater. 324 (2012) 2597–2601.
16. Tong G., Du F., Wu W., Wu R., Liu F., Liang Y., J. Mater. Chem. B. 1 (2013) 2647–2657.
17. Jang J.S., Borse P.H., Lee J.S., Jung Ok-S., Cho C-R., Jeong E.D., Ha M.G., Won M.S., Kim H.G., Bull.
Korean chem Soc. 30 (2009)1738-1742.
18. Rameshbabu R., Ramesh R., Kanagesan S., Karthigeyan A., Ponnusamy S., J. Matter. Sci. Mater. Electron.
24 (2013) 4279–4283.
19. Zhu X., Zhang F., Wang M., Ding J., Sun S., Bao J., Gao C., Appl. Surf. Sci. 319 (2014) 83–89.
20. Rahmayeni,Arief S., Stiadi Y., Rizal R., Zulhadjri,Indones. J. Chem. 12 (2012) 229-234.
21. Mohammed H.A., Hamza A., Adamu I.K., Ejila A., Waziri S.M., Mustapha S. I, J. Chem. Eng. Mater. Sci.
4 (2013) 80-86.
22. Rameshbabu R., Kumar N., Karthigeyan A., Neppolian B., Mater. Chem. Phys. 181 (2016) 106–115.
23. Rahmayeni, Arisanti D., Stiadi Y., Jamarun N., Emriadi, Arief S., J. Chem. Pharm. Res. 7 (2015) 139-146.
24. Rahmayeni, Zulhadjri, Jamarun N., Arief S., Emriadi, Orient. J. Chem. 32 (2016) 1411–1419.
25. Jiang J., Ai L. H., Li L. C., Liu H., J. Alloys Compd. 484 (2009) 69–72.
26. Manikandan A., Sridhar R., Antony S. A., Ramakrishna S., J. Mol. Struct. 1076 (2014) 188–200.
27. Zhu H. Y., Jiang R., Fu Y.Q., Li R.R., Yao J., Jiang S.T., Applied surface science. 369 (2016) 1-10.
28. Welderfael T., Yadav O.P., Taddesse A.M., Kaushal J., Bull. Chem. Soc. Ethiop. 27 (2013) 221-232.
![Figure 8: The degradation of Congo red (a) in the presence and absence of catalyst and (b) pseudo first order reaction kinetics using NCPs [catalyst 15 mg, dye 25 mg/L]](https://thumb-ap.123doks.com/thumbv2/123dok/3592386.1453746/9.595.55.497.377.643/figure-degradation-presence-absence-catalyst-reaction-kinetics-catalyst.webp)
