DOI: 10.18196/jai.180285
Family Ownership and the Entrenchment Effect on
Intellectual Capital Utilization: A Study of High-Technology
Companies in Indonesia Dealing with the ASEAN Economic
Community (AEC)
Bima Cinintya Pratama* and Hardiyanto Wibowo
Prodi Akuntansi, Universitas Muhammadiyah Purwokerto, Jln. Raya Dukuh Waluh, Kembaran, Kabupaten Banyumas, Jawa Tengah 53182, Indonesia
A R T I C L E I N F O A B S T R A C T
Article history: received 25 Feb 2017 revised 09 Mei 2017 accepted 24 Jun 2017
At the end of 2015, the Association of Southeast Asian Nations (ASEAN) brought into being the ASEAN Economic Community (AEC). Due to the AEC, the firms in ASEAN should utilize their resources more effectively and efficiently, so that the firms can survive and grow despite strong competition in the AEC. Indonesia, as the country with the largest economy in the region, needs to address this issue so that companies in Indonesia can face the challenges resulting from the AEC. This study aimed to examine the positive relationship between the intellectual capital (IC) and the financial performance of high-technology (high-tech) companies that are listed on the Indonesia Stock Exchange, and also to examine whether the entrenchment effect of family ownership exists. This study was conducted from 2008 to 2014. The final sample used in this study consisted of 31 companies with a total of 144 observations. This study used a panel data regression model analysis. The results showed that, for a company, IC has a positive impact on financial performance. This result indicated that the efficient and effective use of their IC will help the firms to achieve higher financial performance, and will be useful for dealing with the AEC. There was no evidence that the entrenchment effect exists in the family ownership of high-tech companies in Indonesia and hampers the utilization of IC.
© 2017 JAI. All rights reserved Keywords:
Intellectual Capital; Family Ownership; Financial Performance; Entrenchment Effect; Firm
INTRODUCTION
At the end of 2015, the Association of Southeast Asian Nations (ASEAN) brought into being the ASEAN Economic Community (AEC). Although the AEC may improve the ASEAN and make it a more dynamic and competitive region, it will also cause the competition between firms in the ASEAN region to become increasingly com-petitive. This condition requires a firm to utilize its resources more effectively and efficiently, so that the firm can create added value and compete in the AEC.
The AEC gives opportunities and challenges for Indonesia to develop a quality economy in Southeast Asia to face the era of free market that began in late 2015. The AEC is like two sides of a coin for Indonesia. On the one hand, the AEC is a good opportunity for showing the quality and quantity of products and human resources of
Indonesia to other countries. On the other hand, it could be difficult for Indonesia to deal with the AEC if Indonesia is not ready. The AEC will be a good opportunity for Indonesia because the trade barriers will tend to diminish, perhaps even becoming non-existent. This will make it easier to export more, which in turn will increase the gross domestic product (GDP) of Indonesia. On the investment side, this condition can create a climate that supports the entry of foreign direct investment (FDI), which can stimulate economic growth through technology development, job creation, human resource development and easier access to the world market.
2
competition and also create added value, so that it can contribute to the firm’s success. Previous studies have attempted to examine the relationship between the IC and financial performance of a firm, but the results are still not consistent. The studies from Firer and Stainbank (2003), Chen et al. (2005), Tan et al. (2007), and Clarke et al. (2011) find that, for a firm, IC is positively related to financial performance. Meanwhile, Firer and Williams (2003), Chan (2009) and Maditinos et al. (2011) could not find any evidence to support the relationship between the IC and financial perfor-mance of companies. Due to the inconsistency in the results of the previous studies and also because of the limited number of studies that have been conducted in developing countries, parti-cularly in Indonesia, the purpose of this study is to examine the positive relationship between the IC and financial performance of the firms operating in the high-technology (high-tech) industry in Indonesia.
In addition, this study also tries to find new variables that could fill the research gap and that might explain why previous studies were not able to generate consistent results to explain the relationship between the IC and financial perfor-mance of firms. As described by Grant (1996), the proper organization and allocation is the key to utilizing the competitive advantage from IC. Keenan and Aggestam (2001) explain that the attitudes and skills of major shareholders are the keys for firm’s management, including for utilizing the IC. Claessens et al. (2000), and Carney and Child (2013) find that the ownership concen-tration for the firms in East Asia, including in the ASEAN, is mostly concentrated in family owner-ship.
Furthermore, the view expressed by the entrenchment effect states that the family, as con-trolling shareholders, will probably take personal advantage of the company at the expense of the minority shareholders (Fama and Jensen, 1983; Morck et al., 1988; Shleifer and Vishny, 1997). Therefore, the entrenchment effect predicts that the firms whose ownership structure is concen-trated in family ownership may be inefficient and ineffective in overseeing the activities undertaken by the management, including in overseeing the utilization of resources to maximize potential, which will cause the company to not be optimal in value creation. Therefore, the second objective of this study is to examine whether family ownership inhibits the utilization of IC to increase a firm’s financial performance.
This study uses a monetary measurement to measure the firm’s IC, namely the value added intellectual coefficient (VAIC) developed by Pulic (2000; 2004). This study focuses on the companies that are operating in the high-tech industry and are listed in the Indonesia Stock Exchange. This study is conducted based on a 7-year observation period, from 2008–2014. The high-tech industry was selected for this study because this industry relies on IC for its activities, so that the firms in this industry tend to invest substantially in IC. This study uses a panel data regression model (i.e. fixed effect and random effect regression). This study contributes to the literature by testing the impact of IC on the financial performance of the firms operating in the high-tech industry in Indonesia for dealing with the AEC. Furthermore, this study also contributes to the literature by testing the moderating effect of family ownership to see whether family ownership obstructs the positive relationship between the IC and financial performance of firms. No previous study in Indonesia has tested this.
LITERATURE REVIEW AND HYPOTHESES DEVELOPMENT
Resource-based Theory (RBT)
RBT serves as an important framework to explain and predict what is underlying for compe-titive advantage and firms’ financial performance (Barney et al., 2011). RBT explains that the creation of a sustainable competitive advantage is closely related to the firm’s ability to maintain valuable, rare and irreplaceable resources, also to allocate and deploy these resources effectively (Barney, 1991).
Kozlenkova et al. (2014) explain that the basic logic of this theory is based on two funda-mental assumptions regarding the firm’s resour-ces, and explain how these resources can generate a sustainable competitive advantage and why some firms consistently outperform the others. First, each firm has a different set of resources, even within the same industry (Peteraf and Barney, 2003). The assumptions regarding the hetero-geneity of these resources reveal that some firms have better expertise for completing certain acti-vities because they have unique resources (Peteraf and Barney, 2003). Second, the differences in resources will remain there due to difficulties in exchanging resources between firms (the resource
immobility assumption), which will lead to the advantage of the heterogeneity of these resources continuing to occur from time to time (Kozlen-kova et al., 2014).
In order to understand the sources of a competitive advantage, firms may analyse their internal environments. One such tool that is used to analyse firm’s internal resources is the valuable, rare, imperfectly imitable, organization (VRIO) analysis. The tool was originally developed by J. B. Barney (1991) in his work ‘Firm Resources and Sustained Competitive Advantage’, where the author identifies four attributes that firm’s resources must possess in order to become a source of sustained competitive advantage. The VRIO framework shows the four conditions used to assess what potential a resource has to be able to generate sustainable competitive advantage (Kozlenkova et al., 2014). The following are the criteria of the VRIO framework:
a. Valuable
The first question of the framework asks if a resource adds value by enabling a firm to exploit opportunities or defend itself against threats. If the answer is yes, then a resource is considered to be valuable. Resources are also valuable if they help organizations to increase the perceived customer value. This is done by increasing differentiation and/or decreasing the price of the product. The resources that cannot meet this condition lead to a competitive disadvantage. It is important to conti-nually review the value of the resources because constantly changing internal or external conditions can make them less valuable or completely use-less.
b. Rare
Resources that can only be acquired by one or very few companies are considered rare. Rare and valuable resources grant a temporary com-petitive advantage. On the other hand, the situa-tion where more than a few companies have the same resource or use the capability in a similar way leads to competitive parity. This is because firms use identical resources to implement the same strategies and no organization can achieve superior performance. Even though competitive parity is not the desired position, a firm should not neglect the resources that are valuable but common. Losing valuable resources and
capabi-lities would hurt an organization because they are still essential for staying in the market.
c. Imperfectly imitable
A resource is imperfectly imitable if other organizations that doesn’t have that resource can’t imitate, buy or substitute it at a reasonable price. Imitation can occur in two ways: by directly imitating (duplicating) the resource or providing a comparable product/service (substituting). A firm that has valuable, rare and costly-to-imitate resources can (but not necessarily will) achieve a sustained competitive advantage. Barney identifies three reasons why resources can be hard to imitate:
1) Historical conditions. Resources that were developed due to historical events or over a long period are usually costly to imitate. 2) Causal ambiguity. Companies can’t identify
the particular resources that are the cause of their competitive advantage.
3) Social Complexity. The resources and capabilities that are based on a company’s culture or interpersonal relationships.
d. Organization
The resources themselves do not confer any advantage for a company if it’s not organized to capture the value from them. A firm must orga-nize its management systems, processes, policies, organizational structure and culture to be able to fully realize the potential of its valuable, rare and costly-to-imitate resources and capabilities. Only then can the companies achieve a sustained com-petitive advantage.
Based on the previous explanation, according to the RBT, IC has great potential to meet the VRIO characteristics, so it can create a compe-titive advantage for the firm. Firms can use the competitive advantage from IC to compete in a competitive market and achieve optimal perfor-mance.
Value Added Intellectual Coefficient (VAIC)
4
components (Pulic, 2000). One of the important concepts of VAIC is the corporate intellectual ability that refers to the efficiency of the total value creation produced by two types of resource, namely IC resources and physical resources, which work simultaneously in the business envi-ronment (Pulic, 2004). The basic assumption of VAIC is that the IC itself cannot operate inde-pendently without the support of financial and physical capital (Pulic, 2004). VAIC is a combi-nation of several components or elements, namely human capital efficiency, structural capital efficien-cy and physical capital efficienefficien-cy.
Several studies and literature show that VAIC is a promising measurement mechanism for measuring IC. Firer and Williams (2003) mention the advantages of the VAIC method, namely that VAIC provides a consistent and standardized measurement basis that allows an effective comparative analysis between firms and between countries; the data used in the VAIC calculation is based on data in the financial statements that have been audited so that the calculation will be more objective. In addition, the VAIC also has been used in several studies with different industry settings that are listed in the various countries’ stock exchanges; for example, the Johannesburg Stock Exchange, Taiwan Stock Exchange, Singapore Exchange, Hong Kong Stock Exchange, Athens Stock Exchange, Australian Stock Exchange and Tehran Stock Exchange (Firer and Williams, 2003; Chen et al., 2005; Tan et al., 2007; Chan, 2009; Maditinos et al., 2011; Clarke et al., 2011). The literature also indicates that the VAIC has been used in the study of developing countries, such as Taiwan, Greece and South Africa to examine the relationship between the IC and financial performance of companies (Chen et al., 2005; Maditinos et al., 2011; Firer and Williams, 2003).
Family Ownership
Several studies that examine ownership structure demonstrate that family ownership is the most dominant form of ownership structure in East Asian firms. Claessens et al. (2000) find that in East Asian countries, including those in ASEAN, family ownership accounted for more than half of the ownership. Meanwhile, a recent study from Carney and Child (2013) also states that, although much has changed since Claessens et al. (2000) study, family ownership is still the
most dominant form of ownership structure in East Asia.
It has a vast impact on the agency conflict between owners and managers. New insights about this ownership structure require a careful analysis to determine the consequences of family ownership on a firm’s financial performance. Wang (2006) describes one of the two views about the position of the family ownership structure in supervising the activities undertaken by the management, which is the entrenchment effect view.
The entrenchment effect is a view stating that concentrated ownership could provide incentives for the controlling shareholders to expropriate the wealth of the other shareholders (Fama and Jensen, 1983; Morck et al., 1988; Shleifer and Vishny, 1997). In other words, the entrenchment effect reveals that the family, as controlling share-holders, will probably take personal advantage of the firm at the expense of the minority share-holders. Therefore, the entrenchment effect pre-dicts that the family ownership of the firm may be inefficient and ineffective in supervising the active-ties undertaken by management, including super-vising the utilization of resources to maximize po-tential, which will cause the firm to not be optimal in its value creation.
Intellectual Capital (IC) and Financial Performance of Firms
IC could act as an important part of creating value and sustainable growth for the firm. This is in line with the RBT, which explains that IC serves as the core of the value creation and competitive advantage of the firm (Barney, 1991). From the perspective of the RBT, creation of a sustainable competitive advantage is closely related to the firm’s ability to maintain asset resources that are valuable, rare and irreplaceable, and also to allocate and deploy these resources effectively (Barney, 1991). A sustainable competitive advan-tage can make the firms that have it able to beat the competition in the market or industry, so that they can create value and achieve optimal financial performance.
Several previous studies have managed to examine and find the relationship between the IC and financial performance of firms. Chen et al. (2005) observe that the IC owned by a firm has a positive effect on market value and the firm’s financial performance, and also can be an indi-cator for future financial performance. Meanwhile,
Clarke et al. (2011) also indicate that there is a direct relationship between the IC and financial performance for firms listed in the Australian Stock Exchange. Several other studies also find evidence that IC has a positive impact on a firm’s financial performance (Tan et al., 2007; Firer and Stainbank, 2003). Based on this explanation, the hypothesis proposed in this study is as follows: H1: Intellectual capital (IC) has a positive
rela-tionship with the financial performance of firms operating in high-tech companies in Indonesia.
Intellectual Capital (IC), Family Ownership and Financial Performance of Firms
A firm’s ability to grow and develop depends on its ability to use any available resources appro-priately, including financial, physical and intellect-tual resources. Although the firm’s resources can be in the form of capital or financial resources, the intellectual resources are at the core of each firm.
Consistent with the statement from Grant (1996), IC will not be able to provide an optimal competitive advantage without the proper organi-zation and allocation of the resources. According to the RBT, the firm’s ability to organize and manage resources nicely is one of the main requirements for the firm to be able to create a competitive advantage from these resources. The shareholders of the firm are mostly responsible for supervising the management of the firm’s activities, including the activities for managing IC. As described by Keenan and Aggestam (2001), the attitudes and expertise of the substantial share-holders of the firm are the keys to the implement-tation and accountability of the firm’s management for guiding the development, maintenance and improvement of IC in the firm.
The previous studies from Claessens et al. (2000), and Carney and Child (2013) describe that firms in East Asia, including those in ASEAN, are firms in which ownership is concentrated predo-minantly in family ownership. As a result of the entrenchment effect on the family ownership of firms (Fama and Jensen, 1983; Morck et al., 1988; Shleifer and Vishny, 1997), the family as control-ling shareholders will probably take personal advantage of the firm at the expense of the mino-rity shareholders. Therefore, the entrenchment effect predicts that family ownership of the firm may be inefficient and ineffective in supervising the activities undertaken by management, inclu-ding in supervising the utilization of resources to
maximize potential, which will cause the firm to not be optimal in its value creation. Based on these explanations, the hypothesis that is proposed is as follows:
H2: Family ownership weakens the positive rela-tionship between the intellectual capital (IC) and financial performance of firms operating in high-tech companies in Indonesia.
RESEARCH METHODS
Sample
The sample in this study contains firms that are engaged in high-tech industries that are listed on the Indonesian Stock Exchange. The type of industry that is considered to be a high-tech indus-try is based on the industrial classification based on the Standard Industrial Classification (SIC), namely the following:
1) Computer hardware (SIC codes 3570-3579) 2) Electronic and other electrical equipment
(SIC codes 3610-3699)
3) Photographic, optical and medical equipment (SIC codes 3810-3873)
4) Communications (SIC codes 4810-4899) 5) Computer software (SIC codes 7371-7379)
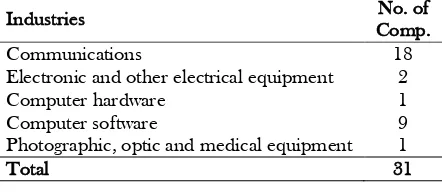
The initial sample consists of 38 firms with observations from years 2008 to 2014. Due to incomplete data on the variables selected, the final sample used in this study amounted to 31 firms with a total of 141 firm-year observations. Table 1 shows the final sample used and its distribution by industry.
Table 1. Sample Distribution Based on Industries
Industries No. of
Comp.
Communications 18
Electronic and other electrical equipment 2
Computer hardware 1
Computer software 9
Photographic, optic and medical equipment 1
Total 31
Variables
Independent Variable
6
by Pulic (2000; 2004). The VAIC is calculated using the following equation:
Where:
VAICt = Value added intellectual coefficient at t HCEt = VAt / HCt; human capital efficiency coefficient at t
SCEt = SCt / VAt; structural capital efficiency coefficient at t
CEEt = VAt / CEt; capital employed efficiency coefficient at t
VAt = OUTt - INt = OPt + ECt + Dt + At; VA is the calculation of output (OUTt) (calculated from total sales) reduced by Input (INt) (calculated from bought-in materials, or the cost of goods or services sold); it also can be calculated by adding operating income (OPt), employee costs (ECt), depreciation (Dt) and amortization (At)
HCt = total salaries and wages at t SCt = VAt - HCt; structural capital at t CEt = book value of the net assets at t
Dependent Variable
Financial Performance (Firm_Perf). Based on the studies from Chen et al. (2005) and Clarke et al. (2011), a firm’s financial performance is measured by the return on assets ratio (ROA). ROA is calculated using the following equation:
ROA = Profit before tax / Average total assets.
Control Variable
Firm Size (FSize). Firm size is measured by calculating the natural logarithm of the firm’s total assets at year t.
Leverage (Lev). Leverage is calculated by dividing long-term liabilities into total assets.
Years (Year). Years are proxied by dummy variables for each year of the study period minus one period.
Regression Model
According to Gujarati and Porter (2009), the research that uses panel data should be tested by a panel data regression model analysis, i.e. fixed effect regression or random effect regression. This study used panel data regression model analysis by
completing a Hausman test first to decide whether to use the fixed effect regression or random effect regression.
The hypotheses testing in this study used two equation models. Model 1 is used to examine the relationship between the IC and financial perfor-mance of firms (Hypothesis 1). Meanwhile, Model 2 is used to examine the interaction of IC and family ownership on the financial performance of firms (Hypothesis 2).
Hypothesis 1 is supported if the independent variable of Ⱦ1VAIC is positively significantly related to the ROA. Meanwhile, Hypothesis 2 is supported if the independent variable of
Ⱦ3VAIC*Fam_OWN is negatively significantly related to the ROA. The equation models used to test all of the hypotheses in this study are as follows:
Model 1. Model to test the relationship between the IC and Financial Performance of firms:
Model 2. Model to test the interaction of IC and Family Ownership on the Financial Performance of firms:
RESULTS AND DISCUSSIONS
Descriptive Statistics
Table 2 shows the descriptive statistics of the selected variables in this study. The ROA has a mean value of 0.1100, which indicates that the firms have a fairly good profitability. Meanwhile, the VAIC, which is the proxy of the firm’s IC has a mean value of 8.0824. The family ownership concentration is around 4.60%. Overall, the descriptive statistics of each variable can be seen in Table 2.
Hypotheses Testing
Hypotheses 1 of the study aims to answer the question whether IC has a positive impact on financial performance for high-tech companies that are listed on the Indonesia Stock Exchange. Table 3 details the results of the Hypothesis 1 test in this study.
Table 2. Descriptive Statistics of Selected Variables
Variabel Minimum Maximum Mean Median Std. Dev.
ROA 0.0010 0.8940 0.1100 0.0730 0.1200
VAIC 1.7129 51.8033 8.0824 6.2574 6.9931
Fam_OWN 0.0000 0.6647 0.0460 0.0000 0.1153
FSize 7.3985 16.2630 12.3579 12.5883 2.1230
Total Assets 1633.48 11558795.67 1198687.69 293182.03 2422921.854
Lev 0.0000 0.7180 0.2140 0.1800 0.1805
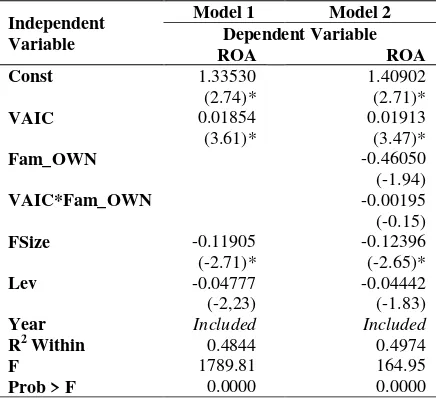
The results show that VAIC has a significant positive impact on ROA as the proxy of a firm’s financial performance with a coefficient equal to 0.01854 at a significance level of 5%. This indi-cates that if a firm can use its IC more efficiently, it can lead to improved financial performance for the firm. Therefore, Hypothesis 1, which states that IC has a positive impact on the financial performance for high-tech firms in Indonesia, is supported at the level of Ƚ = 5%.
As the result indicates that efficient and effective use of IC will facilitate a firm achieving higher financial performance, this means that in the era of the AEC, companies should be more aware of the need for efficient and effective use of IC so that they can face the challenges resulting from the AEC. The outcome of this study is consistent with previous studies conducted by Firer and Stainbank (2003), Chen et al. (2005), and Clarke et al. (2011), which confirm that IC is positively related to ROA, which is the proxy of a firm’s financial performance.
Hypothesis 2 of the study aims to answer the question whether family ownership obstructs the maximum utilization of IC by weakening the rela-tionship between the IC and financial perfor-mance of firms. The results of Hypothesis 2 tes-ting can be seen in Table 3. The results show that there is a negative relationship between the inte-raction variables VAIC*Fam_OWN and ROA, with a coefficient of -0.00195. However, this is not significant. Therefore, it is not able to provide evidence that the firms whose ownership structure is concentrated in family ownership may be inefficient and ineffective in utilizing the IC resources to maximize potential, which will cause the company to not be optimal in value creation and also in generating financial performance (as a result of the entrenchment effect, as previously mentioned). Therefore, Hypothesis 2, which states that family ownership can obstruct the positive relationship between IC and the financial performance of the firms operating in high-tech industries in Indonesia, is supported.
The failure to support Hypothesis 2 reveals that the entrenchment effect may not be applica-ble to all countries. In addition, previous studies, such as those by Fama and Jensen (1983), Morck et al. (1988), and Shleifer and Vishny (1997), observe that the entrenchment effect is found mostly in the setting of developed countries, so it may be different in Indonesia.
Table 3. Hypotheses 1 and 2 Results
Independent Variable
Model 1 Model 2 Dependent Variable
ROA ROA
Const 1.33530 (2.74)*
1.40902 (2.71)*
VAIC 0.01854 (3.61)*
0.01913 (3.47)*
Fam_OWN -0.46050
(-1.94)
VAIC*Fam_OWN -0.00195 (-0.15)
FSize -0.11905 (-2.71)*
-0.12396 (-2.65)*
Lev -0.04777
(-2,23)
-0.04442 (-1.83)
Year Included Included R2 Within 0.4844 0.4974
F 1789.81 164.95
Prob > F 0.0000 0.0000 Notes: * indicates significance at the 5%
CONCLUSIONS
8
positively related to the financial performance of firms.
Hypothesis 2 of the study aimed to answer the question whether family ownership obstructs the maximum utilization of IC by weakening the relationship between the IC and financial perfor-mance of firms. Hypothesis 2 is not supported, and it is revealed that the entrenchment effect (which may result in firms whose ownership structure is concentrated in family ownership being inefficient and ineffective in monitoring the activities undertaken by management, including overseeing the use of IC resources to maximize potential, causing the firm to not be optimal in utilizing IC to achieve better financial perfor-mance) may not be applicable to all countries. In addition, previous studies show the entrenchment effect is found mostly in the setting of developed countries, such as those covered by the studies of Fama and Jensen (1983), Morck et al. (1988), and Shleifer and Vishny (1997), so it may be different in Indonesia.
This study has several limitations. First, this study only used a sample of the firms that operate in the high-tech industry in Indonesia, so the results of this study may not be generalizable to the firms in other types of industry. Further re-search could use several firms from various indus-tries and compare them in order to determine the complete picture of the relationship between the IC and financial performance of firms from the standpoint of a more comprehensive range of industries.
Second, this study used the VAIC, which is a measurement of IC from the accounting infor-mation for the firm. Further research could use another proxy for measuring the firm’s IC by combining measurements of IC using monetary and non-monetary methods. Finally, the imple-mentation of the AEC in late 2015 meant this study could not test the differences in the impact of IC on the financial performance of firms between the period before the implementation of the AEC and after the enactment of the AEC because of data limitations. Further research could add comparisons of ex-ante and ex-post AEC implementations to examine the impact of IC on the financial performance of firms in the period prior to the enactment of the AEC and after the enactment of AEC.
REFERENCES
ASEAN. 2008. ASEAN Economic Community Blueprint. Jakarta: ASEAN Secretariat. Barney, J. B., D. Ketchen, and M. Wright. 2011.
The future of resource based theory: Revi-talization or decline?. Journal of Manage-ment, 37 (5), 1299–1315.
Barney, J. B. 1991. Firm resources and sustained competitive advantage. Journal of Manage-ment, 17 (1), 99-120.
Chan, K. H. 2009. Impact of intellectual capital on organisational performance: An empirical study of companies in the Hang Seng Index (Part 1). The Learning Organi-zation, 16 (1), 4–21.
Chan, K. H. 2009. Impact of intellectual capital on organisational performance: An empiri-cal study of companies in the Hang Seng Index (Part 2). The Learning Organization, 16 (1), 22-39.
Chen, M. C., S. J. Cheng, and Y. Hwang. 2005. An empirical investigation of the relation-ship between intellectual capital and firms’ market value and financial performance. Journal of Intellectual Capital, 6 (2), 159-176.
Carney, R. W. and T. B. Child. 2013. Changes to the ownership and control of East Asian corporations between 1996 and 2008: The primacy of politics. Journal of Financial Economics, 107 (2), 494–513.
Claessens, S., S. Djankov, and L. H. P. Lang. 2000. The separation of ownership and control in East Asian Corporations. Journal of Financial Economics, 58 (1-2), 81-112. Clarke, M., D. Seng, and R. H. Whiting. 2011.
Intellectual capital and firm performance in Australia. Journal of Intellectual Capital, 12 (4), 505-530.
Fama, E. and M. C. Jensen. 1983. Separation of ownership and control. Journal of Law and Economics, 26 (2), 301–325.
Firer, S. and L. Stainbank. 2003. Testing the relationship between intellectual capital and a company’s performance: Evidence from South Africa. Meditari Accountancy Research, 11 (1), 25–44.
Firer, S. and S. M. Williams. 2003. Intellectual capital and traditional measures of corpo-rate performance. Journal of Intellectual Capital, 4 (3), 348–360.
Grant, R. M. 1996. Toward a knowledge based theory of the firm. Strategic Management Journal, 17 (2), 108-122.
Gujarati, D. N. and D. C. Porter. 2009. Basic Econometrics 5th
edition. New York: McGraw Hill/Irwin.
Keenan, J. and M. Aggestam. 2001. Corporate governance and intellectual capital: some conceptualisations. Corporate Governance: An International Review, 9 (4), 259-275. Kozlenkova, I. V., S. A. Samaha, and R. W.
Palmatier. 2014. Resource-based theory in marketing. Journal of the Academy of Marketing Science, 42 (1), 1–21.
Maditinos, D., D. Chatzoudes, C. Tsairidis, and G. Theriou. 2011. The impact of intellectual capital on firms' market value and financial performance. Journal of Intellectual Capital, 12 (1), 132–151. Morck, R., A. Shleifer, and R. Vishny. 1988.
Management Ownership and Market Valuation: An Empirical Analysis. Journal of Financial Economics, 20 (1-2), 293-315. Peteraf, M. and J. B. Barney. 2003. Unraveling
the resource-based tangle. Managerial and Decision Economics, 24 (4), 309–323. Pulic, A. 2000. VAIC: an accounting tool for IC
management. International Journal of Technology Management, 20 (5-8), 702-714.
Pulic, A. 2004. Intellectual capital - does it create or destroy value?. Measuring Business Excellence, 8 (1), 62-68.
Shleifer, A. and R. Vishny. 1997. A Survey of Corporate Governance. Journal of Finance, 52 (2), 737-783.
Tan, H. P., D. Plowman, and P. Hancock. 2007. Intellectual Capital and Financial Returns of Companies. Journal of Intellectual Capital, 8 (1), 76-95.