Jurnal Administrasi Bisnis (JAB)|Vol. 55 No. 1 Februari 2018| administrasibisnis.studentjournal.ub.ac.id
214
THE INFLUENCE OF BRAND AWARENESS AND PRODUCT ATTRIBUTE
TOWARD PURCHASE DECISION
(Study on the Undergraduate Students of Administrative Science Faculty of 2014 Batch as
Samsung Smartphone Consumers and Users Customer)
Syauqi Kessa Anwar Andriani Kusumawati
Brillyanes Sanawiri Fakultas Ilmu Administrasi
Universitas Brawijaya Malang
Email: [email protected]
ABSTRAK
Tujuan dari penelitian ini adalah: memahami dan menjelaskan pengaruh kesadaran brand terhadap keputusan pembelian secara parsial, memahami dan menjelaskan pengaruh atribut produk terhadap keputusan pembelian, memahami dan menjelaskan pengaruh antar kesadaran brand dan atribut produk terhadap keputusan pembelian secara serentak. Hasil penelitian menunjukkan bahwa: (1) kesadaran brand berpengaruh signifikan terhadap keputusan pembelian secara parsial, (2) atribut produk berpengaruh signifikan terhadap keputusan pembelian secara parsial, (3) kesadaran brand dan atribut produk berpengaruh signifikan terhadap keputusan pembelian secara serentak. Berdasarkan nilai F dan nilai gran mean yang bersifat dominan, kesadaran brand berpengaruh besar terhadap keputusan pembelian. Berdasarkan faktor diatas, pihak Samsung harus meningkatkan kinerja dari kesadaran brand.
Kata Kunci: Kesadaran Brand, Produk Atribut, Keputusan Pembelian.
ABSTRACT
The purposes of this research are aimed: to understand and explain the partial influences of brand awareness toward purchase decision, to understand and explain the partial influence of product attribute toward purchase decision, to understand and explain the simultaneous influence of both brand awareness and product attribute toward purchase decision. The result of the study showed that: (1) brand awareness is significantly influenced toward purchase decision partially (2) product attribute is significantly influenced toward purchase decision partially (3) brand awareness and product attribute are significantly influenced toward purchase decision simultaneously. Based on F value and the dominant gran mean result, Samsung should developed the potential of brand awareness.
Jurnal Administrasi Bisnis (JAB)|Vol. 55 No. 1 Februari 2018| administrasibisnis.studentjournal.ub.ac.id
215 INTRODUCTION
Along with the development of time, the activity of business became the supporting activities
toward the people’s need, especially which related
with marketing of a products. According to Kotler
and Keller (2009:5), “marketing is the functional
part of organization and the structured process to create, to communicate and to give a value to the customers to manage the relationship between
consumers”.
Based on the aforementioned definition above, the marketing activity contributes the value to the customer and also the activity of a corporation to communicate with the consumers. Eventually makes marketing as one of important activity that related with the communication between corporation and consumers.
According to Aaker (2008:39), “brand
awareness is the ability of consumer to recognize or
remember that a brand is a part of certain product”.
From the definition above, consumers are able to recognize the product through the brand recognition process. Brand awareness appears to be useful for both consumers and companies. For the benefit of the company, brand awareness makes consumer always remember the product. For the benefit of consumers, the consumers are able to give recommendation to their friends as the result of their recognition of the company brand.
Tjiptono (2008:103) explained product attribute as the important element of the product to the consumer and also become the basic of purchase decision. Based on the definition of the product attribute above, product attribute is the indicator of the product benefit that offered by the company in
order to fulfill the consumer’s favor of their needs.
According to Kotler and Armstrong (2008:152), "Purchase decision is implied when the customer noticed a product that comes from the brand awareness and product attribute, for example, the consumers made their purchase decision based on their ability to recognize the brand from the popular brand name, also followed by the interesting product attribute that able to persuade
the consumer”. commodity of people needs, unexceptionally Samsung smartphone.
Top Brand Award survey for teen’s
segmentation in 2016 described that Samsung mobile phone is one of the most popular brand of mobile phone until today, especially for the younger consumer such as young adult and teenager. The Top Brand Award is a form of appreciation to the brands that are categorized as a top brand.
Top brand is given to brands in certain product categories that meet the top criteria. A top criterion is based on a survey conducted by Frontier Consulting Group.
LITERATURE REVIEW
Brand Awareness
According to Aaker (1991), "brand awareness is the capability of the consumers where they are able to recognize or to memorize that the brand is the part of a certained product". Brand awareness is the way of consumer to notice the brand and try to recall the brand by memorizing the brand from the certained product itself.
Aaker (2008:40) has divided level of brand awareness into four levels, aternately level of awareness described as pyramid of brand awareness. These levels are mentioned below: a. Unaware of Brand
b. Brand Recognition c. Brand Recall d. Top of Mind
Product Attribute
According to Tjiptono in Fahruddin (2008:103), "product attribute is the element of the product that considered as an important factor to the consumer and become the basic of purchase decision. Product attribute including brand, packaging, guarantee and service". It concluded from the previous description that product attribute is the feature of a product that serves as purchase decision maker for the consumer.
These are the component of Product attribute as followed below:
Jurnal Administrasi Bisnis (JAB)|Vol. 53 No. 1 Desember 2017|
1.1 Containment and Protection 1.2 Usage
1.3 Communication 1.4 Segmentation
1.5 Channel Cooperation 1.6 New Product Planning f. Warranty (individual) and organizatioal consumers (Industrial consumer, Broker consumer, Business consumer). According to Kotler and Armstrong (2008:13)
“consumer purchase decision is purchase the most preffered brand, the brand most likely to be purchased by consumers”.
Based on the definition above, Purchase
decision is based on the consumer’s activity to make
a purchase based on preferred brand. Purchase decision is also divided based on the type of consumers, the following types are the end consumer or individual consumer and organizational consumer.
The following steps are the process of purchase decision making, (Kotler: 1985):
a. Problem Recognition b. Information Search c. Evaluation of Alternate d. Purchase
e. Post-purchase Behavior
The decision of consumer to make a purchase was actually a collection of several decisions. Kotler (2000: 109) described that there are seven components that makes as purchase decision structures:
a) Type of Products b) Form of Products c) Brand of Choices d) Dealer Choices
e) The Amount of Purchases f) The Timing of Purchases g) Payment Method Choices
The Relationship Between Brand Awareness, Product Attribute, and Purchase Decision
Brand awareness is the consumer's ability to identify (recognize or recall) the brand within the category, in sufficient detail to make purchase. Recognition is easier to achieve than recall, Kotler and Keller (2009:517). Usually, the consumer would buy a product that came from the well known brand. On the other hand, some of consumers would avoid the well known brand because the assumption of the brand is already known.
Brand awareness is one of the media for samsung to make their smartphone product could be remembered by the consumer. The consumer not only able to recognize which android mobile phone brand that known by consumer, but also give a chance to the consumer to make their purchase decision.
It implied in advertising recall in Aaker (2008:47), "brand awareness is influenced by advertising recall that will affect the purchase decision". Therefore, the power of brand awareness is also increased through advertisement recall of the consumer's memory regarding with the brand.
From the perspective of the product attribute, Stanton, Etzel and Walker (1991:167) described product as a set of tangible and intangible attributes, including packaging, color, price quality and brand. A brand of the product is a part of the product itself, it would affect the brand where the product could affect the purchase decision of the consumer besides brand awareness.
Conceptual Framework
H1
H3
H2
Jurnal Administrasi Bisnis (JAB)|Vol. 53 No. 1 Desember 2017|
H1: Brand awareness has a significant effect on purchase decision of samsung mobile phone partially.
H2: Product attribute has a significant effect on purchase decision of samsung mobile phone partially.
H3: Brand awareness and product attribute have an effect on purchase decision of Samsung mobile phone simultaneously.
METHODOLOGY Type of Research
This research uses an explanatory research method. Singarimbun and Effendi (1995:4) described explanatory research as a research that explained the casual relationship between variable researches and the hypothesis that has already designed previously. Based on the description above, explanatory research is the type of research with an explanation approaching.
The Location of Research
The research was held in Faculty of Administration Science (FIA) Brawijaya University (UB) that located in the cluster of Brawijaya University in Jl.MT.Haryono No.6, Malang. East Java. The reason for selecting this location is because the user of samsung smartphone came from the largest uprising segmentation for young adult users from 2012 to 2015 according to TBA index that previously mentioned in chapter I.
Population and Research
The population of this research is based on the undergraduate student of Brawijaya University that served as the consumers and also the users of Samsung Smartphone, Faculty of Science Administration from batch of 2014, Faculty of Science Administration from batch of 2014.
According to Arikunto (2002:108),
“population is a whole research subjects”. Sekaran
(2006:121) described population as “a whole group of peoples, events or the interest of the researchers’
investigation.” From the definitions above, population is a group of an object, mostly a group of peoples that used as an object of the researchers investigation.
The sample of this research is the based on the population of undergraduate student of Administration Science Faculty of Brawijaya University, specifically came from 2014 batch. The total of sample was chosen from 94 population out of 1061 FIA college students. The technique of sample gathering that used in this research was based on
Slovin’s formula, Sarjono and Julianita (2011:30). The following formula is listed below:
n =
The Description of Respondent Characteristic
Table 1 Distribution of Responden Based on Genders
No Gender Amount Percentage
(%) respondents (59%), while male respondents are populated less than female respondents, only 35 repsondents out of 94 respondents that representated in this research (37.2%). Based on income characteristic, it concluded that most of the respondents own Rp.1.500.000 as an average income, which shows 51 respondents out of 94 respondents (54.3%). On the other hand, 43 respondents out of 94 respondents own Rp.1.000.000 as an average income (45. 7%)
The Description of Research Independent Variable (X1) Result.
Consumer recognizing the brand item has mean value that equals 3.94 that located between class interval > 3.4 – 4.2 and categorized as fine category. Based on the mean item (X1.2.1), it concluded that most of Samsung Smartphone users agreed toward consumer recognizing the brand from advertisement item.
Jurnal Administrasi Bisnis (JAB)|Vol. 53 No. 1 Desember 2017| administrasibisnis.studentjournal.ub.ac.id
218 disagreed, 11 respondents (11.7%) undetermined, 46
respondents (48.9%) agreed, 31 respondents (33%) strongly agreed.
The Description of Research Independent Variable (X2) Result.
Based on descriptive analysis of (� ) Description, it described that the longetivity of the product (X2.1.1) item has a mean that equals 3.67 which located between class interval > 3.4 – 4.2 and categorized as fine category.
Based on the mean item (X2.1.1), it concluded that most of Samsung Smartphone users agreed toward the longetivity of the product. The longetivity of the usage
The Description of Research Dependent Variable (Y) Result.
Based on descriptive analysis of (Y.1.1), the item of purchase products according to the needs (Y1.1) has a mean that equals 3.90 which located bwtween class interval > 3.4 – 4.2 and categorized as fine category. Based on mean item (Y1.1), it concluded that most of Samsung Smartphone are agreed the purchase products according to the needs item.
The purchasing products activity that have quality item (Y1.2) has a mean that equals 4.04 which located between class interval > 3.4 – 4.2 and categorized as fine category. Based on mean item (Y1.2), it concluded that most of Samsung Smartphone users agreed toward purchasing products activity that have quality item.
Multiple Regression Analysis Result
In order to provide the result of multiple linear regression test, classical assumption is available as supporting instruments. These instruments are always to be required in every classical assumption test. These are the following instruments: Normality test, Multi-collinearity test and Heteroscedacity test.
1) Normality test
Based on the diagram below, it concluded the grains that represented each datas are distributed according to the directed diagonal line of the chart above.
If the grains of the datas showed a pattern that closed with the diagonal line, the pattern of the data distribution is considered as a normal data
distribution. Therefore, the spread of the data below is fulfilled to acquire a normal assumption.
Figure 2: P-plot Diagram of Normality test.
2) Mulit-Collinearity Test
Multi-Collinearity test is required in order to determine the regression mode if the correlation problem was detected inside the regression model. A good model of regression should be avoid the correaltion between both the independent variables. Based on the table below, the following tolerances between brand awareness and product attribute are .788 respectively. If the value of tolerance more than 0.1, the multi-collinearity is not available toward both independent variables. Therefore, there is no multi-collinearity between brand awareness and product attribute.
Table 2 Multi Collinearity Test Result
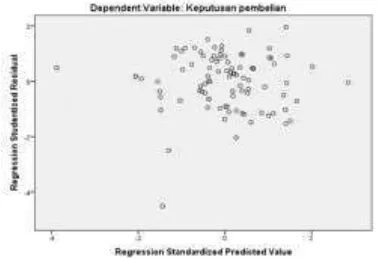
3) Heteroscedacity Test
Heteroscedacity test is required to determine the regression model whether the there is the dissimiliarity of residual deviation values due to the size of the value of one of independent variable or, the differences between variance value with the increasing numbers of value of independent variables is spotted on the mark. The Heteroscedacity test is conducted with test scatter plot.
The following graphic is the result of this research heteroscedacity test:
Variable
Collinearity Statistics Tolerance VIF 1
Jurnal Administrasi Bisnis (JAB)|Vol. 53 No. 1 Desember 2017| administrasibisnis.studentjournal.ub.ac.id
219
Figure 3: The Result of Heteroscedacity Test.
Based on analysis condition according to Ghozali (2006:109), if a distributed datas formed into a specific pattern, the heteroscedascity does exist. However, if a spreaded data did not formed into a specific pattern, instead the spreaded point that distributed above and below zero on the Y axis. The heteroscedascity does not exist. Based on the figure above, the spreaded point was distributed above and below zero on the Y axis. And also it did not make a specific pattern. This concluded that there is no heteroscedacity inside of this research.
Multiple Regression Analysis Result
Table 3: The Summary of Multiple Linear Regression Test
Variabel B Tvalue Significant Description
Constant 12.500
� (Brand Awareness)
0.284 2.603 0.008 Significant
� (Product Attribute)
0.455 5.419 0.000 Significant
R = 0.760
R Square = 0.578
Adjust R Square = 0.334
F-change = 20.779 F-table = 4.7816
Probability = 0.000
α = 0.050
n = 94
Based on description of table above, the model of regression has been found as followed below :
Y = 12.500 + 0.284 X1 + 0.455 X2
The Interpretations of regression model are mentioned below :
1) a = the constant value is about 12.500. Which means the coefficient regression shows that without any influence of independent variables toward variable (Y), the total score of variable
(Y). In other word, (Y) variable is purchase decision.
2) B1 = the coefficient regression of Brand
Awareness variable (� ) is about 0.284. The coefficient that has been obtained is a positive coefficient if there is any increasing movement toward variable � (Brand Awareness), the variabel Y (Purchase Decision) will also increased. On the other hand, if there is any decreasing movement toward variable � (Brand Awareness), the variable Y (Purchase Decision) will also decreased.
3) B2 = the coefficient regression of Product
Attribute (� ) is about 0.455. The coefficient that has been obtained is a positive coefficient if if there is any increasing movement toward variable � (Product Attribute), the variabel Y
(Purchase Decision) will also increased. On the other hand, if there is any decreasing movement toward variabel � (Product Attribute), the variable Y (Purchase Decision) will also decreased.
Hypothesis Test
1. T Test (Partial test)
Table 4: The Result of Hypothesis T Test
Variable T
value Sig. T Description
a. � Y 2.603 0.008 Significant b. � Y 5.419 0.000 Significant Decision choices:
H0 rejected if Tvalue with significant value < α
H0 accepted if Tvalue with significant value > α
From the Description of Table 4 above, here is the following description :
a) The result of t test between Brand Awareness (� ) and Purcase Decision (Y) showed tvalue =
2.603, and the value of sig t equal 0.008. The result shows that significant T value is smaller than α (0.05). The result of test showed that H0
is accecpted and also concluded that variable
� (Brand Awareness) is significantly influenced toward variable Y (Purchase Decision) and the sum of the influence is equal to 0.284 (28.4%).
b) The result of t test between Product Atribute ( � ) and purchase decision (Y) showed Tvalue
Jurnal Administrasi Bisnis (JAB)|Vol. 53 No. 1 Desember 2017| administrasibisnis.studentjournal.ub.ac.id
220 0.000. The result shows that the significant T
value is smaller than α (0.05). The of test showed that H0 is rejected and it concluded that
variable � (Product Attribute) is significantly influenced toward variabel Y (purchase decision) and the sum of the influence is equal to 0.730 (73%).
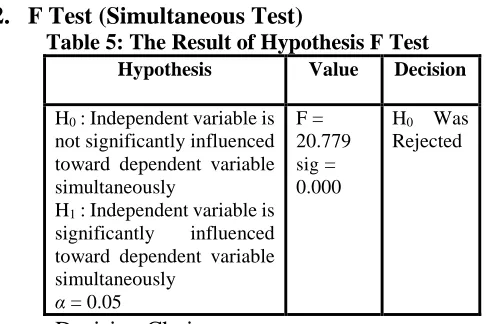
2. F Test (Simultaneous Test)
Table 5: The Result of Hypothesis F Test
Hypothesis Value Decision
H0 : Independent variable is
not significantly influenced toward dependent variable simultaneously
H1 : Independent variable is
significantly influenced toward dependent variable simultaneously
H0 rejected if Fvaluewith Significant value < α
H0 accepted if Fvaluewith Significant value > α.
Based on the result of F Test table above, it is implied that Fvalue equals 20.779, sig F equals (0.000)
≤ α = 0.05. Therefore H0 is rejected. Which means
that independent variables � (Brand Awareness) and � (Product Attribute) are significantly influenced toward dependent variable Y (Purchase Decision) simultaneously.
CONCLUSION AND SUGGESTION Conclusion
This resesarch is conducted in order to observe which variables that has an influence toward Purchase Decision. In this research, the independent variables that selected for this research are Brand Awareness (� ) Product Attribute (� ), while the dependent variable that used for this research is purchase decision (Y). Based on the multiple linear regression, it concluded that:
1. Brand Awarenss (� ) is partially influenced toward Purchase Decision (Y) significantly. 2. Atrtibute Product (� ) is partially influenced
toward Purchase Decision (Y) significantly. 3. Brand Awareness (� ) Product Attribute (� ) are
simultaneously influenced toward Purchase Decision (Y) significantly.
Suggestion
Based on the conclusion above, there are few suggestions than purposed to the Samsung as one of Smartphone brand that hopefully useful whether for Samsung or the users of Samsung Smartphone along with the other parties that related with this research. Amongst the suggestions are followed as:
1. Based on the result of Brand Awareness Research and Product Attribute through questionnaire distribution, it concluded that Brand Awareness is already well-adjusted. Therefore, Samsung should hold this achievement and develop the Brand Awareness toward and Product Attribute toward whole consumers. Samsung should focus their improvement in Brand Awareness factors due to weaker influence toward purchase decision such as brand recognition and the top of mind factors. 2. Based on the result of research, it suggested for the future researchers to elaborate the research that similar with this research by using a different variables outside of this research with these subjects.
REFERENCES
Aaker, David. 1991. Managing Brand Equity: Capitalizing on the Value of a Brand Name. Free Press.
___________. 2008. Manajemen Ekuitas Merek: Memanfaatkan Nilai dari suatu Merek. Cetakan Ketiga. Jakarta: Penerbit Mitra Utama.
Arikunto, Suharsimi. 1996. Manajemen Penelitian. Jakarta: Rineka Cipta
Evans, Joel R. and Barry Berman. 1997. Marketing,
Seventh Edition. New Jersey, Prentice Hall.
Keller, Kevin Lane (2001). Building Customer-Based Brand Equity: A Blueprint for
Creating Strong Brand. Cambridge,
Marketing Science Institute.
Kotler, Philip. 1988. Marketing Management. Sixth Edition. New Delhi, Prentice-Hall of India.
Jurnal Administrasi Bisnis (JAB)|Vol. 53 No. 1 Desember 2017| administrasibisnis.studentjournal.ub.ac.id
221 ___________ and Kevin Lane Keller. 2007.
Manajemen Pemasaran, Jilid 1. PT Indeks Kelompok Gramedia: Jakarta.
Laforge, Raymond W, William O. Bearden and Thomas N. Ingram. Marketing: Principles & Perspectives. McGraw Hill Irwin: Boston.
Lupiyoadi, Rambat and A. Hamdani. (2011).
Manajemen Pemasaran Jasa. Jakarta:
Salemba Empat.
Malhotra, Naresh K. 2006. Riset Pemasaran: Pendekatan Terapan Jilid 2. Jakarta: PT. Indeks.
Simamora, Henry. 2000. Manajemen Pemasaran Internasional. Jilid II. Penerbit Salemba Empat, Jakarta.
Sarjono, Haryadi and Winda Julianita. 2011. SPSS vs LISRLER, Sebuah Pengantar, Aplikasi untuk Riset. Jakarta: Salemba Empat.
Sekaran, Uma. 2006. Metodologi Penelitian untuk Bisnis. Jakarta: Salemba Empat