ANALYSIS OF WAVEFORM RETRACKING METHODS IN ANTARCTIC ICE
SHEET BASED ON CRYOSAT-2 DATA
XIAO Fenga,b LI Feia,b,* ZHANG Shengkaia,b,* HAO Weifenga,b YUAN Lexiana,b ZHU Tingtingc ZHANG Yua,b
ZHU Chaohuia,b
a
Chinese Antarctic Center of Surveying and Mapping, Wuhan University, Wuhan 430079, China
b Collaborative Innovation Center for Territorial Sovereignty and Maritime Rights, Wuhan 430079, China
c State Key Laboratory of Information Engineering in Surveying, Mapping and Remote Sensing, Wuhan University, Wuhan
430079, China
KEY WORDS: CryoSat-2; waveform retracking; Antarctic; ice sheet; satellite altimetry
ABSTRACT:
Satellite altimetry plays an important role in many geoscientific and environmental studies of Antarctic ice sheet. The
ranging accuracy is degenerated near coasts or over nonocean surfaces, due to waveform contamination. A postprocess
technique, known as waveform retracking, can be used to retrack the corrupt waveform and in turn improve the ranging
accuracy. In 2010, the CryoSat-2 satellite was launched with the Synthetic aperture Interferometric Radar ALtimeter (SIRAL)
onboard. Satellite altimetry waveform retracking methods are discussed in the paper. Six retracking methods including the
OCOG method, the threshold method with 10%, 25% and 50% threshold level, the linear and exponential 5-β parametric
methods are used to retrack CryoSat-2 waveform over the transect from Zhongshan Station to Dome A. The results show that
the threshold retracker performs best with the consideration of waveform retracking success rate and RMS of retracking
distance corrections. The linear 5-β parametric retracker gives best waveform retracking precision, but cannot make full use
of the waveform data.
1. INTRODUCTION
Satellite altimetry is used to detect the earth and its
variation precisely and periodically on a large scale. The
satellite altimetry data are widely used to study the earth
gravity field model, mean sea level, oceanic tidal model
and seabed topography. In Polar Regions, satellite
altimetry has proven to be a valuable tool for many
geoscientific and environmental studies. It can, for
example, be used for ice sheet mapping and mass balance
study (Bamber et al. 2009, Zhang et al. 2015, Li et al.
2016). It is also used to detect sea ice changes in polar
areas (Yuan et al. 2016).
However, the echo waveforms of altimetry impulse are
often contaminated by the coastal terrain, islands,
oceanic tide, geophysical conditions and hardware delay
over nonocean areas. This kind of waveform is so
irregular that the distance between the altimetry satellite
and its nadir point cannot be precisely estimated from the
waveforms. In order to calculate precise distances, the
middle point of waveform leading edge should be
repositioned, then the distance correction should be
reestimated by comparing the retracked middle point of
leading edge and the pregiven gate, which is called the
waveform retracking technique of radar satellite
altimetry.
The European Space Agency’s (ESA) satellite CryoSat-2,
launched in April 2010, carries a radar altimeter named
(SIRAL) (Wingham et al 2006). CryoSat-2 provides
altimetry data up to a latitude of 88° S/N, which is a
significant improvement to previous satellite borne
altimeters. The narrow across-track spacing of 2.5 km at
70° and 4 km at 60° deliver high data coverage at the
margins of the ice sheet. This is an improvement
compared to the coarse across-track spacing of 25 km at
70° and 40 km at 60° of the ICESat. In addition to the
dense track spacing and the smaller data gap around the
South Pole, CryoSat-2 also features the high accuracy in
sloped terrain due to the newly developed SIRAL
instrument. This capability is a significant improvement
compared to the conventional altimeters on board
ERS1/2/ENVISAT and enables continuous observations
along the relatively steep and narrow margins of the ice
sheets as well as on large glaciers and ice caps, where
elevation change is most rapid.
Different waveform retracking techniques have been
developed for altimeter measurements over ice sheets
(Martin et al. 1983; Wingham et al. 1986; Davis 1997).
Waveform retracking methods have been compared over
coastal and deep ocean (Guo et al. 2006; Lee et al. 2010;
Khaki et al. 2014). The purpose of this study is to
evaluate waveform retracking methods in Antarctic by
retracking the CryoSat-2 waveforms. We applied six
retracking algorithms including the Off Center of Gravity
(OCOG), the threshold retracking method with 10%, 25%
and 50% threshold level respectively, the linear and
exponential 5-β parametric method to the CryoSat-2
return waveforms over the transect from Zhongshan
Station to Dome A.
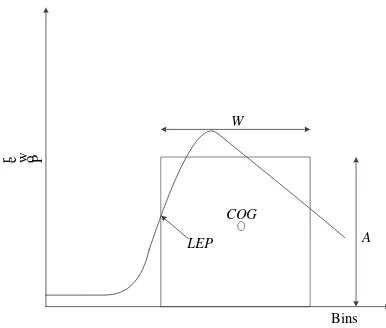
method based on the statistical characteristics of
waveforms. The center of gravity of waveform should be
firstly searched, then the waveform amplitude, width and
position of center of gravity should be estimated with the
numerical method, seeing Figure 1. The method is very
simple, but not correlative to the physical characteristics
of returned surface. The equations of OCOG are as
LEP is the middle point of leading edge.
P
Figure 1. Schematic diagram of the OCOG algorithm
2.2 Threshold algorithm
Davis put forward the threshold algorithm to retrack
altimetry waveforms in 1997. The threshold level should
be determined based on the amplitude and the maximum
waveform power calculated with OCOG. The retracked
point can be obtained to linearly interpolate the
between the threshold level and the leading edge. The
threshold method is a statistical method and not of
physical characteristics. The method can give more
precise retracking gate than OCOG. The corresponding
equations are as follows:
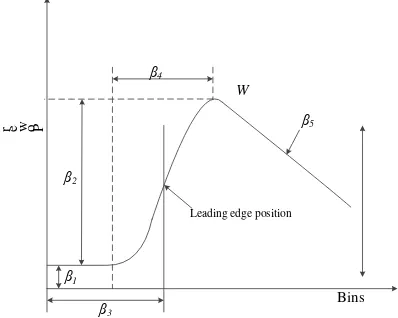
2.3 β parametric fitting algorithm
The β parametric fitting algorithm was firstly put forward
by Martin et al. in 1983 from the National Aeronautics
and Space Administration, USA (NASA). The method
uses a relevant parametric function to fit the altimetry
waveform based on the Brown mean impulse echo model. Β parameters can be estimated by the iterative calculation based on good initial values with the least
squares adjustment or the maximum likelihood estimator.
The 5-β parametric method is mainly used to process the
complex waveform returned from the single reflecting
surface, shown in Figure 2. If the waveform is present
like a spike, the 5-β parametric algorithm may be
non-convergent in the iterative procedure and cannot
give the right results. The linear 5-β parametric equation
is:
thermal noise of returned waveform; 2 is the returned
impulse power for leading edge; 3 is the middle point
gradual attenuation echo wave in the ramping edge.
The exponential 5-β parametric equation is:
5 1( ) 3
unknown-parameter initial values and the determination
of sampling power weight are important to get the
optimal results. In this study, the method to give the
initial values of unknown parameters and determine the
weight is the same as that Anzenhofer et al. (1999) have
used to process ERS-1 waveforms.
P
Figure 2. Schematic diagram of 5-β parameter method
2.4 Retracking distance correction
After retracking waveforms, the middle point of leading
edge can be determined. According to the pregiven gate
and the light velocity, the retracking distance correction
3.1 CryoSat-2 data and study areas
The CryoSat-2 satellite was launched on April 8, 2010,
carrying a new developed altimeter operating in Ku-band.
The SIRAL instrument samples the surface every 300 m
along track using three different measurement modes,
LRM, SAR and SARIn. The low resolution mode (LRM)
is used over oceans and the flat interior of the ice sheets.
LRM is similar to the operation of conventional
pulsewidth-limited altimeters. In the synthetic aperture
(SAR) and synthetic aperture interferometric (SARIn)
modes, SIRAL samples the surface with a higher pulse
repletion frequency (18 181 Hz) than in LRM (1970 Hz).
SARIn measures the steep areas at the margins of the ice
sheet and ice caps, whereas the SAR mode is used over
sea ice to reveal ice free-board by distinguishing leads
and ice flows.
In this study, we use the CryoSat-2 L1B product
provided by ESA, which contains the precise orbit of the
satellite, the back-scattered radar waveforms, the tracker
range and the coherence and phase difference for SARIn
mode. The product also contains additional information,
such as geophysical and tidal corrections and quality
flags.
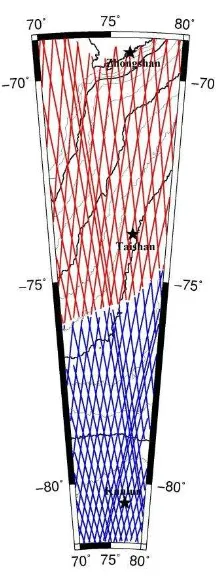
Figure 3 shows the study areas with CryoSat-2 ground
tracks over the transect from Zhongshan Station to Dome
A. This area is the core area of the Chinese Antarctic
Scientific Expedition (Zhang, et al. 2007, 2008). We
investigate the CryoSat-2 waveforms collected in
December 2013 in this study. In this area, the LRM and
SARIn mode are adopted over interior and margins of the
ice sheet respectively.
Figure 3. Ground tracks for CryoSat-2 over the transect
from Zhongshan Station to Dome A, the blue lines
indicate the LRM tracks, while the red lines indicate the
SARIn tracks.
3.2 Waveform retracking
Six waveform retracking methods including the OCOG
retracker, the threshold retracker with 10%, 25%, 50%
threshold level, the linear and exponential 5-β retracker
were used to retrack Cryosat-2 waveforms. The mean
and RMS of retracking distance correction and the
success rate of are calculated for LRM and SARIn
waveforms, respectively. The results are shown in Table
1. The waveform retracking success rate and the RMS of
retracking distance correction are used to assess impacts
of waveform retracking methods. The retracking success
rate is the ratio of retracking waveform number and total
waveform number.
LRM SARIn
Mean/m RMS/m Success rate Mean/m RMS/m Success rate
OCOG -2.119 2.009 100% 250.261 148.636 100%
Threshold-10% -3.933 2.457 100% 129.504 130.469 100%
Threshold -50% -1.247 1.977 100% 224.289 135.435 100%
Linear 5-β -0.218 1.655 92.3% 215.047 103.757 76.2%
Exponential 5-β -0.109 1.548 22.1% —— —— 0.6%
Table 1. Statistics of waveform retracking results
The success rates for LRM waveforms are 92.3% and
22.1% with the two 5-β parametric fitting methods. The
success rates for the other retracking methods are all
100%. The RMSs from the two 5-β parametric methods
are low, which indicates that the two methods can give
good retracking results. The RMS for threshold method
is the minimum when the threshold is 50%. Figure 4 is
the histograms of retracking results for LRM waveforms,
the gray line indicates the onboard tracking point. The
retracking results from the two 5-β parametric methods
and the threshold method with 50% threshold level are
close to normal distribution.
Figure 4. Histograms of retracking results for LRM
waveforms, the gray line indicates the pregiven gate.
The success rate for SARIn waveforms is too low with
the exponential 5-β parametric fitting method and results
of retracking distance corrections are not calculated. The
success rate for the linear 5-β parametric method is
76.2%. The RMSs for the linear 5-β parametric and
threshold method with 25% threshold level are low
among the five retracking methods. Figure 5 is the
histograms of retracking results for SARIn waveforms.
The distribution of the results from five retracking
methods is discrete.
Figure 5. Histograms of retracking results for SARIn
waveforms, the gray line indicates the pregiven gate.
4. DISCUSSIONS
According to the comparison, the linear 5-β parametric
fitting algorithm outperforms other methods for both two
types of waveforms. But the 5-β parametric method is
much more complex and needs a longtime computation.
Moreover, the 5-β parametric method cannot make full
use of all the waveforms because of infinite iterations
during the least squares calculation. The OCOG and
threshold method are based on statistics and have no
definite physical meaning. These two methods have the
advantages of fast calculating speed and full data
utilization. OCOG is often used to get the initial values
for other retracking methods. The selection of threshold
level for threshold method is critical. Table1 shows that
threshold level for LRM and SARIn waveforms,
respectively.
In the transect from Zhongshan Station to Dome A, the
LRM and SARIn mode are adopted. The LRM is similar
to the operation of conventional altimeters. SARIn mode
is the combination of SAR and interferometry, which
makes it possible to accurately determine the arrival
direction of the echoes both along and across the satellite
track. Figure 6 shows the waveform series for LRM and
SARIn modes. The gate range is 0~127 for LRM mode
and 0~511 for SARIn mode. The SARIn waveforms are
much more intensive and complex than LRM waveforms,
and the RMS of retracking distance correction is much
larger than that of LRM waveforms.
(a)
(b)
Figure 6. Waveform series for LRM (a) and SARIn (b)
modes
5. CONCLUSION
Satellite altimetry waveform retracking methods are
discussed in the paper. Six retracking methods are used
to retrack CryoSat-2 waveform over the transect from
Zhongshan Station to Dome A. OCOG method uses all
powers of waveform but has low precision. The linear
5-β parametric method gives the best results for LRM
and SARIn waveforms,but cannot make full use of the
waveform data. The threshold method is fit for the
CryoSat-2 altimetry waveform retracking with the
consideration of waveform retracking success rate and
RMS of retracking distance corrections. The threshold
method performs best with 50% and 25% threshold level
for LRM and SARIn waveforms, respectively.
ACKNOWLEDGEMENTS
This study is supported by the State Key Program of
National Natural Science of China, No. 41531069; the
Independent research project of Wuhan University, 2017,
No. 2042017kf0209; the National Natural Science
Foundation of China, No. 41176173; the Polar
Environment Comprehensive Investigation and
Assessment Programs of China, No. CHINARE2017.
REFERENCES
Anzehofer M, Shum C K, Rentsh M. 1999. Coastal
altimetry and applications. Rep 464, Dept Geod Sci and
Surveying, Ohio State University, Columbus.
Bamber J L, Gomez-Dans J L, Griggs J A. 2009. A new 1
km digital elevation model of the Antarctic derived from
combined satellite radar and laser data – Part 1: Data and
methods. The Cryosphere, 3, pp. 101-111.
Davis C H. 1997. A robust threshold retracking algorithm
for measuring ice-sheet surface elevation change from
satellite radar altimeter. IEEE Transactions on
Geoscience and Remote Sensing, 33(5), pp. 1108-1116.
Guo J Y, Hwang C W, Chang X T, et al. 2006. Improved
threshold retracker for satellite altimeter waveform
retracking over coastal sea. Progress in Nature Science,
16(7), pp. 732-738.
Lee H, Shum C K, Emery W, et al. 2010. Validation of
Jason-2 altimeter data by waveform retracking over
California Coastal Ocean. Marine Geodesy, 33(S1), pp.
Li F, Yuan L X, Zhang S K, et al. 2016. Mass change of
the Antarctic Ice Sheet derived from ICESat laser
altimetry. Chinese J. Geophys., 59(1), pp. 93-100.
Martin T V, Zwally H J, Brenner A C, et al. 1983.
Analysis and retracking of continental ice sheet radar
altimeter waveforms. Journal of Geophysical Research,
88(C3), pp. 1608-1616.
Khaki M, Forootan E, Sharifi M A. 2014. Satellite radar
altimetry waveform retracking over the Caspian Sea.
International Journal of Remote Sensing, 35(17), pp.
6329-6356.
Wingham D J, Rapley C G, Griffiths H. 1986. New
techniques in satellite altimetry tracking systems. Proceedings of IGARSS’86 Symposium, Zurich, pp. 1339-1344.
Wingham D J, Francis C R, Baker S, et al. 2006. CryoSat:
A mission to determine the fluctuations in Earth’s land
and marine ice fields. Advances in Space Research, 37(4),
pp. 841-871.
Yuan L X, Li F, Zhang S K, et al. A study of Arctic sea
ice freeboard heights from ICESat/GLAS. Geomatics
and Information Science of Wuhan University, 2016,
41(9), pp.1176-1182.
Zhang S K, E D C, Wang Z M, et al. 2007. Surface
topography around the summit of Dome A, Antarctic,
from real-time kinematic GPS. Journal of Glaciology. 53,
pp. 159-160.
Zhang S K, E D C, Wang Z M, et al. 2008. Ice velocity
from static GPS observations along the transect from
Zhongshan station to Dome A, East Antarctica. Annals of
Glaciology, 48, pp. 113-118.
Zhang S K, Xiao F, Li F, et al. DEM development and
precision analysis in two local areas of Antarctica, using
Cryosat-2 altimetry data. Geomatics and Information
Science of Wuhan University, 2015, 40(11),