505
STRATEGIC RETHINKING: COMBINATION OF BALANCED SCORECARD-BASED APPROACH AND FUZZY ANALYTIC NETWORK PROCESS TO
ENHANCE THE EDUCATION QUALITY
Khresna Bayu Sangka*
*Mahasiswa program PhD pada Royal Melbourne Institute of Technology Australia
Email korespondensi: [email protected]
ABSTRACT
Educational providers should monitor and measure their performance continuously, in terms of delivering qualified education to the students and to improve their accountability. Although the importance of such an assessment process has been stressed in the literatures, policies and regulations, there is no framework that has been proposed to consider all the different relevant factors and determines semantically the level of the quality of education being delivered. In order to provide such an approach, in this paper we propose a framework by which the quality of education being delivered in a subject in an Indonesian university can be determined by using the Balanced Scorecard (BSC). The proposed approach will capture the different factors to be considered from the different perspectives and assimilate them to determine the quality of education. The resultant analysis will provide important inputs to the different stakeholders involved in taking appropriate measures to ensure that students‘ learning experiences can be maintained at a certain desired level.
ABSTRAK
Penyelenggara pendidikan seyogianya menjaga dan menentukan kinerjanya secara berkelanjutan, dalam arti memberikan pedidikan berkualitas kepada siswa dan selalu meningkatkan akuntabilitasnya. Meskipun ulasan mengenai pentingnya proses penilaian telah banyak diulas diberbagai kajian pustaka, kebijakan dan peraturan, tetapi tidak ada kerangka yang secara menyelurh menerangkan bagaimana kualitas pendidikan dapat diraih melalui berbagai macam faktor. Dalam rangka memberikan pendekatan semacam itu, dalam makalah ini kami mengusulkan kerangka kerja dimana kualitas pendidikan yang disampaikan dalam sebuah topik di sebuah universitas di Indonesia dapat ditentukan dengan menggunakan Balanced Scorecard (BSC). Pendekatan yang diusulkan akan menangkap berbagai faktor yang harus dipertimbangkan dari perspektif yang berbeda dan mengasimilasi mereka untuk menentukan kualitas pendidikan. Analisis yang dihasilkan akan memberikan masukan penting kepada para pemangku kepentingan yang terlibat dalam mengambil langkah yang tepat untuk memastikan bahwa pengalaman belajar siswa dapat dipertahankan pada tingkat tertentu yang diinginkan.
Keywords: Education quality, balanced scorecard, fuzzy analytic network process INTRODUCTION
506
public awareness in Indonesia. Indonesia stands in the middle of a new open world, in which individuals perceive that they have the right to compare their lives in every respect with the lives of individuals in other nations. However, according to the Human Development Index (HDI), such levels of comparisons do not seem to be evidenced in all areas. The Human Development Index is an indicator designed to measure a nation's quality of life, access to proper education, life expectancy, living standards and the level of literacy . Recent education reports have shown that the quality of education in
Indonesia is not improving as much as that of other South East Asia countries or other developing countries in the world. According to the 2013 Human Development Index is 0.684, positioning in rank 108 out of 187 countries which is above the average of 0.614. This position is still below the average for countries in the medium human development group for countries in East Asia and the Pacific. From East Asia and the Pacific region which noted the average of 0.703. Countries which are close to Indonesia in 2013 HDI rank and to some extent in population size are the Philippines and China, which have HDIs ranked 117 and 91 respectively. (http://hdr.undp.org/sites/all/themes/hdr_theme/ country-notes/IDN.pdf).
Over the past years there have been some significant efforts taken in Indonesia in developing formal education at all levels; from elementary to university. According to Indonesian Law No. 20/2003 on the national education system, Chapter II, Article 3 states that ―The functions of national education are to develop the people's abilities and to enhance a strong and well-developed civilization, in the framework of developing living conditions, leading to the realization of the learners' potentials to become individuals with faith and strong belief in God Almighty, who are noble, healthy, knowledgeable, skillful, creative, independent and ultimately become democratic,
responsible citizens‖. .
In terms of the quantity point of view, there have been significant developments in education on the last 10 years. But, in terms of quality, there is not much
507
many prestigious advantages in promoting their institutions for Indonesian high
schools‘ graduates. It will be the others threat for Indonesian higher education to
stretching their quality in education. They still face difficulties in offering good education, let alone making any expansion. If this problem is not resolved soon, the quality of the Indonesian education system will sink further, and be unable to keep pace with the rapid advancements in this era of globalization.
In the education area, a leader must have the ability to promote competitive
strengths. The competitive strengths may include relevance of curriculum content, teaching and learning process, and teaching staff welfare, quality of teaching staff, financial capabilities, networking and quality of graduates . In terms of curriculum content relevancy, it must match and link with the industry needs and the needs of the public at large; there must be a match and link between elementary, secondary and college/university education . This relevancy must be continuously updated and reviewed, so there will be no more gaps between the industry requirements and the educational institutions' offerings. In order to keep pace with the fast growing industry, educational institutions should adopt and focus on the competency-based curriculum. This kind of curriculum emphasizes performance, in which students are encouraged to demonstrate their area of competence, and to perform a real job. .
To maintain an organization's sustainability, a leader of an educational institution should have assiduous concern over the continuous improvement of financial capabilities . By having good financial capabilities, the institution will always be able to develop, grow and survive in the face of a dynamic external environment. Many options are available to increase financial capabilities; both through concerted internal and external efforts. Therefore, an institution should maintain relationships and develop networks with other educational institutions and industry . The other major aspect that equally needs our attention is lecturers'/teachers' welfare. Lecturers/teachers must have specialized skills or competencies in order to deliver quality teaching. The competencies include personal competency, social competency and professional competency. It is
508
In this paper, we propose an approach by utilizing the Balanced Scorecard (BSC) that will assist an education provider in the risk identification and risk assessment phase of the risk analysis process. The output of this process will provide important considerations during the later phase of risk management. This paper is organized as follows. Section 2 discusses the previous work from the literature on improving the quality of education and justifies the selection of the BSC as the tool to carry out the risk identification and risk assessment process. In Section 3, we propose our BSC framework
and discuss the goal, different objectives and key performance indicators (KPIs). In Sections 4-5, we discuss our approach of utilizing the Analytic Network Process to determine the weight of each KPI and then determining the level of quality of education. Finally in Section 6, we conclude the paper.
JUSTIFICATION OF UTILIZING THE BALANCED SCORECARD FOR MEASURING THE
QUALITY OF EDUCATION
The need of performance measurement system in education sector, not only to simplify the process of developing policies, but also to capture the importance‘s relationship between each level of decision maker. Kaplan and Norton (1996), have proposed the Balanced Scorecard (BSC) to evaluate the business performance from four different perspectives which are: the financial perspective, the internal business process perspective, the learning and growth perspective, and the consumer perspective. The basic premise of the Balanced Scorecard is that financial results alone cannot capture value-creating activities . They suggested that organizations, while using financial measures, should develop a comprehensive set of additional measures to use as leading indicators, or predictors, of financial performance. In several profit oriented business BSC is easily implemented rather than in nonprofit business such as Universities or schools.
More research shown that the significant improvement for a higher education institution or university has to generate effective process in education or in the decision
509
the institutional audit, the system will be undertaken as the need arises to maintain support in these areas of decision making. In the other hands, a case study held in Singapore case study of using BSC as a quality and performance management system reveals that there are significant improvements in quality and performance of higher education institution result .
Student‘s development and improvement is a parameter to get another measures performance indicators for an organization in the BSC implementation. Based on the
research conducted in Southeast Missouri State University, BSC would allow organizations to track student learning while simultaneously monitoring their progress in building the capabilities and acquiring the resources that would affect their capacity to improve student performance and development .
Adopting the key performance indicators of instruments such as BSC would allow universities to develop and allocate resources in a strategically coherent manner. In turn, this can be translated into effective reorganization of such operational matters as daily staff tasks . The present study therefore sets out to investigate the use of BSC in the promotion of quality and improved operational performance in university education .
The quality of education can be improved by means of a two-step approach which involves having an effective process that determines the areas of improvement, and an effective process for decision-making and responding to the changes required . In the literature, approaches have been proposed that aim to identify the factors which need to be addressed in improving the quality of education. For example, states that the process of enhancing, assessing, maintaining and improving the quality of education has to be addressed using several criteria such as trust building, better collaboration and dialogue, participation in shaping the future, and a culture of evidence. These processes are developed from a measurable, specific, achievable and time line-based approach according to administrative management philosophy . But apart from studying the impact of these factors, some of the other important factors that need to be considered
510
in order to ensure the delivery of consistently high levels of productivity and service quality in the higher education institution.
As opposed to other organizations, increasing the sustainability and reputation of an educational institution is not just about improving its financial viability; it is more concerned with addressing those factors which impact on the students‘ learning experience in terms of the quality of education being delivered. These factors include: the relevance of curriculum content to the requirements of industry and public service,
teaching and learning processes, teaching staff welfare, and the quality of teaching staff. These factors impact upon the quality of education being delivered in the classroom. However, there are also other factors outside the classroom environment which may determine the quality of education being delivered. These may include: student learning results, student and stakeholder focused results, staff competence levels, organizational operational level including key internal operational performance measures, and governance and social responsibility results. Therefore, as an integral part of the accountability process, all these non-financial factors should be identified and considered when determining the quality of education being delivered. As mentioned earlier, apart from establishing accountability, another important step to improve the quality of education is to be proactive in addressing the identified issues . This is achieved by incorporating the process of risk analysis. Existing approaches in the literature do not consider all these factors; nor do they provide a process of risk analysis that incorporates accountability in the process of maintaining the quality of education. We aim to achieve it in our approach by using a Balanced Scorecard.
The Balanced Scorecard (BSC) is an integrated performance management system that enables organizations to clarify their strategy and translate it into action . It takes into consideration both the financial and non-financial aspects of an organization. By measuring current performance outcomes as well as future performance drivers, the BSC provides feedback for both the internal business processes and external outcomes in order to continuously improve strategic performance . It takes into consideration
511
improve educational quality . This process will help in the delivery of consistently high degrees of productivity and service quality for a fixed or decreasing cost to the organization. It has been stated in the literature that the BSC could be a powerful model for strategic positioning in a higher education institution, because it analyzes all aspects
of an organization . However, previous approaches have focused only on managing the performance of the education staff only. For example, proposed a benchmark scorecard for the BSC which is implemented in the education sector based on the basic requirement of education staff performance. Such approaches, although they relate to the educational sector, do not take into consideration the different stakeholders – an essential consideration for improving the overall quality of education. To address this shortcoming, in this paper we propose a BSC-based approach to determine the level of quality of education by considering the wide range of factors required for determining the level of quality of education. The proposed approach is explained in the next section.
512
PROPOSED BALANCED SCORECARD FRAMEWORK FOR MEASURING THE QUALITY OF
EDUCATION
The Balanced Scorecard (BSC) is an integrated performance management system that enables organizations to clarify their strategy and translate it into action . In other words, it provides a comprehensive measurement system that takes into
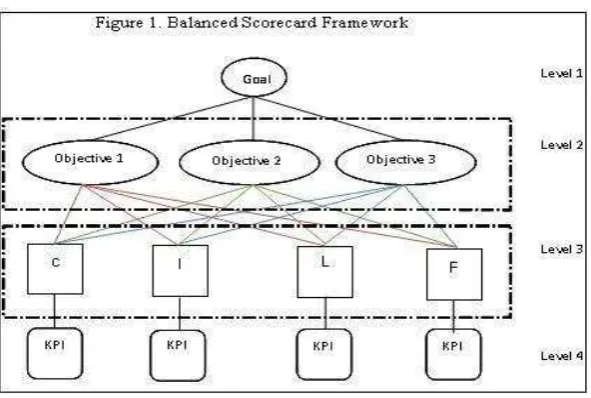
consideration all those indicators that are important for the achievement of the goal(s). The structure of the BSC is usually divided into 4 different levels as shown in Figure 1. The first level represents the goal to be achieved; the second level represents the different objectives into which this goal is divided; the third level represents the different perspectives of the balanced scorecard which are considered to achieve the goal and the fourth level represents the different key performance indicators (KPIs) that come under each perspective in order to achieve the objective.
In our case, as our aim is to determine the quality of education so that it can improved, we define the goal of the BSC as ―Measuring the quality of education‖. The goal will be dependent on different objectives that specify in what areas the quality of education will be assessed. In other words, the goal to be achieved should be categorized or broken down into different factors that are termed the ‗objective‘. From the Indonesian perspective, higher education has to address three different areas: science transfer (which is related to the higher education institution as learning and education institution), community and government outreach (related to the higher education institution as a public service institution), and research (related to the higher education institution as a research and development institution). The objectives can be defined as the cultivation of perspectives achievement. In our case, we categorize the goal into three major objectives by studying the higher education institution‘s long term strategic planning. They are:
1. Lead on the education science transfer and development.
2. Lead on the community and local government outreach.
513
Each of the above mentioned objectives is dependent on various factors which
are termed ‗indicators‘. But before identifying the indicators, the perspectives of the
BSC should be identified. Perspectives in BSC are group relevance indicators that must be considered if an organization is to achieve a goal. In other words, perspective in BSC simplifies the overall business process of the different factors that need to be achieved. The number of perspectives to be considered in a BSC varies according to the objectives, goals and stakeholders. It also depends on how an organization categorizes
its business process. In this paper, since our focus is on educational business which is not merely a profit-oriented business, the perspectives and KPIs that have to be identified should be a combination of financial and non-financial performance metrics. Hence, we use the original perspectives from Norton and Kaplan which are Customer,
Internal Process, Learning and Growth and Financial, since the relevance of these perspectives is appropriate to the existing business process in education. Customer perspective represents the satisfaction of the consumers in achieving the goals. The customers in this case include students, stakeholders, and community. Internal process perspective represents the internal process by which the aim or goal of the organization is being achieved. Learning and growth perspective represents the organization‘s ability and intention to change and improve its business core value in terms of sustaining and affording the customers‘ needs. The financial perspective considers those factors that are related to the financial cash flow of the organization.
514
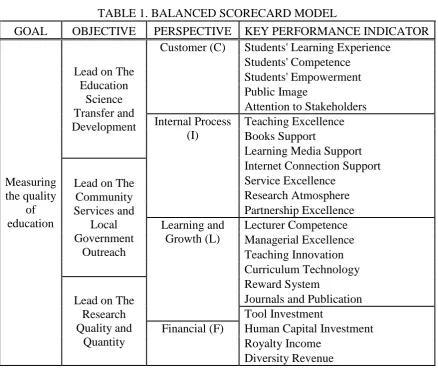
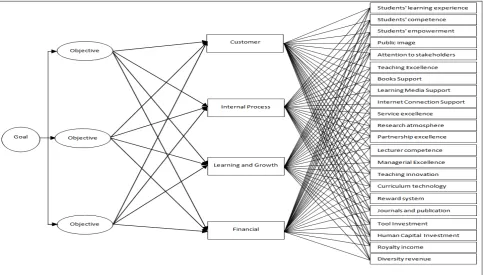
Even though a KPI is placed under a perspective in Table 1, it does not mean that it does not have any relationship with or impact upon the other perspectives or objectives. There can be an interdependent relationship between a KPI with different objectives. In other words, a KPI may be dependent upon more than one perspective. For example, the KPI student‘s learning experience may be related not only to the perspective customer, but also on how an institution carries out its internal process which comes under the internal process perspective as shown in Figure 2. Similarly, the weight that a KPI might have on a perspective may not be the same as on the other perspective and this will have a varying impact on each objective that has to be determined. So the appropriate weight of each KPI has to be determined according to the goal or objective to ascertain its specific importance. In the next section, we discuss the Analytic Hierarchy Process (AHP) and Fuzzy Analytic Network Process (FANP) proposed in the literature to determine the weights of each KPI.
TABLE 1. BALANCED SCORECARD MODEL
GOAL OBJECTIVE PERSPECTIVE KEY PERFORMANCE INDICATOR
Measuring
515 DETERMINING THE WEIGHTS OF EACH KPI
The Analytic Hierarchy Process (AHP) is a comprehensive framework that is designed to cope with and the irrational information when a objective, multi-criterion decision has to be made. The basic assumptions of AHP are that it can be used in functional independence of an upper part or cluster of the hierarchy from all its lower parts and the criteria or items in each level . Conventional AHP that requires the selection of arbitrary values in pair wise comparison may not be sufficient and
uncertainty should be considered in some or all pair wise comparison values . But this does not consider the inter-dependence of each KPI on other KPIs or objectives. So the drawbacks of AHP are: 1) it has only linear hierarchy structures that cannot calculate the inter-dependence weight between different levels; 2) it is static in decision evaluations and cannot measure inner and inter dependence weights for different objective; 3) it has no feedback mechanism which means that the evaluation from this approach is only at a single level of dependence. To overcome this, the Analysis Network Process (ANP) is utilized.
516
The Analytic Network Process (ANP) is the variant of the AHP that can be tailor-made for specific situations and can be used to overcome most the traditional problems of BSC implementation . ANP itself enables the inter-relationships among the decision levels and attributes to be taken into consideration in a more general form. In this case, ANP can be used as an effective tool in those particular cases where the interactions among the elements of a system form a network structure . ANP models have two parts: the first is a control hierarchy or network of objectives and criteria that
controls the interactions in the system under study; the second comprises the many sub-networks of influences among the elements and clusters of the problem, one for each control criterion . ANP is capable of handling inter-relationships between the decision levels and attributes by obtaining the composite weights through the development of a
―supermatrix‖ . The supermatrix is actually a partitioned matrix, where each matrix
segment represents a relationship between two components or clusters in a system . There are different variants of using ANP such as the conventional and fuzzy-based approach. In our approach, we will use the Fuzzy-ANP approach proposed by Da-Yong Chang to determine the weights of each KPI by considering its interdependencies. This is because the fuzzy linguistic approach, by using the membership functions, can take into account approximate reasoning and the intermediate or vagueness in the responses of the KPIs instead of the conventional numerical equivalence method . So our approach of utilizing the Fuzzy ANP to determine the quality of education is as follows:
Step 1 : Establish the general goal.
Step 2 : Determine the objectives, which will lead to the goal.
Step 3 : Determine the perspective under each objective, and key performance indicators.
Step 4 : Develop an ANP structure for the oriented BSC (establishing connectivity and inter correlation among each KPI and objectives).
Step 5 : Determine the local weights of objectives, perspectives, and KPIs using Chang‘s fuzzy AHP method.
517
ANALYTIC NETWORK PROCESS TO DETERMINE THE WEIGHT OF EACH KPI
In this section, we will explain briefly the steps in determining the weight of each objective with respect to the goal to be achieved by considering the interdependencies between them. These steps are:
1. Calculate the pair wise comparison of each objective with respect to the goal. 2. Determine the weight for each objective.
3. Determine the inner-dependency of each objective.
4. Determine the inter-dependency matrix and the weights between objectives. 5. Determine the global weight of the objectives by multiplying the analysis
obtained in step 4 with that of step 2.
6. Use eigen values to estimate the relative weights of the objectives.
7. Check the consistency property of objectives to ensure that the judgments of decision makers are consistent.
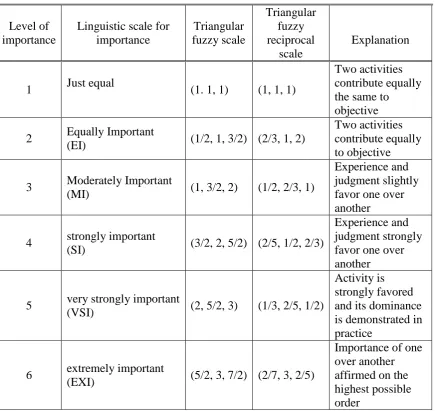
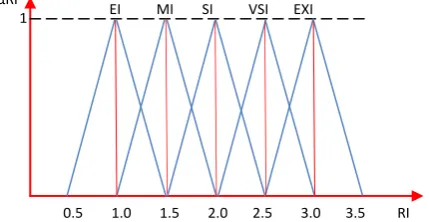
8. Pair wise comparison between two objectives with respect to the goal is carried out on a 5 fuzzy set scale as shown in Table 2 and Figure 3.
Each fuzzy set represents a different level of importance and depending upon the level of importance of an objective to the goal, the corresponding level of fuzzy importance is assigned to it and the reciprocal value is assigned to the other objective. This process is repeated for each objective and their weights are determined with respect to the goal as shown in Table 3. The next step is to determine the level of inner dependencies among the objectives. In our problem and according to the discussion with the experts, we determined that each objective is dependent on each other and hence the inner dependence matrix between the objectives is as shown in Figure 4.
To determine the effect of such inner dependencies between the objectives on the final weight which they will have on the goal, pair wise comparisons between each of them should be determined to ascertain their respective weights. Such analysis is represented in Tables 3(b-d). The final weights of each objective on the goal are determined by multiplying the inner dependence matrix with the respective weights is
518
the weight of each perspective with respect to the objectives and then consider the level of inner dependencies between them. In our approach we found the inner dependencies (represent by loop arrows) between the perspectives by interviewing the experts as shown in Figure 5.
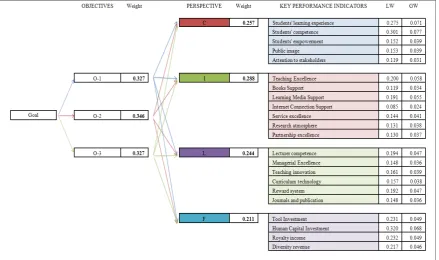
Pairwise comparisons between these perspectives should be carried out as were done with the objectives and their global weights or importance to the objectives should be determined. Due to space limitations, in this paper we do not show the detailed
process of determining the weights of the perspectives. Figure 6 represents the individual global weights of objectives in the BSC to determine the quality of education.
TABLE 2. LINGUISTIC SCALE FOR DIFFICULTY AND IMPORTANCE
519
Once the weights for the different elements in the BSC have been determined, the next step is to determine the value of each KPI by using survey results and cumulate them to ascertain the quality of education. This will be discussed in the next section.
e. Inter-dependency matrix for objectives respect to goal Weight
d. Inner dependency weight of the objective which respect to objective 3 Weight
0.5 0.56
c. Inner dependency weight of the objective which respect to objective 2 Weight
0.44 b. Inner dependency weight of the objective which respect to objective 1
Table 3. Local Weight Respect to Goal and Objective a. Local weight respect to goal
µRI 1
0.5 1.0 1.5 2.0 2.5 3.0 3.5 RI EI MI SI VSI EXI
520 Ascertaining the Quality of Education
To determine the quality of education, we formulate a set of questionnaires which address all identified KPIs based on the higher education institution‘s long-term strategic planning. The objectives of this survey are not only to identify the most important to the least important of the KPIs based on the respondents‘ point of view, but also to define the relativity among different KPIs which will ascertain the quality of education.
Figure 5. Relationship between Perspectives under Objective 1
O-1
O-2 O-3
Figure 4. Relationship between Objectives
521
The survey is divided into 4 categories of respondents (student, education staff / lecturer, managerial staff / head of school and the local government). The surveys were conducted and collected from four different units, each of which had four classes. There are 50 students per class in each course. The survey data was collected from 20 lecturers, 5 local government representatives and 5 managerial staff. The questionnaire was divided into four sections addressing the perspectives in BSC, and each section had a different number of questions depending on the KPIs and performance indicators
according to the identified KPIs. The survey had 130 questions. The course for which we conducted the survey had different units in it and we conducted the survey for each unit. The course was divided into four sections with 50 students in each section.
The survey was given to each of them and the respondents were asked to answer to each question in a range of 0-6, with 0 representing the least satisfaction to the question and 6 representing the highest level of satisfaction. The value of each KPI was determined as the mean of the responses by the number of respondents and then multiplied with the respective global weight of the KPI as shown in Equation 1.
vKPIi = wKPIi *
n rKP Ii
n
i
1(1)
where: wKPIi represents the global weight of KPI i,
rKPIi represents the responses of KPI i,
n represents the number of respondents, vKPIi represents the determined value of KPI i
522
where: vKPIj represents the determined value of KPI j
m represents the number of KPI in perspective i,
wPeri represents the weight of perspective i,
n represents the number of perspectives, vObji represents the determined value of objective i
Once the value of each objective has been determined, then the quality of education on the scale of 0-6 can be determined by using equation 3
vGoal =
where wObjk represents the global weight of objective k,
vObjk represents the value of objective k.
By utilizing the proposed approach, the value of each KPI, perspective and objective can be determined based on the level of education that is being delivered. The poorer performing areas can be determined by the value of the determined KPIs, and the impact that they will have on achieving the overall goal can be ascertained. This will alert the decision maker to the need to take corrective actions against the non-performing KPIs that hinder the improvement of the quality of education to the desired level.
CONCLUSION
There are many ways to enhance and raise the accountability of an organization. One of them is by using Balanced Score Card (BSC) approach. The BSC is a
523
profit but also to provide a service to the community. In this paper, we proposed an approach that utilizes the combination of Balanced Score Card and Fuzzy Analytic Network Process to ascertain the quality of education. By utilizing the proposed approach, the education provider can identify the different areas that are important to be considered and then determine its performance in each of them. The non-performing KPIs of an education provider can be identified and then strategies can be developed to improve its performance in them. In other words, this method facilitates the process of
risk management that will lead to an improvement in the quality of education. But before carrying out the risk management, the level of severity according to which it should be carried out in each non-performing KPI should be determined. For this task, the level of deviation of each KPI from its optimal point should be determined. This strategic framework gives the decision maker the opportunity to modify and adjust the objectives or the KPIs as desired. The weights of connectivity among KPIs in different situations might lead to changes related to the organization‘s need.
REFERENCES
Bensimon, Estela Mara, Lan Hao, and Leticia Tomas Bustillos. "Measuring the State of Equity in Public Higher Education." In Harvard Civil Rights adn US Conference
on Expanding Opportunity in Higer Education: California and the Nation.
Sacramento, California, USA: Rossier School of Education, University of Southern California, 2003.
Bozdag, Cafer Erhan, Cengiz Kahraman, and Da Ruan. "Fuzzy Group Decision Making for Selection amongComputer Integrated Manufacturing Systems." Computers
in Industry 51 (2003): 13-29.
Celik, Metin, I. Deha Er, and A. Fahri Ozok. "Application of Fuzzy Extended AHP Methodology on Shipping Registry Selection: The Case of Turkish Maritime Industry." Expert Systems with Application Vol. 36, no. No. 1 (2009): pp. 190-98.
Chang, Da-Yong. "Applications of the Extent Analysis Method on Fuzzy AHP."
European Journal of Operational Research 95 (1996): 649-55.
Cullen, John, John Joyce, Trevor Hassall, and Mick Broadbent. "Quality in Higher Education: From Monitoring to Management." Quality Assurance in Education
524
Dulewicz, Victor, and Malcolm Higgs. "Assessing Leadership Styles and Organisational Context." Journal of Managerial Psychology 20, no. 2 (2005): 105-23.
Einstein, Chirs Papenhausen and Walter. "Insights from the Balanced Scorecard: Implementing the Balanced Scorecard at a College of Business." Measuring
Business Excellence Vol. 10, no. No. 3 (2006): pp. 15-22.
Fletcher, Darlene Brannigan Smith and Harold D. "The Balance Scorecard: A Useful Framework for Achieving Curriculum Integration." Journal of Executive
Education, no. Spring 2004 (2004): pp. 41-55.
Griffin, Patrick. "The Comfort of Competence and the Uncertainty of Assessment."
Studies in Educational Evolution 33, no. 1 (2007): 87-99.
Hafner, Kristine A. "Partnership for Performance: The Balanced Scorecard Put to the Test at the University of California." (1998).
Karathanos, Demetrius Karathanos and Patricia. "Applying the Balanced Scorecard to Education." Journal of Education for Business March - April (2005).
Kuncoro, Engkos Achmad. "How to Boost the Quality of Education in Indonesia." The
Jakarta Post, July, 30 2009.
Leung, L. C., K. C. Lam, and D. Cao. "Implementing the Balanced Scorecard Using the Analytic Hierarchy Process & the Analytic Network Process." The Journal of
the Operational Research Society 57 (2006): 682-91.
Liang, Gin-Shuh. "Personnel Selection Using Fuzzy MCDM Algorithm." European
Journal of Operational Research 78 (1994): 22-33.
McAdam, R., and E. O‘Neill. "Taking a Critical Perspective to the European Business
Excellence Model Using the Balanced Scorecard Approach: A Case Study in the Service Sector." Managing Service Quality 3 (1999): 191-97.
Meade, L. M., and J. Sarkis. "Analyzing Organizational Project Alternatives for Agile Manufacturing Processes: An Analytical Network Approach." International
Journal of Production Research 37, no. 2 (1999): 241-61.
Murali, M. Punniyamoorthy and R. "Balanced Score for the Balanced Scorecard: A Benchmarking Tool." Benchmarking: An International Journal Vol. 15, no. No. 4 (2008): pp. 420-43.
525
Niven, Paul R. Balance Scorecard Step-by-Step. John Wiley & Sons, Inc, 2002.
Robert S. Kaplan, David P. Norton. The Strategy Focused Organization. Harvard Business School Press, 2001.
———. Transforming the Balanced Scorecard from Performance Measurement to
Strategic Management. II ed.: Harvard Business School Press, 2001.
———. Translating Strategy into Action the Balanced Scorecard. Harvard Business
School Press, 1996.
Saaty, Thomas L. "Multi-Decisions Decision-Making: In Addition to Wheeling and Dealing, Our National Political Bodies Need a Formal Approach for Prioritization." Mathematical and Computer Modelling 46 (2007).
———. "Time Dependent Decision-Making; Dynamic Priorities in the Ahp/Anp: Generalizing from Points to Functions and from Real to Complex Variables."
Mathematical and Computer Modelling 46 (2007): 860–91.
Schneiderman, Arthur M. "Why Balanced Scorecards Fail." Journal of Strategic
Performance Measurement January, no. Special Edition: 6 (1999).
Shiau, Shun-Hsin Chen and Ching-Chow Yang and Jiun-Yan. "The Application of Balanced Scorecard in the Performance Evaluation of Higher Education." The
TQM Magazine Vol. 18 no. No. 2 (2006): 190-205.
Sisdiknas. "Undang Undang No. 20 / 2003 Tentang Sistem Pendidikan Nasional." 2003.
Sowan, Bilal, Kesav Dahal, M.A. Hossain, Li Zhang, and Linda Spencer. "Fuzzy Association Rule Mining Approaches for Enhancing Prediction Performance."
Expert Systems with Applications 40, no. 17 (2013): 6928-37.
Streib, Theodore H. Poister and Gregory D. "Strategic Management in the Public Sector: Concepts, Models, and Processes." Public Productivity & Management
Review Vol. 22, no. No. 3 (Mar., 1999) (1999): pp. 308-25.
Watkins, Kevin. "Human Development Report 2007/2008." 2009.
Wohlstetter, Richard S. Brown and Priscilla. "Developing a Performance Evaluatiosystem for Charter Schools: The Balanced Scorecard Approach." Center on Educational Governance, Rossier School of Education, University of Southern California, 2003.
526
Yek, T.M., D and Penney, and A.C.H. Seow. "Using Balanced Scorecard (BSC) to Improve Quality and Performance of Vocational Education and Training (VET): A Case Study in Singapore." In AARE Fremantle, Australia, 2007.
Yu, Chian-Son. "Agp-a Hp Method for Solving Group Decision-Making Fuzzy AHP Problems." Computers & Operations Research 29 (2002): 1969–2001.