J. SE Asian Appl. Geol., 2015, Vol. 7(2), pp. 61–74
MINERAL POTENTIAL MAPPING USING
GEOGRAPHIC INFORMATION SYSTEMS (GIS)
FOR GOLD MINERALIZATION IN WEST JAVA,
INDONESIA
Seang Sirisokha*1, Lucas Donny Setijadji2, and I Wayan Warmada2
1Geo-resources and Geotechnical Engineering, Institute of Technology of Cambodia, Phnom Penh, Cambodia 2Department of Geological Engineering, Gadjah Mada University, Yogyakarta, Indonesia
Abstract
Western Java is a part of the Sunda Banda mag-matic belt. This belt is well known to be host for several gold deposits in Indonesia, the distribution of 107 Au occurrences in this area was examined in terms of spatial association with various geolog-ical phenomena. The goal of this project is to use GIS to conduct a weights of evidence (WofE) model for gold mineralization in West Java, Indonesia. A Geographic Information System (GIS) is a computer system for capturing, storing, querying, analyzing, and displaying geospatial data and weight of evi-dence method is one of the most important data-driven methods for mapping in GIS. The method is a probability based on technique for mapping min-eral potential using the spatial distribution of known mineral occurrences. Therefore this method is very useful for gold potential mapping. There are six ev-idences maps such as NE–SW lineaments NW–SE Lineament, host rocks, heat sources, clay alteration and limonitic alteration, have been combined using a weights of evidence model to predict gold potential in West Java. The best predictive map generated by this method defines 21.62% (9902 km2) of study area as favourable zones for gold mineralization further exploration work. It predicts correctly 74 (92.5%) of the 80 model deposits and predicts correctly 26 (96.35%) of the 27 validation deposits, has 6 main
*Corresponding author: S. SIRISOKHA, Geo-resources and Geotechnical Engineering, Institute of Technology of Cambodia. Russian Federation Blvd., P.O Box 86, Phnom
prospective target for future exploration are located in Bayah Dome, southern mountain, Honjie Igneous Complex and Bogor zone, Purwakarta. Bayah Dome is highest potential area for gold deposit like Gu-nung Pongor, Cikidang, Cirotan, Ciawitali, Cikotok destricts and other deposits. The potential area of Au occurrences in research area is associated with NE–SW and NW–SE structure/ lineaments, domi-nated surrounding the Tertiary intrusive rock unit and hosted in Miocene to Pleistocene lithology rock unit.
Keywords: GIS, Weight of evidence method, Min-eral potential mapping, Bayah Dome, Bogor, West Java
1 Introduction
The gold mineralization in Western Java is typ-ical of epithermal type deposit and hosted by Tertiary volcanic rocks. The gold deposits are extensively in the form of gold bearing quartz veins that classified as epithermal low sulphi-dation and high sulphisulphi-dation (Marcoux and Mil´esi, 1994). Many epithermal-style alter-ations and mineralization are associated with this volcanoclastic and intrusive rocks, includ-ing epithermal gold deposits and few prospect areas for possible mineralization of porphyry systems.
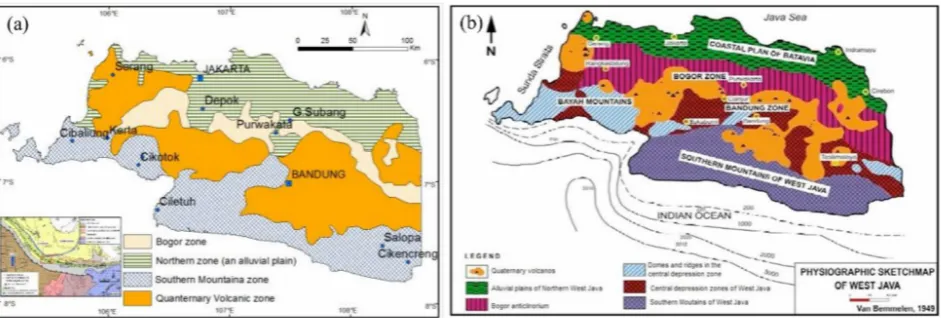
ploration of gold in the study area. The study area is located in the western part of Java Island in Indonesia, within longitude 105–109°E and latitude 6–8°S (Figure 1a).
2 Teoretical background
Regional geology
Java Island represents part of Sunda-Banda arc due to the subduction of the northward-moving Indian-Australian Plate beneath the Eurasian Plate, which consists of a belt of active calc-alkaline volcanos (Claproth, 1989). These fea-tures are built upon older volcanic and volcan-oclastic rocks that are intercalated with Paleo-gene and NeoPaleo-gene sediments and intruded by small plutonic masses of composition similar to the volcanic.
Physiographically, the Southern Mountains of West Java region belongs to the Sunda-Banda magmatic arc (Figure 1b). This arc has been formed since Early Tertiary and still active until now. The area is a part of southern slope re-gional uplift (van Bemmelen, 1949). The main structural features of Java, there are three main strike slip-faults found in Java. In western Java has a still active NE–SW Cimandiri fault cross-cut the whole of West Java. The second strike slip-fault named the Citandui fault, occurs in western Java and trends NW–SE. The third sys-tem occurs in central Java, namely central Java fault as a NE–SW left-lateral strike-slip fault which crosscut the whole island (Setijadjiet al., 2006).
Mineral deposits
Mineral occurrences in Java are located in the physiographic area known as the Southern Mountains. This physiographic area contains the most extensive exposures of Tertiary mag-matic rocks in the island that range in age from Eocene to Upper Miocene (Setijadji et al., 2006; Smyth et al., 2005; Soeria-Atmadja et al., 1994), this physiographic area is considered the most prospective region for metallic mineral deposits. Western Java hosts number of ep-ithermal deposits of precious metals associated with the calc-alkaline volcanism, still active in
the area. Its major metallogenic event during the Miocene and the Pliocene are located in the Bayah Dome, a Tertiary-Quaternary volcanic structure at western of Java. Gold ore of West Java deposited in many districts (Figure 2a).
Application of weight of evidence in mineral potential mapping
The steps in applying weight of evidence (Bonham-Carter, 1994) are follow:
1. Choose a series of maps that are likely to be evidence for predicting mineral deposit. A particular deposit type and associated con-ceptual deposit model should be used to guide the selection process.
2. For each map, assumed to be multi-class (categorical or higher measurement lev-els), determine the optimum reclassifica-tion scheme to binary form, maximizing the spatial association between the map and the deposit point. Weight of evidence calculation can be used for this optimiza-tion process.
3. Check for pairwise Conditional Indepen-dence, CI between the binary maps. Delete problem maps, or combine binary maps to reduce effect of CI.
4. Combine the binary maps with weights de-termined in step 2. This can be carried out either with a modeling language internal to GIS, or with external modeling program. Make new maps showing posterior prob-ability. Optionally, calculate the effects of uncertainty in the weight, and uncertainty due to missing information, and produce an uncertainty map.
3 Research methodology
Research preparation
MINERAL POTENTIAL MAPPING USING GEOGRAPHIC INFORMATION SYSTEMS
Figure 1: (a) The locality of research area in West Java, Indonesia (modified from van Bemmelen, 1949). (b) Physiographic map of West Java (after van Bemmelen, 1949 and Martodjojo, 1984 in Suparkaet al., 2007).
Spatial data processing and analysis
Mineral deposit database: The study area contains 134 metallic deposits and industrial mineral occurrences of various sizes, but not all of metallic deposits are related to Au oc-currences. There are 107 metallic deposits occurrences containing Au (based on attributed table of metallic deposits layer) which are used in this study (Figure 2b).
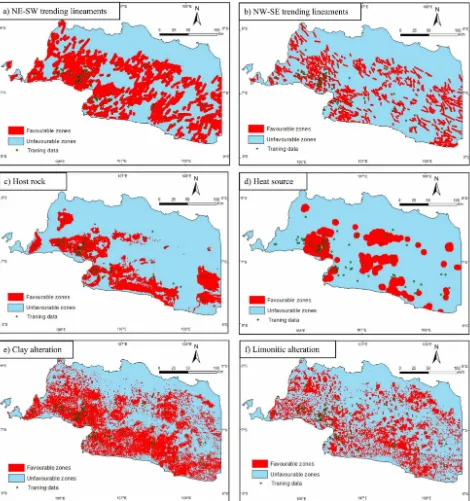
Lithology: Lithology map is created from ge-ological map, collect as secondary data that dig-ital geological map is derived from digdig-ital ver-sion of several 1:100,000 scale geological maps (Figure 2b). So, based on the characteristics of mineral deposits in study areas, all of Tertiary to Pleistocene lithology unit is selected for host rocks (Figure 3a) and Tertiary intrusive rocks are considered as heat sources (Figure 3b).
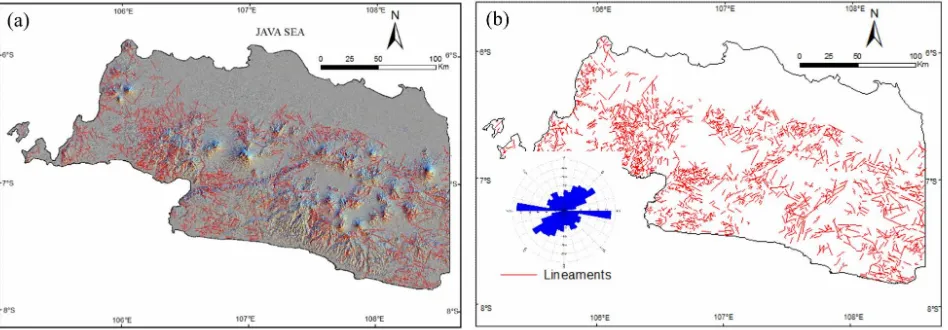
Geological Structure: In order to identify lin-eaments from the DEM, four shaded relief im-ages were generated. The first step is the pro-duction of four separate shaded relief images with light sources coming from four different directions. The shaded relief image created had a solar azimuth (sun angle) of 0°, 45°, 90°, 315° (Figure 4a–d) and a solar elevation of 45°. The second step is to combine four shaded relief im-age to produce one shaded relief imim-age (Fig-ure 5a). The last step, the lineament is digi-tized using manual extraction techniques from one shade relief (Figure 5b). The orientation of the lineament is analyzed by rose diagram. In this study, the lineament dived into two direc-tion NE–SW and NW–SE because structure in study area are mostly have these direction (Fig-ure 5b).
Hydrothermal alteration: Two hydrothermal alteration maps as clay and limonitic alteration are derived from Landsat 5 TM. The first step in this methodology is to use the software defo-liant technique to enhance the spectral response of each alteration mineral (clay and iron oxide alteration zone). Clay alteration is generated using band ratio 4:3 and 5:7 and limonitic al-teration by using band ratio 3:1 and 4:3. Band ratio 4/3 refers to vegetation index, band ratio
5/7 refers to clay mineral index and band ratio 3/1 refers to limonitic index.
Landsat 5 TM is use to generate the clay and limonitic alteration. They use software defo-liant method to extract the clay and limonitic al-teration by using divided tool (spatial analysis tools>>math>>divided) and principal
com-ponents (spatial analysis tools>>multivariate >> principal components) tool in GIS. The
re-sult of clay and limonitic alteration show in Fig-ures 6a and 6b.
4 Data analysis
The geological evidence features that are used as predictors of gold potential in the study area consist of 6 evidence maps as follows: NE– SW trending lineaments, NW–SE trending lin-eaments, host rocks, heat sources, clay alter-ation and limonitic alteralter-ation. Mineral deposits are split into 2 subsets. First subset of 80 (75%) of the total 107 known mineral deposit occur-rences are used to generate the probabilistic models (called as training data). The other sub-set of 27 (25% called as validation data) of 107 known mineral deposit occurrences are used to validate the probabilistic models (called as val-idation data). The mineral deposits that com-prise the validation subset were chosen ran-domly. A pixel size of 30 × 30 m was used in the probabilistic mapping of Au mineralization potential. All binary maps need to convert into raster with pixel size 30×30 m because Remote sensing data in here is 30×30 m.
For select the cutoff distance was considered three criteria, the Studentized C, Contrast (C) and mineral occurrences. The Studentized C is the first parameter for considering the cut off distance. And Contrast is the seconded param-eter. Both of them need to be correlated with the percentage of mineral occurrence. The Stu-dentized value of C is used to define the opti-mum cutoff. Ideally it is nice to see a Studen-tized value larger than 1.5 or even 2.
Calculating weights of evidence of NE–SW trending lineaments
MINERAL POTENTIAL MAPPING USING GEOGRAPHIC INFORMATION SYSTEMS
Figure 3: (a) Tertiary-Pleistocene host rock. (b) Tertiary intrusive rock (heat source).
Figure 4: Four shaded relief images derived from DEM with different illumination directions (sun azimuth) of 0◦, 45◦, 90◦, and 315◦, with a solar elevation of 45◦.
Figure 6: (a) Clay alteration map using the software defoliant technique. (b) Limonitic alteration map using the software defoliant technique.
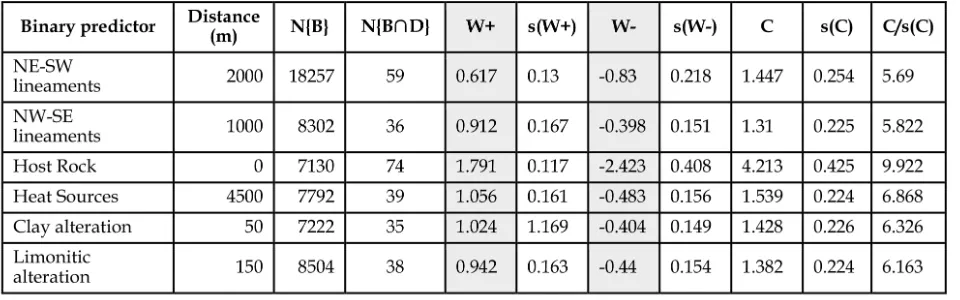
buffered at 250 to 6000m, and crossed with the raster mineral occurrence point map to esti-mate weights of evidence of domain (Table 1). The Studentized C (5.69) is highest at 2000 m and contrast is highest at 5000 m. The opti-mum buffer is defined at 2000 m. The resulting buffered lineament domain cover 18257 km2 (39.86%) of area, 59 (73.75%) out of 80 mineral occurrences are present in this distance (Figures 7a–b). The weight of evidence analysis reveals a strong correlation between the lineament do-main and mineral occurrences and buffer at optimum distances for each evidence maps as shown in Figure 8.
Test of conditional independence
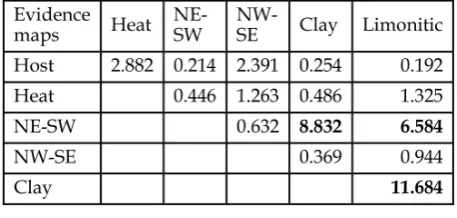
As a result in the Table 2 indicate that the value ofχ2 are smaller than the 5.4, thus the hypoth-esis for conditional independence is obeyed or accepted at this probability level (Alder and Roessler, 1972), except the pair NE–SW and Clay, NE–SW and limonitic, and clay and limonitic are bigger than 5.4. Thus, three binary predictor patterns are not statistically signifi-cant. Based on the criticalχ2used, they can still be combined to conduct map mineral potential but the statistical validity of the resulting pos-terior probability map must be examined by applying an overall test of conditional indepen-dence (Carranza, 2002).
Table 2: Calculated (χ2) values for testing con-ditional independence between all pairs of bi-nary maps with respect to gold occurrences.
5 Results and discussion
Probabilistic mapping of gold minerals poten-tial
MINERAL POTENTIAL MAPPING USING GEOGRAPHIC INFORMATION SYSTEMS
Figure 7: (a) Buffer distance s to the NE-SW lineaments. (b) Graph showing the studentized con-trast, C and percent of Au occurrences related with buffer at distance for NE–SW trending.
MINERAL POTENTIAL MAPPING USING GEOGRAPHIC INFORMATION SYSTEMS
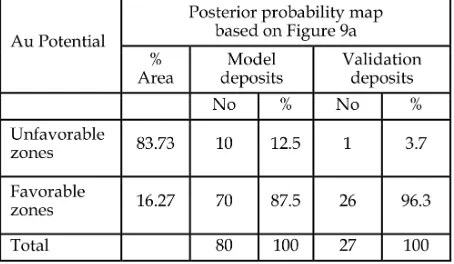
Table 3: Inventory of Au occurrences in zones of different posterior based on Figure 9a, which are derived from all of predictor patterns present in Table 1, and based on resulting from exclusion of clay and limonitic alteration binary predictor patterns.
P{B} = 80/45803 = 0.0017466 and loge{D} = loge(P{B}/(1−P{B}))= -6.3483.
According to the value of posterior proba-bilities, the favorability map of Au potential is separated into favourable and unfavourable zones. A ratio less than one (Pposterior/Pprior
= 0.0017466) are indicated as unfavorable zone and a ratio greater than one are indicated as fa-vorable zone. The favorability maps of Au min-erals potential are shown in Figures 9a–b.
Model validation
The posterior probability map of gold occur-rence in Figure 9a indicates that about 16.27% is favorable zones and 83.73% is unfavorable zones (Table 3). Due to gold occurrences map reveals that 10 (12.5%) of 80 occurrences gold deposits are presented in unfavorable zones and 70 (87.5%) are present in favorable zones of the model deposits. Moreover, there have only one gold validation deposits are located in un-favorable zone while other 26 gold deposits are located in favorable zone; it means the statis-tical validity is acceptable (96.3% of validation deposits).
Based on the Figure 9b clarified that about 21.62% of study areas is favorable zone and 78.38% is unfavorable zone. For gold
probabil-Table 4: Inventory of Au occurrences in zones of different posterior based on resulting from ex-clusion of clay and limonitic alteration binary predictor patterns (Figure 9b).
deposits fall within favorable zones and there are 26 (96.3%) among of 27 gold validation de-posits (Table 4). According to model validation, the statistical validity is acceptable. Depend on the conditionally independent, high statis-tically significant contrasts validation model; the posterior probability of gold potential map (Figure 9b) has higher successful rate then the gold potential map (Figure 9a).
Overall test
The posterior probability map as shown in Fig-ure 9b was analyzed by an overall test for con-ditional independence, the result of predicted number of deposits is 91 (formula of overall test, Table 5). The observed number of mineral deposit is 80, therefore the predicted number of deposit is higher the observed number of min-eral 11 (13.5%). According to the condition of overall test, this map was accepted as statisti-cally valid.
Gold potential map
Based on the ratio of posterior probability to prior probability (Pposterior/Pprior) (Figure 9b),
the resulting predictive map is classified into three categories: low prospectively, moderate prospectively and high prospectively. Thus, if the ratio is less than 1 (Pposterior/Pprior<1) then
Figure 9: (a) Posterior probability map of Au in research area, derived from all predictor patterns present in Table 1. (b) Posterior probability map of Au in research area, resulting from exclusion of clay and limonitic alteration binary predictor patterns.
Table 5: Summarized of overall test condi-tional independence in posterior probability map shown in Figure 11.
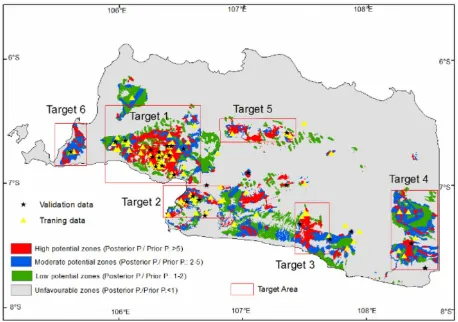
Figure 10: Predictive map of gold in West Java and generate prospective target area for Au.
from 1–2 is classified as low potential, if the ra-tio range from 2–5 is classified as moderate and if the ratio is greater than 5 is classified as high (Figure 10).
From the result of the Au prospectively map in Figure 10 indicated that about 3649km2
MINERAL POTENTIAL MAPPING USING GEOGRAPHIC INFORMATION SYSTEMS
and Purwakarta (Target 5), Pandeglang (Hon-jie Igneous Complex, target 6). In contrast, there have no potential area of gold deposit in Coastal Plan of Batavia.
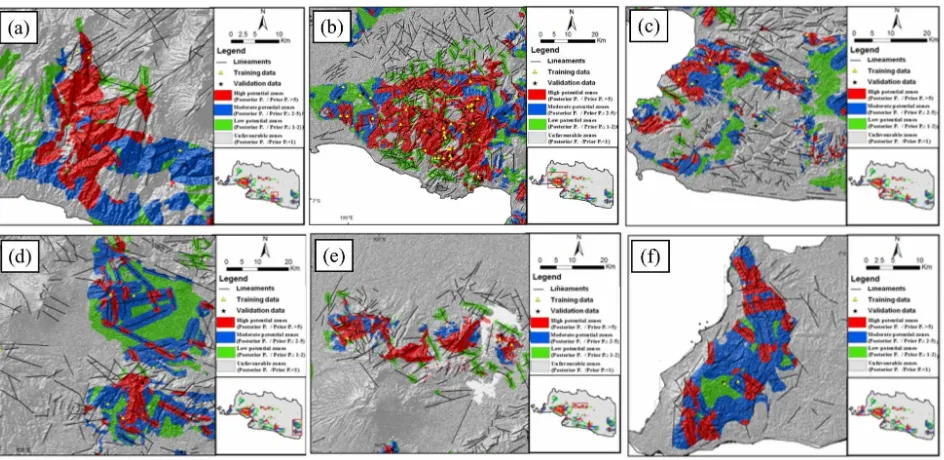
Prospective Target 1: The Bayah Dome (tar-get 1) in the western part of the Sunda–Banda arc is high potential zones by low-sulphidation epithermal vein sytems including Gunung Pon-gor, Cikidang, Cirotan, Ciawitali Cikotok de-stricts and aother deposits. The area of highest potential are dominated with major NE–SW and NW–SE lineaments, the intersection zones between lineaments, and also characterized by minor N–S lineament (Figure 11a), which could provide fluid pathways for mineralizing fluids at upper crustal levels and facilitate the move-ment of deep-crustal fluids to higher crustal levels, as well as provide structural traps and the appropriate physio-chemical conditions conductive to ore deposition. Lithologies per-missive high potential is dominaied by the intrusive intermediate, extrusive intermediate lava/poymict/pyroclastic, sandstone, breccias and claystone-shale, which the ranges of age are between Pleistocene-Eocene.
Prospective Target 2: The prospective target 2 is located in southern part of West Java; the potential zones are dominated in Ciemas de-strict. This region is covering the Cigaru local mine and there are several prospect areas such as Cimanggu, Cijiwa, Cilubang, Cipaku, and Citugu and some exploration works have been conducted by Hunamas and Mispec (Syafrizal et al., 2011; Basuki et al., 2012). The potential zones are located and parallel to major NW– SE lineaments (Figure 11b). The lineaments are not dense like target 1. The lithologies asso-ciated with the potential zones are including Upper Miocene to Miocene intrusive interme-diates, Lower Miocene extrusive intermediate lava, Miocene-Pliocene clastic limestone, and Eocene sandstones.
Prospective Target 3: The prospective target 3 is located Garut Renency, about 75 km to the southeast of the major city of Bandung. These
julang, Arinem, Pakenjeng, Cihar, Cibaliung, Bunikasih and Tutugan Area. The potential zones are associated with NE–SW and NW– SE lineament (Figure 11c) and the litologies is hosted by extrusive intermediate pyroclastic, extrusive felsic lava, intrusive intermediate and the ranges of age from Miocene–Upper Pleis-tocene.
Prospective Target 4, 5, and 6: The prospec-tive target 4, 5, 6 are located in Tasikmalaya, Bogor, Cianjur, Purwakarta and Pandeglang (Honjie Igneous Complex, target 6). The po-tential zones are mostly associated with NE– SW and NW-SE lineaments (Figures 11d–f). There are many gold mineraliation such salopa, Cineam, Cipatu (Tasikmalaya), Cibaliung, Ci-curug, Cibeber (Honjie Igneous Complex), Aw-ilega Gunung Parang (Purwakarta), Gunung Pancar (Bogor). The litologies is hosted by In-trusive intermediate, claystone-shale, exIn-trusive intermediate polymict, sandstone, extrusive felsic lava, intrusive felsic (Lower Miocene– Pleistocene).
Weight of evidence approach
Weight of evidence method is practically suited for modeling the spatial correlations between geological features and known mineral occur-rences which are important for mapping min-eral potential. The results of the gold poten-tial map are getting from executing the different six evidences maps such as Host rock (Tertiary-Pleistocene lithology unit, heat source (Tertiary intrusive rock unit), NE–SW lineaments, NW– SE lineaments, clay alteration and limonitic al-teration.
All of evidence maps were created buffer at distance and optimum cutoff distance are sum-marized in Table 2. The positive weight (W+) of host rock evidence map and ratio of percentage of Au occurrences to percentage of total area is greater than other evidence maps, following by Heat source, clay alteration, NW–SE lineaments limonitic alteration, and NE–SW lineaments ev-idence maps (Figure 12).
em-Figure 11: Mineral potential map superimposed on shaded of topography, overlain by lineaments and Au occurrences in Target 1, 2, 3, 4, 5 and 6.
Figure 12: Graph showing the positive weight (W+) of all evidence maps which used to pre-dict Au occurrences map.
strongest spatial predictor than other. The hill-shade images derived from ASTER GDEM was useful to extract lineaments feature and NE–SW lineaments is important one.
The test for conditional independence shows that chi-square value for the pair NESW and Clay, NESW and Limonitic, and Clay and Limonitic are statistically significant. They do not reject the binary maps of these geological features in the analysis because gold mineral-ization in the district is known to be associated with them.
6 Conclusion
The method of WofE is applied to obtain gold potential map based on geological, structural, and remote sensing data or maps, and also, 107 known gold mineralized locations in West Java. These exploratory maps are integrated to produce the final predictive mineral po-tential map. The result of Au popo-tential map indicates that about 9902 km2 (21.62%) of the
province as favourable zones. It predicts cor-rectly 74 (92.5%) of the 80 training data and pre-dicts correctly 26 (96.35%) of the 27 validation data. Moreover, the result of Au prospectively map indicates that about 3649 km2 (7.96%) of research area is low potential, 2844.75 km2
MINERAL POTENTIAL MAPPING USING GEOGRAPHIC INFORMATION SYSTEMS
in research area is associated with NE–SW and NW–SE structure/lineaments, dominated surrounding the Tertiary extrusive volcanic rock and intrusive rock and hosted in Miocene to Pleistocene lithology rock unit The major prospective target areas for future exploration are located in southern mountain of research area like Ciemas, Garut, Cianjur, Tasikmalaya, and Bayha Dome is located western of Sunda-Banda arc. The small prospective target areas for future exploration are located in Bogor zone, Purwakarta and Pandeglang (Honjie Igneous Complex). These mineralization zones are also confirmed following field checking or visit of the study area. These target areas desirably include the variety of mineralization elements. This research shows that the method of WoE is an effective technique for the exploration and evaluation of regional-scale mineral deposits.
Acknowledgements
I would like to express my gratitude to the ASEAN University Network/Southeast Asia Engineering Education Development Network (AUN/SEED-NET) and Japanese International Cooperation Agency (JICA) providing me to study ‘Master Degree’ at Gadjah Mada Univer-sity in Indonesia.
References
Alzwar, M., Akbar, N., and Bachri, S. (1992) Sys-tematic geological map. International Journal of Remote Sensing, 21, pp. Indonesia, quad-rangle Graut 6 and Pameungpeuk 1208-3, scale 1: 100.000, Geological Research and Development Center, Bandung.
Basuki, N.I., Prihatmoko, S., and Suparka, E. (2012) Gold mineralization systems in South-ern Mountain Range, West Java. Proceed-ings of Banda and Eastern Sunda Arcs 2012 MGEI Annual Convention 26-27 November 2012, Malang, East Java, Indonesia.
Bonham-Carter, G., Wright, D., and Agterberg, D. (1989) Weights of evidence modeling with GIS: A new approach to mapping mineral de-posits. Geological Survey Canada Paper, 89-9: 171–183.
Carranza, E.J.M. (2002) Geologically-constrained Mineral Potential Mapping. PhD Thesis, Delft University of Technology, The Netherlands, 480p.
Carranza, E.J.M. (2003) Practical Exercise: Weight of Evidence Modeling for Mineral Potential Mapping. MREE Elective Module 9, 29pp.
Claproth, R. (1989) Petrology and Geochem-istry of Volcanic Rocks from Ungaran, Cen-tral Java, Indonesia. Doctor of Philosophy Thesis, Department of Geology, University of Wollongong.
Idrus, A., Fadlin, Putri, R.I. and Hatmanda, M. (2013) Styles and Characteristics of Precious and Base Metal Mineralization at the South-ern Part of West Java Region, Indonesia, The 5th AUN/SEED-Net Regional Conference on Geological Engineering 15-16 January 2013, Kuala Lumpur, Malaysia.
Marcoux, E., and Mil´esi, J.P. (1994) Epithermal gold depositsin West Java, Indonesia: geol-ogy, age and crustal sources: in van Leeuwen, T.M., Hedenquuist, J.W., James, L.P., and Dow, J.A.S., eds., Mineral deposits in Indone-sia, Discoveries of the Past 25 years: Journal of Geochemical Exploration, v. 50, pp. 393-408.
Martodjojo, S., 1984, Evolusi Cekungan Bogor, Jawa Barat, Doctoral Dissertation, Depart-ment of Geology, Institut Teknologi Bandung, Bandung, 355p.
Mil´esi, J.P., Marcoux, E., Nehlig, P., Sunarya, Y., Sukandar, A., and Felenc, J. (1994) Cirotan, West Java, Indonesia: a 1.7 Ma hybrid ep-ithermal Au–Ag–Sn–W deposit. Economic Geology 89: 227– 245.
Mil´esi, J.P., Marcoux, E., Sitrous, T., Simand-juntak, M., Leroy, J., and Baily L. (1999) a Pliocene supergene-enriched epithermal Au-Ag-(Mn) deposit. Mineral deposita 34: 131-149.
Setijadji, L.D., Kajino, S., Imai, A., and Watan-abe, K. (2006) Cenozoic island arc magma-tism in Java Island (Sunda Arc, Indonesia): Clues on relationships between geodynam-ics of volcanic centers and ore mineralization. Resource Geology
P. (2005) East Java: Cenozoic basins, volca-noes and ancient basement. Jakarta Proceed-ings, Indonesian Petroleum Association An-nual Convention, 30th, pp. 251–266.
Suparka, E., Aziz, M., Abdullah, C.I., and Su-parka, 2007. Mineralization of Cu-Au por-phyry deposits in Cihurip and Surrounding area, Garut Regency, West Java. Joint Con-vention The 36th IAGI Annual Convention and Exhibition, Bali.
Syafrizal, Indriati, T., Heriawan, M.N., Hede, A., N., H., Hutabarat, Y., and Saing, S., (2011) Base-metal and gold mineralization in Jampang Complex, Cigaru Local Mine, West Java, Indonesia, Proceedings of the 1st Asia Africa Mineral Resources Conference 2011, Fukuoka, Japan.
Soeria-Atmadja, R. Maury, R. C., Bellon, H.,
Pringgoprawiro, H., Polves, M. and Priadi, B. (1994) Tertiary magmatic belts in Java. Jour-nal of Southeast Asian Earth Science 9: 13–27. Subandrio, A.S, and Basuki, N.I. (2010) Alter-ation and vein textures associated with gold mineralization at the Bunikasih Area, Pan-galengan, West Java, Jurnal Geologi Indone-sia, v. 5(4), pp. 247-261.
Utoyo, H. (2007) Alteration and mineralization of ancient caldera in Cupunagara, Subang, West Java. Proceedings Joint Convention Bali 2007, The 32nd HAGI, The 36th IAGI, And The 29th IATMI Annual Conference And Ex-hibition.