Budi Hidayat: Estimasi Dampak Program Asuransi Kesehatan
MODELLING THE DEMAND FOR HEALTH CARE GIVEN INSURANCE:
NOTES FOR RESEARCHERS
PEMODELAN DAMPAK PROGRAM ASURANSI KESEHATAN TERHADAP PERMINTAAN PELAYANAN KESEHATAN: CATATAN-CATATAN BAGI PARA PENELITI
Budi Hidayat
Departemen Administrasi dan Kebijakan Kesehatan, Fakultas Kesehatan Masyarakat, Universitas Indonesia,
Depok
VOLUME 11 No. 02 Juni l 2008 Halaman 58 - 65
Artikel Penelitian
ABSTRACT
Understanding on health care demand given insurance gives precious information to anticipate health care costs in the future, which in turn provides valuable information for policy makers, among other, to estimate claim rate, set up premium, design cost-sharing policy, etc. Unfortunately, estimating the effects of health insurance on health care demand is not straight forward. This paper identifies crucial factors (e.g., adverse selection and provider behaviour) that need to be considered in estimating the effects of health insurance on health care demand. These considerations persuade researchers to use a rigorous econometric model in estimating health care demand given insurance with a view to isolate the true effects of health insurance program. Such considerations can be further classified into two-main factors. First is the features of the dependent variables used to measure the demand, and second is the source of the data (or study design) used in the analysis.
Keywords: modelling, health insurance, demand healthcare services, applied econometrics
ABSTRAK
Pemahaman tentang dampak program asuransi kesehatan terhadap permintaan pelayanan kesehatan memberikan informasi berharga untuk mengantisipasi kebutuhan biaya kesehatan di masa mendatang. Informasi ini pada akhirnya bermanfaat bagi para pengambil kebijakan, misalnya untuk memprediksi klaim rasio, menghitung premi, mendisain kebijakan iur-biaya, dan lain-lain. Namun demikian mempediksi dampak program asuransi kesehatan terhadap permintaan pelayanan kesehatan cukup kompleks. Tulisan ini mengidentifikasi faktor-faktor penting (seperti seleksi bias kepemilikan asuransi dan perilaku pemberi pelayanan kesehatan) yang perlu dipertimbangkan dalam mengestimasi dampak program asuransi kesehatan terhadap permintaan pelayanan kesehatan. Kedua pertimbangan ini mengharuskan peneliti menggunakan model ekonometrik yang cocok untuk mendeteksi efek murni program asuransi kesehatan pada permintaan kesehatan. Kedua pertimbangan tersebut selanjutnya dapat dikelompokkan menjadi dua hal utama. Pertama adalah karakteristik variabel terikat yang digunakan untuk mengukur permintaan pelayanan kesehatan dan kedua adalah sumber data (atau desian studi) yang digunakan dalam analisis.
Kata Kunci: pemodelan, asuransi kesehatan, permintaan pelayanan kesehatan, aplikasi ekonometrik
INTRODUCTION
Health care demand information allows health planners to anticipate the volume of health services that will be demanded as a function of the services’ price, insurance, and other characteristics of the services and the population, which in turn provides information to determine the location and staffing of health facilities accurately. Hence, understanding on health care demand can be used to improve allocation of scarce resources in the health sector, the organization of health care systems, and the government’s role in the production, finance, delivery, and management of health services.1 For establishing
health insurance, knowledge about health care demand given insurance offers precious information to anticipate health care costs in the future, which in turn provides important information for the insurer to estimate claim rate, set up premiums, and design cost-sharing policy.2
Unfortunately, estimating the effects of health insurance on health care demand is somewhat more complex than estimating health care demand in general. In estimating healthcare demand, a complexity arises as the underlying behavioral structures that drive healthcare utilization might have implications for the choice of the most appropriate model.3 Further, as people demand both health
the effects of health insurance on the demand for health care.
THEORITICAL ANALYSES OF HEALTH CARE DEMAND
Theoretical analyses of health care demand consist of two approaches. The first uses the traditional consumer theory approach, developed by Grossman. Grossman assumes that the demand for health care is essentially seen as the result of patients’ intertemporal utility maximization, and the demand for medical care is primarily patient determined, though conditioned by the health-care delivery system. Health services and other health inputs are combined through a health production function to produce the commodity of value to consumers, good health. The demand for health care is therefore derived from the demand for health.4 The
second approach takes a principal-agent theory. This theory argues that physician (agent) determines health care utilization on behalf of the patient (principal) once initial contact is made.5
MODELLING THE EFFECTS OF HEALTH INSURANCE ON DEMAND: GENERAL ISSUES
Modelling the effects of health insurance on the demand depends largely on the empirical specifications used in the analysis. If such specifications do not reflect the underlying behavioral structures that drive health care demand and ignore endogeneity problem of insurance, estimates will not accurately reflect actual health care demand. Thus, suggested policies may have unintended consequences.
In general, modelling health care demand given insurance is directed to deal with adverse selection and provider moral hazard behaviour. Adverse selection has received a great deal of attention from health economists because it is one of the most significant market failures in the private insurance market.1 This phenomena occurs when persons with
poor health (and therefore needing more medical care) tend to join health insurance with high benefits and persons with good health tend to avoid such insurance because of its high cost. If adverse selection (in econometric terms, it is equivalent to endogeneity) is present, elasticity estimates will measure the difference in needs of people with different health and socioeconomic status in addition to the quantity response to the price change. This adverse selection effect has been empirically studied. 6,7,8,9,10,11
Provider morale hazard has also received a great deal of attention from health economists. In health
care markets, physicians typically act a double role-as an evaluators and supplier-so they play an important role in determining the amount of services that patients should consume.1 Information
asymmetry provide physicians the opportunity to influence demand through their role as health evaluators-known as supplier induced demand (SID). A large body of empirical research is devoted to testing the SID hypothesis, which states that in the face of negative income shocks, physicians may exploit their agency relationship with patients and may change their patterns of practice, perhaps by providing excessive care, or prescribing more intense treatments.12 Furthermore, physicians act as an
agent once health care is initiated by the patient and may not consider price in the same way as the patient would. This behaviour is most likely to happen in health care markets where physicians’ income is related to the amount of services they provide (referred to fee-for-services payment), and where patients’ expenses are covered by health insurance schemes.13,14 Empirical econometric
models which considered the provider behaviour have been adopted in several health care demand studies.15,16,17
APPLIED ECONOMETRICS
Most applied econometrics models typically used in the literatures to estimate the effects of health insurance on demand are directed to address both adverse selection and provider behaviour. Such approaches are motivated in order to isolate the true effects of insurance, and that can be further classified into two main considerations: first is the features of the dependent variables used to measure the demand and second is the source of the data (or study design) used in the analysis.
The features of the dependent variables
Different researchers have used different measures of health care demand. It is sometimes measured by either discrete categorical (e.g., use of health care services, use of specific provider type) or discrete count (e.g., number of visits, quantity of health care services used, cost of health care services incur).
a. Discrete categorical variable
than two alternatives, the probit and logit models must be extended. Possible alternatives are the multinomial logit, nested multinomial logit model or multinomial probit.
programs on access and equity in access in Indonesia. An advantage of the MNL is that more than two courses of action can be estimated within the same equation, and hence more accurately
! ! !
" # !
$ ! % & #
' ( ! ) ' ' ' *& +
,--.
! /
! ! '
*& ' ' ! 0
1 * # 2 * * " 3 '
' 4 5 #
% ! ( ' & '
0 *
0
6 ,--7 ' '
. ! '
1 * 0 " ! 0
# *
(
' '
*
Table 1. Examples of studies on the effects of health insurance on health care demand (measured by discrete category)
Table 1 presents 3 examples of published studies that used discrete choice econometric models. Waters7 used both univariate and bivariate probit
estimation techniques to estimate the effects of health insurance on the demand for health care in Ecuador. He developed and used methodologies to evaluate the impact of the General Health Insurance (GHI) on the use of health care services. The analysis was applied on the household survey data, and found that that being insured under the GHI increased the probability of using curative services more than twice. Trujillo9 analyzed the relationship between health
status and insurance participation, and between insurance status and medical care use in the context of a social health insurance with an equalization fund (SHIEF) in Columbia. To control for adverse selection of having insurance, the full-information maximum likelihood (FIML) estimations method was applied to estimate three-equations simultaneously (e.g., having social insurance, having private insurance, and using medical care). His study concluded that participation in the Colombian social health insurance scheme significantly increased the use of medical care.
Hidayat et al.19 used a multinomial logit (MNL)
to estimate the effects of social health insurance (SHI)
represent real choices. The analysis was applied to the second round of the Indonesian Family Life Survey data. Using an augmented Hausman specification test, employed with the instrumental variable approach, and a method developed by Waters, the study found that SHI program was indeed exogenous, and hence no correction endogeneity was needed. The study also concluded that participation in the SHI program (Askes and Jamsostek) increased the
probability of formal health care use.
b. Discrete count variable
Econometric models of discrete count data are restricted by definition to non-negative integers. Appropriate estimation techniques are therefore given by the family of count data models.20 Empirical
The Poisson regression model provides a standard framework for the analysis of count data. Cameron et al.,21 used this regression to model the
number of doctor consultations in Australia. The probability of observing a count value conditional on a set of explanatory variables is assumed as follows:
(1)
where is a k-vector of explanatory variables, exp(.)
is the exponential function to ensure non-negative integers, ! indicates factorial, and is the conditional mean of the count.
Parameter in (1) is specified as: , where β is the k
-vector of parameters to be estimated. This model assume that its mean and its variance are both equal to its one parameter, λ In most health economic applications of event count models, however, the distribution of a typical a count dependent variable displays overdispersion (the variance of the data exceeds the mean), contains a large number of zeros and has a long right tail. Violating the presence of overdispersion leads to inadequate model prediction; that is the predicted probabilities are incorrect, especially the numbers of zeros.
The negative binomial (NB) model, which allows for such over dispersion, has been applied extensively in studies of health care demand.3,22 The NB model
relaxes the equality condition between mean and variance by including individual heterogeneity. That is the NB maintains the Poisson process (1) but extends to an error term for which a (gamma) distribution is assumed. The resulting NB density is:
(2)
where is the gamma distribution function,
is the precision parameter specified as ,
and k is an arbitrary constant. The mean and variance
of the NB regression model are given by: This suggests that the variance is now greater than the mean, thus the NB model can account for overdispersion in the data. If the parameter α is equal to zero, we get the Poisson model.
While both Poisson and NB distributions admit zero values in the dependent variable, the samples often contain a large proportion of zeros, which exceed what would typically be predicted by such models.23 The standard solutions to accommodate
the excess zeros include: (i) a zero-inflated variant, (ii) a hurdle variant, and (iii) a latent variant.
The inflated variant consists of the zero-inflated Poisson (ZIP) and zero-zero-inflated NB (ZINB) models. The ZIP model remains rather inflexible in the sense that the nonzero counts are assumed to follow a Poisson distribution. Furthermore, it has been found that the ZIP parameter estimates can be severely biased if the nonzero counts are overdispersed in relation to the Poisson distribution. As many count data are often overdispersed, the ZINB could be more appropriate than the ZIP. The ZINB distribution can be written as24:
(3)
where and m is the mean of the underlying
NB distribution. The mean and variance of the ZINB are:
The second approach to accommodate the excess zeros is a hurdle variant24, which also
consists of two variants: Hurdle Poisson (HNP) and Hurdle Negative Binomial (HNB). The hurdle model is often treated as synonymous with a two-part model (TPM).The first decision is whether to seek health care, and the second decision is the frequency of
!
" #
!
* 6 88 9 - -6.- -6
% ' * ' 9 9- : 7 6,7 -6:8
; & ! ' 0 77-: 4 -6.-
-68-* < 9 9- ,6,7 -6..
* 789 78 6:- -67
; & * ,--- 9 7 , 8 .688 4
* Gurmu (1997) analysed two different dataset.
care. Thus, this model allows the contact decision and the frequency decision to be generated by separate probability processes. Duan et al.,25 have
tested alternative models of demand, and found that the hurdle model that separates the decision about health care demand into two separate decisions was preferred. Pohlmeier and Ulrich15 used the HNB model
to analyze the demand of ambulatory services, measured by the number of physician visits during the year, in Germany. They have demonstrated that HNB is a better alternative than one-part models if the dependent variable contains a large proportion of zeroes and if the dependent variable results from two separate decision-making processes. The limitation of the hurdle model is that it valid only to measure repeat visits to the doctor related to a single spell of illness.
The first part of the hurdle two-part structure is specified as26:
(4)
where the subscript h denotes parameters associated with the hurdle distribution. The likelihood function associated with this stage of the hurdle process can be maximized independently of the specification of the second stage. This stage of the hurdle process involves only binary information so the parameters (β) of the mean function and the parameter α are not separately identifiable.
The second part of the hurdle model is assumed to follow the density for a truncated NB. The density functions for the truncated NB distribution are given by Deb and Trivedi26:
(5)
In the second stage, the parameters were estimated by using the sub-sample of observations with positive values of , denoted as: …. The mean and the variance of the count variable in the hurdle NB model are:
(6)
Another approach to accommodate the zero count data is latent class models.26 The models are
also based on the standard count data models, either Poisson or NB. The distribution function of the unobserved heterogeneity in the latent class models is approximated by a finite mixture (FMM) distribution. This distribution is based on the argument that observed counts are sampled from a mixture of populations which differ in their underlying (latent) health, and so in their demands for health care. That is, there may be severely ill individuals, who are high frequency users, at one extreme and perfectly healthy individuals, who are non-users, at the other. Jimenez-Martin et al.27 provided evidence
on the relative performance of the TPM and FMM specifications to estimate demand for health care equations, distinguishing between utilization of general practitioners (GPs) and specialists, for 12 European countries.
Count data models described above (Poisson, NB, ZIP, ZINB, HNP, HNB, and FMM) give consistent estimates only if the regressors are exogenous. If the regressors are endogenous, the ML estimation methods of the count data model would be inconsistent. To accommodate endogeneity of regressors, a linier instrumental variable (IV)28 and
generalized method of moments (GMM)29 have been
proposed. One nuisance of the former is that the standard errors are inconsistent in the presence of unknown heteroskedasticity, yielding invalid inference. This weakness can be overcome by the GMM estimator which gives consistent estimates where hetersoskedasticity occurred. Windmeijer and Santos-Silva29 provided an overview of the theoretical
basis of the GMM estimation technique for count data models with endogeneity, and have applied this estimator in explaining the number of doctor visits while treating health status as an endogenous variable. Empirical applications of the discrete count data models described above have been practiced by Hidayat30 to predict the effect of health insurance
concluded that estimates of health care demand given insurance have been shown to depend on the empirical specification used in the analysis. Not controlling the existence endogeneity of insurance leads to lower the parameter estimates.
not need to take into account the endogeneity of insurance choice in that the individuals, as a unit of analyses, had not chosen the coinsurance rates and therefore it was exogenous.
= # (
The Nature of the Study Designs
With regard to the study designs, econometrics models the effects of health insurance on health care demand can be classified into three categories: experimental, quasi-experimental, and observational.
a. Experimental Design
Experimental studies use random assignment into treatment and control groups to infer the effects of health insurance. Estimates from experiments are thought to provide a “gold standard” because the randomization of people into different treatments (health insurance) avoids the problem of selection bias in that individuals under study are not able to choose whether to obtain the treatment.31 A
well-known study on health insurance that used an experimental design is the Rand Health Insurance Experiment. The study controlled explicitly for selection bias by randomly assigning participants into five different insurance plans, with coinsurance rates ranging from zero (free health care) to 95%.17
Since the study used experimental, the authors did
b. Quasi-experimental Design
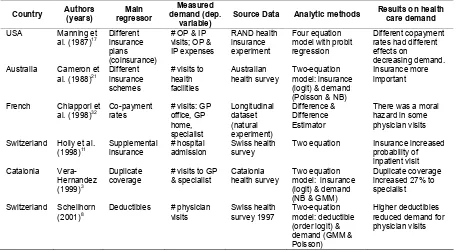
The second category of studies of the demand effects of health insurance is quasi-experiments (known as natural experiments). These studies are similar to experiments in that there are treatments and outcome measures, but in quasi-experiments individuals are not randomly assigned to treatment and control groups. Examples studies that used a natural experiment included studies in France32 and
Belgium33. Both studies took advantage of a change
in the co-payment rates that some French and Belgian insurers charged to their insured, which end up as controlled natural experiments. Given those studies used the data derived from a (natural) experiment design, the researchers ignored the endogeneity of insurance choice. The main concern is that the researchers must be able to control for all other factors that may have changed at the same time. Otherwise, the estimated effect of the policy change will incorporate the effects of all of the other unobserved factors that changed during the time period of analysis. Thus, to obtain estimates of the
true effect of the policy change, the researcher must be able to control for other factors that could have affected during the time period of analysis. A comparison group (similar to the control group in the experimental design) that does not receive the policy change is usually used to help address the question of what would have occurred had the policy not been changed.
c. Observational design
Neither experimental nor natural experimental designs are always available in many countries. Consequently, estimating the effects of health insurance on health care demand is often based on survey or administrative data. However, such estimates that use the data derived from observational design would pose some problems, typically referred to as selection bias (known as endogeneity of insurance).7,8,9 That is, health
insurance may correlate with unobserved heterogeneity that influences subsequent demand for health care. Where such correlations exist, it is quite difficult to separate the effects of health insurance from the effects of unobserved heterogeneity that influence insurance and subsequent demand. As a result, econometric models have been developed to deal with the problems associated with non-experimental data.
Cameron et al.21 are the first authors who
analyzed the choice of insurance and health care utilization simultaneously using non-experimental data. They developed a micro econometric model for interdependent demand for insurance and health care in order to control adverse selection of the insurance. A growing number of studies on the demand effects of insurance using non-experimental data were published where the authors take into account the endogeneity of the insurance choice. Holly et al.11 estimated a simultaneous two-equation
model for the probability of having admission to a hospital and the availability of supplementary insurance coverage based on health survey data from 1992/93. Vera-Hernandez6 studied the effects of
duplicate insurance coverage on both demand for visits to specialists and on the selection process of the private insurance market based on the 1994 Catalonia Health Survey. He estimated the model using the GMM estimator which accommodates both the endogeneity of insurance choice decision as well as the feature of count data. Likewise, Schellhorn8
utilized the GMM estimator to estimate the effects of deductibles on the number of physician visits in Switzerland.
CONCLUSIONS AND RECOMMENDATIONS
Existing applied econometrics to estimate health care demand given insurance are directed to tackle both adverse selection and provider behaviour in order to isolate the true effects of insurance, and hence guides appropriate policy options. Future studies in estimating the effect of health insurance on health care demand have to consider the type of dependent variables used to measure the demand as well as the nature of study designs.
REFERENCES
1. Feldstein PJ. Health Care Economics. Albany, New York. 1993.
2. Thabrany H. Health Insurance and the Demand for Medical Care in Indonesia. University of California at Berkeley. 1995.
3. Deb P, Holmes A.M. Estimates of Use and Costs of Behavioural Health Care: A Comparison of Standard and Finite Mixture Models. Health Econ 2000;9:475-89.
4. Grossman M. On the Concept of Health Capital and Demand for Health. Journal of Political Economy 1972;80:223-55.
5. Zweifel P. Supplier-Induced Demand in a Model of Physician Behaviour. In J. Van Der Gaag and M. Perlman (eds). Health, Economics, and Health Economics 245-67. North-Holland, Amsterdam, 1988.
6. Vera-Hernandez AM. Duplicate Coverage and Demand for Health Care. The Case of Catalonia. Health Econ, 1999;8:579-98.
7. Waters HR. Measuring the impact of health insurance with a correction for selection bias— a case study of Ecuador. Health Econ, 1999;8:473-83.
8. Schellhorn M. The Effect of Variable Health Insurance Deductibles on the Demand for Physician Visits. Health Econ, 2001;10:441-56. 9. Trujillo AJ. Medical Care Use and Selection in a Social Health Insurance with an Equalization Fund: Evidence from Colombia. Health Econ 2003; 12:231-46.
10. Harmon C, Nolan B. Health Insurance and Health Services Utilization in Ireland. Health Econ 2001;10:135-45.
11. Holly A, Gardiol L, Domenighetti G, Bisig B. An Econometric Model of Health Care Utilization and Health Insurance in Switzerland. European Economic Review 1998;42:513-22
13. Riphahn RT, Wambach A, Million A. Incentives Effects in the Demand for Health Care: A Bivariate Panel Count Data Estimation. J Applied Econometrics, 2003;18:387-405.
14. Delattre E, Dormont B. Fixed fees and physician-induced demand: a panel data study on French physicians. Health Econ, 2003; 12:741-54. 15. Pohlmeier W, Ulrich V. An Econometric Model
of the Two-Part Decision-Making Process in the Demand for Health Care. Journal of Human Resources, 1995;30:339-61.
16. Gerdtham UG. Equity in Health Care Utilization: Further Tests Based on Hurdle Models and Swedish Micro Data. Health Econ, 1997;6:303-19.
17. Manning WG, Newhouse JP, Duan N, Keeler EB, Leibowitz A, Marquis MS. Health Insurance and the Demand for Medical Care: Evidence from a randomized experiment. Am Econ Rev 1987;77:251-77.
18. Greene WH. Econometric Analysis (3rd ed) Prentice-Hall, Englewood Cliffs. 1997.
19. Hidayat B, Thabrany H, Dong H, Sauerborn R. The Effects of Mandatory Health Insurance on Equity in Access to Outpatient Care in Indonesia. Health Policy and Planning, 2004;19(5):322-35
20. Trivedi PK. Introduction: Econometric Models of Event Counts. Journal of Applied Econometrics, 1997;12:199-201.
21. Cameron AC, Trivedi PK, Milne F, Pigott JA. Microeconometric Model of the Demand for Health Care and Health Insurance in Australia. Review of Economic Studies, 1988;55:85-106. 22. Cameron AC, Trivedi PK. Econometric Models
Based on Count Data: Comparisons and Applications of Some Estimators and Tests. J App. Econometrics, 1986;1:29-53.
23. Mullahy J. Specification and Testing of Some Modified Count Data Models. Journal of Econometrics, 1986;33:341-65.
24. Kelvin KW, Yau1 KW, Andy HL. Zero-Inflated Negative Binomial Mixed Regression Modelling of Overdispersed Count Data with Extra Zeros. Biometrical Journal, 2003;45:437-52.
25. Duan N, Manning WG, Morris CN, Newhouse JP. A Cmparison of Alternative Models for the Demand for Medical Care. Journal of Business and Economic Statistics, 1983;2:115-26. 26. Deb P, Trivedi PK. Demand for Medical Care by
the Elderly: A Finite Mixture Approach. Journal of Applied Econometrics 1997;12:313-36 27. Jimenez-Martin S, Labeaga JM,
Martinez-Granado M. Latent Class Versus Two-Part Models in the Demand for Physician Services Across the European Union. Health Econ, 2002;11:301-2
28. Mullahy J. Instrumental Variable Estimation of Count Data Models: Applications to Models of Cigarette Smoking Behaviour. Review of Economics and Statistics, 1997;79:586-93. 29. Windmeijer FAG, Santos-Silva JMC.
Endogeneity in Count Data Models: An Application to Demand for Health Care. J Applied Econometrics, 1997;12:281-94.
30. Hidayat B. Estimating the Effects of Health Insurance Program on the Number of Outpatient Visits in Indonesia. Jurnal Manajemen Pelayanan Kesehatan, 2008;11:177-85. 31. Cook TD, Campbell. Quasi-Experimentation:
Design and Analysis Issues for Field Settings. Rand McNally, College Publishing Company, Illinois, Chicago. 1979.