Summary Mineral nutrition of Norway spruce (Picea abies (L.) Karst.) and beech (Fagus sylvatica L.) was investigated along a transect extending from northern Sweden to central Italy. Nitrogen (N) concentrations of needles and leaves in stands growing on acid soils did not differ significantly be-tween central Italy and southern Sweden (1.0 ± 0.1 mmol N g−1
for needles and 1.9 ± 0.14 mmol N g−1 for leaves). In both
species, foliar N concentrations were highest in Germany (1.2 mmol N g−1 for needles and 2.0 mmol N g−1 for leaves)
and decreased by 50% toward northern Sweden (0.5 mmol N g−1). Both species showed constant S/N and P/N ratios along
the transect. Calcium, K and Mg concentrations generally reflected local soil conditions; however, Mg concentrations reached deficiency values in Germany. Leaf area per unit dry weight varied significantly along the transect with lowest val-ues for Norway spruce recorded in northern Sweden and Italy (3.4 m2 kg−1) and a maximum in central Europe (4.7 m2 kg−1). A similar pattern was observed for beech.
Despite the low variation in foliar N concentrations on the large geographic scale, local and regional variations in N concentrations equalled or exceeded the variation along the entire continental transect. Furthermore, nutrient contents (i.e., nutrient concentration × dry weight per needle or leaf ) showed a greater variation than nutrient concentrations along the tran-sect. Nitrogen contents of Norway spruce needles reached minimum values in northern Sweden (2.4 µmol N needle−1)
and maximum values in Denmark (5.0 µmol N needle−1). The
N content of beech leaves was highest in Denmark (242 µmol N leaf−1).
At the German site, foliar N content rather than N concen-tration reflected the seasonal dynamics of foliar growth and N storage of the two species. During foliage expansion, there was an initial rapid increase in N content and a decrease in N concentration. This pattern lasted for about 2 weeks after bud break and was followed by 6 weeks during which dry weight and N content of the foliage increased, resulting in a further decrease in N concentration. During summer, dry weight and N content of mature needles of Norway spruce increased further to reach a maximum in autumn, whereas N concentra-tion remained constant. In spring, reallocaconcentra-tion of N from 1- and 2-year-old needles was 1.5 and 1.0 µmol N needle−1,
respec-tively. This remobilized N was a major source of N for the development of new needles, which had an N content of 1.5 µmol
N needle−1 after bud break. The seasonal remobilization of N
from old foliage decreased with increasing needle age. Needle N content and dry weight decreased progressively with age (1 µmol N needle−1 between age classes 2 and 5), whereas N
concentrations remained constant.
For Norway spruce, annual stemwood production was cor-related with needle N content but not with foliar N concentra-tion or with the total amount of N in the canopy. Interspecific and geographical differences in plant nutrition are discussed on the basis of competitive demands for C and N between growth of foliage and wood.
Keywords: beech, calcium, magnesium, nitrogen, Norway spruce, nutrition, phosphorus, potassium, remobilization, sul-fur.
Introduction
European forests are distributed from the northern boreal for-est line in Scandinavia to the southern Mediterranean region in Italy and are characterized by having relatively few dominant tree species. Two of the most widespread dominants are Nor-way spruce (Picea abies (L.) Karst.) and beech (Fagus sylva-tica L.). Norway spruce is found throughout the entire 3000-km transect from Scandinavia to Italy. Although beech extends further south than spruce in Italy, it reaches its northern limit in southern Scandinavia where it is replaced by Betula. In addition to short growing seasons, winter cold and summer drought are major stress factors in the north and south, respec-tively, whereas the central part of the transect is exposed to nitrogen (N) and sulfur (S) depositions from air pollution (Hauhs et al. 1989, van Leeuwen et al. 1996).
Because air pollution cannot be excluded from central Europe, we used a 3000-km transect to study the nutrient relations of two major European tree species, thereby over-coming the difficulty of designing an experiment to account for this air pollution (cf. Rasmussen et al. 1993). Our hypothe-sis was that foliar nutrients would be correlated with N depo-sition, and that such relationships would be most prominent on nutrient-poor acidic soils. We found that foliar nutrient con-centrations exhibited large local variation that overrode the geographic patterns at regional and geographic scales. Foliar nutrient contents were closely correlated with nutrient avail-ability and growth.
Nutrient contents and concentrations in relation to growth of
Picea
abies
and
Fagus sylvatica
along a European transect
G. BAUER, E.-D. SCHULZE and M. MUND
Lehrstuhl Pflanzenökologie, University of Bayreuth, 95440 Bayreuth, Germany
Received June 3, 1996
Material and methods
Study sites
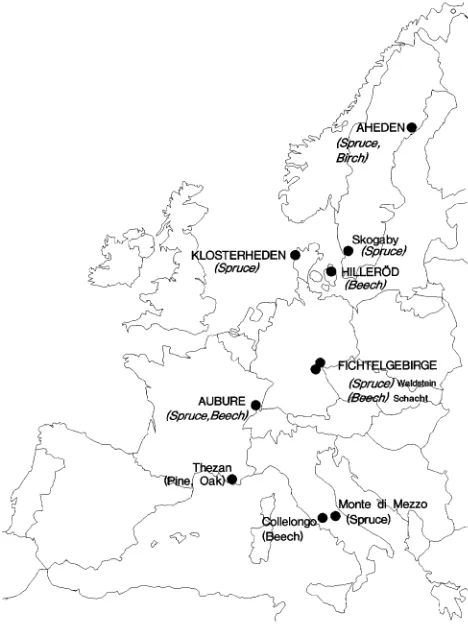
The study was initiated as part of a European research project to examine nitrogen transformations in plants, soils and
micro-organisms at selected European forest sites (see Table 1 and Figure 1). Climatic conditions range from the boreal in north-ern Sweden (Aheden) to oceanic temperate climate in Den-mark (Klosterheden and Hilleröd), and temperate continental climate in northern Bavaria (Waldstein, Schacht) to sub-oce-anic central European climate of the Voges Mountains in
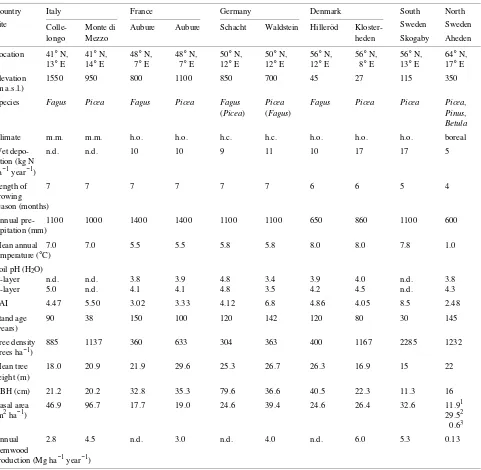
Table 1. Stand characteristics of sites along the European transect. Stemwood productivity data for France, southern Sweden, Denmark and Italy are from Dambrine et al. 1995, Nilsson and Wiklund 1992, B. Andersen (Danish Forest and Landscape Institute, Hoersholm, personal communication), and G. Scarascia-Mugnozza (DISAFRI, University of Tuscia, Viterbo, personal communication), respectively. Data for Germany and northern Sweden were derived from destructive biomass harvests (Mund 1996 and G. Bauer, unpublished data). Soil data are from Matschonat 1995. Abbreviations: Fagus = Fagus sylvatica; Picea = Picea abies; Pinus = Pinus sylvestris L.; Betula = Betula pendula Roth; m.m. = montane mediterranean; h.o. = humid, oceanic; h.c. = humid, continental; n.d. = not determined. Species in brackets occur as concomitant trees in the immediate vicinity of these sites.
Country Italy France Germany Denmark South North Site Colle- Monte di Aubure Aubure Schacht Waldstein Hilleröd Kloster- Sweden Sweden
longo Mezzo heden Skogaby Aheden
Location 41° N, 41° N, 48° N, 48° N, 50° N, 50° N, 56° N, 56° N, 56° N, 64° N, 13° E 14° E 7° E 7° E 12° E 12° E 12° E 8° E 13° E 17° E Elevation 1550 950 800 1100 850 700 45 27 115 350 (m a.s.l.)
Species Fagus Picea Fagus Picea Fagus Picea Fagus Picea Picea Picea, (Picea) (Fagus) Pinus,
Betula
Climate m.m. m.m. h.o. h.o. h.c. h.c. h.o. h.o. h.o. boreal
Wet depo- n.d. n.d. 10 10 9 11 10 17 17 5
sition (kg N ha−1 year−1)
Length of 7 7 7 7 7 7 6 6 5 4
growing season (months)
Annual pre- 1100 1000 1400 1400 1100 1100 650 860 1100 600 cipitation (mm)
Mean annual 7.0 7.0 5.5 5.5 5.8 5.8 8.0 8.0 7.8 1.0 temperature (°C)
Soil pH (H2O)
O-layer n.d. n.d. 3.8 3.9 4.8 3.4 3.9 4.0 n.d. 3.8 A-layer 5.0 n.d. 4.1 4.1 4.8 3.5 4.2 4.5 n.d. 4.3 LAI 4.47 5.50 3.02 3.33 4.12 6.8 4.86 4.05 8.5 2.48 Stand age 90 38 150 100 120 142 120 80 30 145 (years)
Tree density 885 1137 360 633 304 363 400 1167 2285 1232 (trees ha−1)
Mean tree 18.0 20.9 21.9 29.6 25.3 26.7 26.3 16.9 15 22 height (m)
DBH (cm) 21.2 20.2 32.8 35.3 79.6 36.6 40.5 22.3 11.3 16 Basal area 46.9 96.7 17.7 19.0 24.6 39.4 24.6 26.4 32.6 11.91
(m2 ha−1) 29.52
0.63 Annual 2.8 4.5 n.d. 3.0 n.d. 4.0 n.d. 6.0 5.3 0.13 stemwood
production (Mg ha−1 year−1)
France (Aubure), and to Mediterranean winter rains in central Italy (near Rome).
Mean annual temperatures increase from 1 °C in the north to 15 °C in the south, and growing seasons increase from 4 months in the north and 5 months in the south to about 7 months in central Europe. Rainfall reaches a maximum in central Europe and decreases to the north and south. Estimated N depositions (wet deposition) are maximal in central Europe, and thus interact with the more favorable growing climate in this area.
Whenever possible, the study was limited to forests growing on acid soil (except for the central Italy site and for Fagus in Denmark). Soil pH of the A horizon varied between 3.5 and 4.8 (Matschonat 1995). Also, where possible, we selected old stands (generally more than 100 years), because we assumed that they would be in equilibrium with their site conditions.
Picea abies reached a maximum height of almost 30 m in the Voges Mountains in northern France, whereas Fagus sylva-tica reached a maximum height of about 26 m in Denmark. Stand density and basal area showed no systematic variation with latitude, and were mainly determined by silvicultural practices. Tree biomass reached a maximum in northern Bavaria. Generally tree dimensions and biomass were smaller for the same age trees in the south than in the north.
Forest growth (Table 1) was 10 times higher in Germany (Mund 1996) than in northern Sweden with intermediate rates
at the other sites (Aubure: Dambrine et al. 1995; Klosterheden: B. Andersen, personal communication; Italy: G. Scarascia-Mugnozza, personal communication; Skogaby: Nilsson and Wicklund 1992).
Plant collection and analysis
Plant material was collected from the upper third of the crown. At the German site, harvests were made six times during the growing season. At all other sites, plant material was collected once after termination of foliage growth. Samples were washed with deionized water and divided into two equal sub-samples. One subsample was frozen in liquid N2 and stored at
−30 °C for leaf area determination. This material was then dried at 75 °C for 48 h for individual needle or leaf dry weight determination. The other subsample was dried at 75 °C for 48 h, ground in a ball mill and stored in a desiccator for nutrient analysis. Total nitrogen was determined with a C/N analyzer (Model 1500, Carlo ERBA, Italy). Sulfur, P, K, Ca, and Mg were determined after acid digestion (100% HNO3, 6 h
at 170 °C) with an ICP-AES (Model XMP, GBC, Australia). Foliar starch was extracted with 1.1% hydrochloric acid at 100 °C for 30 min according to Oren et al. (1988) and deter-mined colorimetrically by the anthrone reaction (Yemm and Willis 1954, Hansen and Möller 1975).
Results
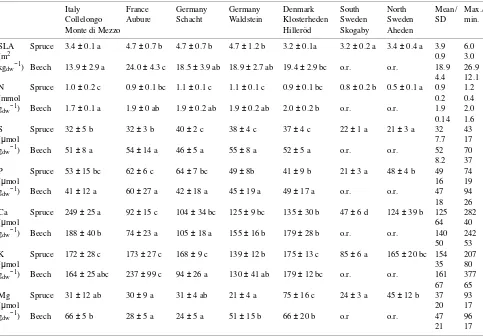
Specific leaf area (SLA, m2 kg−1) of 1-year-old Norway spruce
needles was almost 40% higher in France and Germany than in Italy and Sweden (Table 2). Beech showed a similar trend in SLA between central and southern Europe. Needles and leaves of trees growing under conditions of climatic stress (summer drought, winter cold) were smaller (more scleromorphic) than needles and leaves of trees growing under less stressful condi-tions, indicating that SLA represents a sensitive measure of growing conditions (Luxmoore et al. 1995, Pereira 1995). Despite the large changes in SLA along the transect, N concen-trations showed no significant difference between Italy and southern Sweden in either species, although highest N concen-trations were recorded in Germany. Nitrogen concenconcen-trations of Norway spruce in northern Sweden were about 50% lower than at the other sites.
In Norway spruce needles, S concentrations showed a simi-lar geographic pattern to the N concentrations, but with signifi-cantly higher values in Germany and Denmark than in northern and southern Europe. Sulfur concentrations were generally higher in beech than in Norway spruce, as a result of the difference in SLA between the two species (Table 2). Phospho-rus concentrations were variable, reflecting local conditions. Foliar Mg concentration changed inversely with foliar N con-centration (as observed by Oren et al. (1988) for the sites in Germany), except in Denmark, where the Norway spruce site received Mg inputs from the ocean.
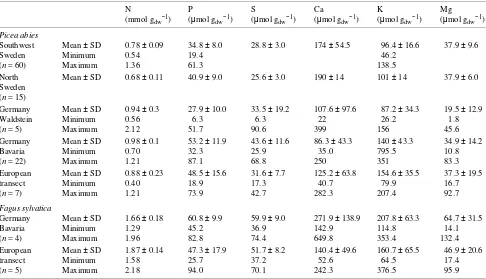
Regional and local variations in foliar element concentra-tions for Germany and Sweden were of the same order of magnitude as the variation along the entire European transect (Table 3). At the Waldstein site, stands of different ages
ing within an area of 1 km2 showed a variation in N
tions equalling that of the regional variation in N concentra-tions of Norway spruce growing on different substrates across Bavaria (Rehfuess and Rodenkirchen 1984, Kaupenjohann et al. 1989). Furthermore, the local variation in foliar N concen-trations was larger than the changes in foliar N concenconcen-trations along the transect. Similarly in southern Sweden (Ericsson et al. 1993, 1995), the local variation in N concentration was similar to that along the European transect. Although Norway spruce needles at the northern Swedish site had lower N con-centrations than at other sites, they showed a local variation that was comparable to the variation along the transect.
Sulfur concentrations at sites in Germany showed larger regional variation than S concentrations along the transect; however, the variation in S concentration was smaller at other European sites. Local variation in P, Ca, K, and Mg was also larger than the continental variation in these elements.
Changes in foliar nutrient contents and concentrations have been used to draw conclusions about nutrient supply and demand at the whole-plant level (e.g., Chapin and Kedrowski 1983, Fife and Nambiar 1984, Aerts 1996). For both Norway spruce and beech, we found that the concurrent changes in foliage area and dry weight and in soluble carbohydrates were
also important indicators of N supply and demand (Figures 2 and 3). In Norway spruce, the initial phase of needle growth (Figure 2) was characterized by rapid increases in needle area (LA) and N content (Nc) and a rapid decrease in N
concentra-tion. Nitrogen content reached 50% of the autumn maximum 2 to 3 weeks after bud break when leaves had reached 80% of their maximum area. Following this initial burst of growth, needle dry weight and N content increased steadily, whereas N concentration continued to decrease. By mid-July, 8 weeks after bud break, needles had reached maturity (Lange and Schulze 1966). Nevertheless, N content continued to increase and was accompanied by a parallel increase in needle dry weight, and, as a result, N concentration remained constant.
There was no decrease in N content or N concentration in current-year needles of Norway spruce, as has been observed in other tree species (Fife and Nambiar 1984). The main demand for N occurred during bud break of the following year, when 1-year-old needles exhibited a sharp decrease in N con-tent that was associated with a minor decrease in N concentra-tion. About 1.7 µmol N needle−1 was exported from 1-year-old
needles, and about 1 µmol N needle−1 was exported from
2-year-old needles at the time of new needle growth. Following the period of N reallocation in spring, 1-year-old needles
Table 2. Specific leaf area (SLA) and element concentrations (N, S, P, Ca, K, and Mg) (amount per unit dry weight) of 1-year-old needles of Picea abies (spruce) and leaves of Fagus sylvatica (beech) along the European transect. Values are means (n = 4) and standard deviations. Values in the same column followed by different letters are statistically different (P < 0.05); o.r. = outside the range of distribution for Fagus.
Italy France Germany Germany Denmark South North Mean/ Max./ Collelongo Aubure Schacht Waldstein Klosterheden Sweden Sweden SD min. Monte di Mezzo Hilleröd Skogaby Aheden
SLA Spruce 3.4 ± 0.1 a 4.7 ± 0.7 b 4.7 ± 0.7 b 4.7 ± 1.2 b 3.2 ± 0.1a 3.2 ± 0.2 a 3.4 ± 0.4 a 3.9 6.0
(m2 0.9 3.0
kgdw−1) Beech 13.9 ± 2.9 a 24.0 ± 4.3 c 18.5 ± 3.9 ab 18.9 ± 2.7 ab 19.4 ± 2.9 bc o.r. o.r. 18.9 26.9
4.4 12.1 N Spruce 1.0 ± 0.2 c 0.9 ± 0.1 bc 1.1 ± 0.1 c 1.1 ± 0.1 c 0.9 ± 0.1 bc 0.8 ± 0.2 b 0.5 ± 0.1 a 0.9 1.2
(mmol 0.2 0.4
gdw−1) Beech 1.7 ± 0.1 a 1.9 ± 0 ab 1.9 ± 0.2 ab 1.9 ± 0.2 ab 2.0 ± 0.2 b o.r. o.r. 1.9 2.0
0.14 1.6 S Spruce 32 ± 5 b 32 ± 3 b 40 ± 2 c 38 ± 4 c 37 ± 4 c 22 ± 1 a 21 ± 3 a 32 43
(µmol 7.7 17
gdw−1) Beech 51 ± 8 a 54 ± 14 a 46 ± 5 a 55 ± 8 a 52 ± 5 a o.r. o.r. 52 70
8.2 37 P Spruce 53 ± 15 bc 62 ± 6 c 64 ± 7 bc 49 ± 8b 41 ± 9 b 21 ± 3 a 48 ± 4 b 49 74
(µmol 16 19
gdw−1) Beech 41 ± 12 a 60 ± 27 a 42 ± 18 a 45 ± 19 a 49 ± 17 a o.r. o.r. 47 94
18 26 Ca Spruce 249 ± 25 a 92 ± 15 c 104 ± 34 bc 125 ± 9 bc 135 ± 30 b 47 ± 6 d 124 ± 39 b 125 282
(µmol 64 40
gdw−1) Beech 188 ± 40 b 74 ± 23 a 105 ± 18 a 155 ± 16 b 179 ± 28 b o.r. o.r. 140 242
50 53 K Spruce 172 ± 28 c 173 ± 27 c 168 ± 9 c 139 ± 12 b 175 ± 13 c 85 ± 6 a 165 ± 20 bc 154 207
(µmol 35 80
gdw−1) Beech 164 ± 25 abc 237 ± 99 c 94 ± 26 a 130 ± 41 ab 179 ± 12 bc o.r. o.r. 161 377
67 65 Mg Spruce 31 ± 12 ab 30 ± 9 a 31 ± 4 ab 21 ± 4 a 75 ± 16 c 24 ± 3 a 45 ± 12 b 37 93
(µmol 20 17
gdw−1) Beech 66 ± 5 b 28 ± 5 a 24 ± 5 a 51 ± 15 b 66 ± 20 b o.r o.r. 47 96
Table 3. Continental, regional and local means, standard deviations and maximum and minimum observations of element concentrations (amount per unit dry weight) for the German site Waldstein, for Bavaria, and for southern and northern Sweden for Picea abies and Fagus sylvatica. The regional data for Sweden were recalculated from Ericsson et al. (1993, 1995). The data for Bavaria do not include the sites at ‘Schacht’ and ‘Waldstein’ and are taken from Kaupenjohann et al. (1989) and Rehfuess and Rodenkirchen (1984).
N P S Ca K Mg
(mmol gdw−1) (µmol gdw−1) (µmol gdw−1) (µmol gdw−1) (µmol gdw−1) (µmol gdw−1)
Picea abies
Southwest Mean ± SD 0.78 ± 0.09 34.8 ± 8.0 28.8 ± 3.0 174 ± 54.5 96.4 ± 16.6 37.9 ± 9.6
Sweden Minimum 0.54 19.4 46.2
(n = 60) Maximum 1.36 61.3 138.5
North Mean ± SD 0.68 ± 0.11 40.9 ± 9.0 25.6 ± 3.0 190 ± 14 101 ± 14 37.9 ± 6.0 Sweden
(n = 15)
Germany Mean ± SD 0.94 ± 0.3 27.9 ± 10.0 33.5 ± 19.2 107.6 ± 97.6 87.2 ± 34.3 19.5 ± 12.9 Waldstein Minimum 0.56 6.3 6.3 22 26.2 1.8 (n = 5) Maximum 2.12 51.7 90.6 399 156 45.6 Germany Mean ± SD 0.98 ± 0.1 53.2 ± 11.9 43.6 ± 11.6 86.3 ± 43.3 140 ± 43.3 34.9 ± 14.2 Bavaria Minimum 0.70 32.3 25.9 35.0 795.5 10.8 (n = 22) Maximum 1.21 87.1 68.8 250 351 83.3 European Mean ± SD 0.88 ± 0.23 48.5 ± 15.6 31.6 ± 7.7 125.2 ± 63.8 154.6 ± 35.5 37.3 ± 19.5 transect Minimum 0.40 18.9 17.3 40.7 79.9 16.7 (n = 7) Maximum 1.21 73.9 42.7 282.3 207.4 92.7
Fagus sylvatica
Germany Mean ± SD 1.66 ± 0.18 60.8 ± 9.9 59.9 ± 9.0 271.9 ± 138.9 207.8 ± 63.3 64.7 ± 31.5 Bavaria Minimum 1.29 45.2 36.9 142.9 114.8 14.1 (n = 4) Maximum 1.96 82.8 74.4 649.8 353.4 132.4 European Mean ± SD 1.87 ± 0.14 47.3 ± 17.9 51.7 ± 8.2 140.4 ± 49.6 160.7 ± 65.5 46.9 ± 20.6 transect Minimum 1.58 25.7 37.2 52.6 64.5 17.4 (n = 5) Maximum 2.18 94.0 70.1 242.3 376.5 95.9
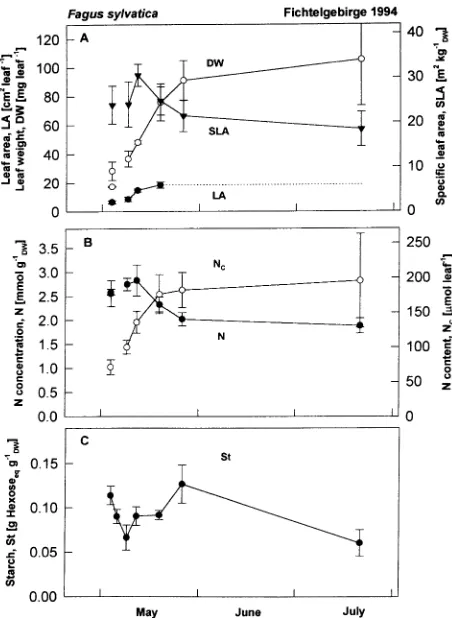
Figure 2. Seasonal course of (A) needle dry weight (DW) (d) and needle area (LA) (s); (B) nitrogen concentration (N) (d) and nitrogen content (Nc) (s); and (C) starch concentration for current-year and 1-year-old needles of Picea abies sampled in 1994 at the Waldstein site in northeast
reached an N content comparable to that present at the time of early needle maturity (mid-July of the previous year), and they reached this value again after bud break in the following
season. We conclude that this N content (about 3 µmol N needle−1, dashed line in Figure 2B) provides an indication of the amount of N necessary to maintain biochemical function-ing of the needle. At the time of bud break, when N demand exceeded supply and N content of old needles decreased, we observed an increase in starch content (Figure 2C). The capac-ity to supply N from old needles in a reversible manner de-creased with needle age. In needles that were > 2 years old, the decrease in dry weight and N content showed no seasonal pattern, and about 1 mmol needle−1 of N was reallocated as needles aged from 2 to 5 years. Nitrogen concentration de-creased only in needles > 4 years old.
A similar pattern of leaf development was observed in beech as in Norway spruce (Figure 3), although leaf area developed faster than in Norway spruce. Nitrogen content paralleled the increase in dry weight during the spring and remained constant throughout the summer. Nitrogen concentration decreased in the later stages of development as a result of a decrease in SLA. Because N content appears to be a more sensitive indicator of N dynamics in these trees than N concentration, a summary of nitrogen contents of needles and leaves as they were ob-served in autumn along the European transect is presented in Table 4. Nitrogen content showed more variation than N con-centration along the transect, reaching highest values in Den-mark, and decreasing to the north and the south. Sulfur content showed a similar geographic pattern to N content with highest values in Denmark. Magnesium content changed inversely to N and S contents, except for the coastal site in Denmark. Phosphorus, Ca, and K contents reflected local supply.
To study C/N interactions in Norway spruce, we plotted dry weight against nutrient content per needle (Figure 4). Dry weight per needle increased linearly with N content with a slope of 0.9 for all sites, except for Sweden where higher dry weights per needle were reached at the same N content, and in Germany where needles had slightly higher N contents at the same dry weight than elsewhere along the transect. The
excep-Figure 3. Seasonal course of (A) leaf dry weight (DW) (s), leaf area (LA) (d), and specific leaf area (SLA) (.); (B) nitrogen concentration (N) (d) and nitrogen content (Nc) (s); and (C) starch concentration for leaves of Fagus sylvatica sampled in 1994 at the Schacht site in northeast Bavaria, Germany.
Table 4. Needle and leaf weights and element contents per needle and leaf, respectively, for Picea abies (spruce) and Fagus sylvatica (beech) along the European transect. Values are means (n = 4) and standard deviations. Values in the same column followed by different letters are statistically different (P < 0.05); o.r. = outside the range of distribution for Fagus.; and n.d. = not determined.
Italy France Germany Germany Denmark South North Collelongo Aubure Schacht Waldstein Klosterheden Sweden Sweden Monte di Mezzo Hilleröd Skogaby Aheden Leaf wt. Spruce 3.8 ± 1.0 ab 3.1 ± 0.4 a 3.7 ± 1.0 ab 4.4 ± 1.5 abc 5.8 ± 0.9 c 5.8 ± 0.9 c 4.7 ± 1.0 bc (mg leaf−1) Beech 95 ± 13 a 113 ± 24 cd 76 ± 13 b 40 ± 5.0 c 123 ± 16 d o.r. o.r. N (µmol Spruce 3.9 ± 1.4 abc 2.8 ± 0.6 ab 4.2 ± 1.4 abc 4.5 ± 1.2 bc 5.0 ± 0.8 c 4.6 ± 1.7 bc 2.4 ± 0.5 a leaf−1) Beech 165 ± 27 a 216 ± 45 a 142 ± 26 a 74 ± 4.2 b 242 ± 34 a o.r. o.r. P (µmol Spruce 0.22 ± 0.13 a 0.19 ± 0.03 a 0.24 ± 0.04 a 0.21 ± 0.07 a 0.24 ± 0.05 a 0.12 ± 0.02 a 0.23 ± 0.07 a leaf−1) Beech 3.9 ± 1.2 b 6.5 ± 2.3 c 3.2 ± 1.6 ab 1.8 ± 0.9 a 5.3 ± 1.5 bc o.r. o.r. S (µmol Spruce 0.12 ± 0.04 ab 0.10 ± 0.02 a 0.15 ± 0.05 b 0.16 ± 0.05 bc 0.21 ± 0.03 c 0.13 ± 0.02 ab 0.10 ± 0.02 a leaf−1) Beech 4.8 ± 0.09 a 5.3 ± 0.8 a 3.5 ± 0.7 b 2.2 ± 0.2 c 6.4 ± 0.8 a o.r. o.r.
Ca (µmol Spruce 0.97 ± 0.3 c 0.28 ± 0.01 a 0.39 ± 0.2 a 0.54 ± 0.2 ab 0.79 ± 0.3 bc 0.27 ± 0.05 a 0.56 ± 0.14 ab leaf−1) Beech 17.6 ± 2 b 8.2 ± 2 a 7.8 ± 1 a 6.1 ± 0.6 a 22.2 ± 6 b o.r. o.r.
K (µmol Spruce 0.69 ± 0.3 a 0.54 ± 0.15 a 0.64 ± 0.21 a 0.62 ± 0.25 a 1.0 ± 0.19 b 0.49 ± 0.07 a 0.77 ± 0.18 ab leaf−1) Beech 15 ± 2.4 b 26 ± 7.6 c 7 ± 1.9 a 5 ± 1.1 a 22 ± 3.2 c o.r. o.r.
tions in north Sweden and Germany may be partly a result of the measurement technique, i.e., the data in Figure 4 are end points of a seasonal dynamic process of C and N relations. For example, the fine solid lines in Figure 4 demonstrate the seasonal progression of dry weight and N content at the Ger-man site in the first year of needle development. Nitrogen content initially increased more than dry weight and this was followed by a period when dry weight increased more than N content. Finally, N content changed more than dry weight. However, during this final period when needles are fully devel-oped, an increase in dry weight at constant N content would be expected under conditions of N limitation. This situation ap-pears to have occurred in northern Sweden; i.e., dry weight increased without a proportional change in N content because of a low N supply, resulting in low foliar N concentrations. In contrast, the German and Danish sites showed a slightly higher
N content for the same leaf dry weight than the other sites, indicating accumulation of excess N.
Sulfur content was positively correlated with needle dry weight, but S accumulation (higher S content at the same dry weight compared with other sites) occurred in Germany and Denmark, whereas the reverse relationship occurred at the Swedish sites (more dry weight per S content than at other sites along the transect), perhaps indicating that the Swedish sites were S deficient. The relationship between needle dry weight and P content was similar for all sites, except for southern Sweden, where needles had higher dry weights at the same P content than at the other sites. Calcium accumulated in needles of trees growing on calcareous soils in Italy, and Ca content of needles was lower in southern Sweden than at the other sites. Foliar K content closely reflected local soil conditions, except in southern Sweden where the soils appeared to have a low K content. Foliar Mg content showed a more complicated rela-tionship with foliar dry weight than the other elements studied. Magnesium accumulated in foliage of trees growing close to
Figure 4. Dry weight (mg needle−1) versus N, S, P, Mg, Ca, and K contents (µmol needle−1) in Picea abies. The dotted lines represent the correlation between the two parameters for mature needles. Data points above the line indicate accumulation of C, whereas data points below the line indicate accumulation of the element. The solid line indicates the change in needle dry weight and element content during development of current-year needles at the Waldstein site. Data points represent measurements of individual trees (n = 4 per site) at seven locations along the European transect (I: Italy, F: France, GW:
Ger-many Waldstein site, GS: Germany Schacht site; DK: Denmark,
SS: southern Sweden, SN: northern Sweden).
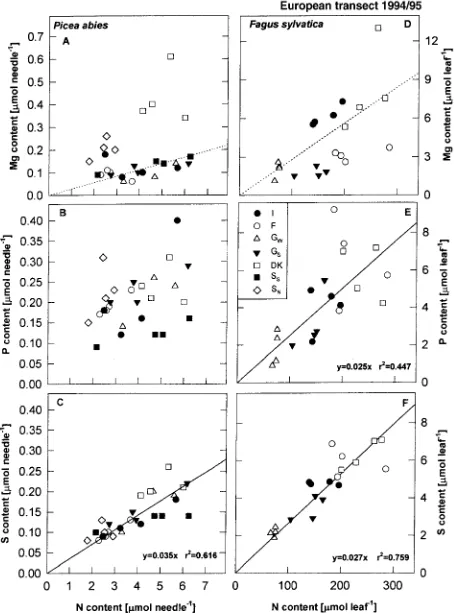
Figure 5. Magnesium (A,D), P (B,E), and S (C,F) contents versus N content for 1-year-old needles of Picea abies (left panel) and leaves of
Fagus sylvatica (right panel). Solid lines in C, E, F represent regres-sions for P and S contents, whereas the dotted lines in A and D represent the deficiency threshhold for Mg/N (28 µmol Mg mmol−1 N) as defined by Ingestad (1959). Data points represent
meas-urements of individual trees (n = 4 per site) at seven locations along the European transect (I: Italy, F: France, GW: Germany Waldstein site, GS:
Germany Schacht site; DK: Denmark, SS: southern Sweden, SN:
the sea in Denmark, but soils contained below-average amounts of Mg in Germany and southern Sweden.
To investigate possible element limitations, we analyzed the element ratios for P, S, and Mg versus N (Figure 5). In both Norway spruce and beech leaves, S content was closely related to N content (Figures 5C and 5F), whereas the relationship was less close for P. The scatter was even larger for the Mg/N ratio. Needles of trees at the sites in northern Sweden and Denmark had high Mg/N ratios, whereas needles of trees at the central European sites had Mg/N ratios that were at or below the value at which yellowing symptoms occur, indicated by the dotted lines in Figures 5A and 5D (Oren et al. 1988). Needles of trees growing at central European sites had Mg/N ratios of 28, which is the threshold below which needle chlorosis occurs (Ingestad 1959).
Discussion
Elemental concentrations have often been used to describe the nutritional status and nutrient requirements of plants (Ingestad 1979, Marschner 1986). However, there is clear evidence that nutrient concentrations do not fully characterize plant nutrient turnover (Timmer and Armstrong 1987, Nambiar and Fife 1991, Haase and Rose 1995, Millard 1996), indicating that analysis of concentrations alone is of limited value. We found that nutrient concentrations based on total dry weight showed little variation between central Italy and southern Sweden. This observation confirms the findings of the north and central European survey of Cape et al. (1990), who detected only minor differences in nutrient concentrations except in the heavily polluted areas that were also included in our study.
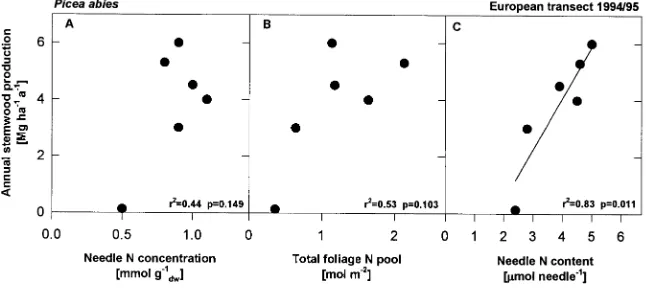
In contrast to the constancy of N concentrations, we ob-served significant changes in nutrient contents and leaf dry weights along the European transect. For Norway spruce, the relationship between nutrient content and dry weight indicates that acquired N was immediately used for growth. We used stand growth data collected by other research teams at the same sites (Nilsson and Wicklund 1992, Dambrine et al. 1995, Mund 1996, B. Andersen and G. Scarascia-Mugnozza, personal com-munication) to relate various growth parameters to N nutrition. At the stand level, we found no significant relationship (r2 = 0.44, P = 0.149) between N concentration and growth
(Fig-ure 6A). In addition, the total amount of N in the foliage at the stand level (mol N ha−1) was not significantly correlated with wood growth (Figure 6B, r2 = 0.53, P = 0.103), probably
because sun and shade parts of the crown contribute at different rates to the overall C assimilation (Schulze et al. 1977). How-ever, a significant relationship was observed between N con-tent of 1-year-old needles and annual stemwood production (Figure 6C, r2 = 0.85, P = 0.026).
Despite the close relationship between needle N content and growth along the European transect, which may be associated with a limited availability of soil N, we found an accumulation of N in needles at the time of major stem growth in Germany. This accumulation was associated with an increase in needle weight. Although an investigation of pools does not allow an insight into N fluxes, we postulate that the increase in N content in needles in Germany indicates that the needles as-similated N from air pollution (NOx and NH3). It could be that
stem growth is supported by N uptake from roots, whereas C assimilation and the carbon supply for stem growth is deter-mined by needle size, which relates to the supply of organic N being assimilated in needles, in part from air pollution, and to the capacity for N reallocation during needle growth. Nitrogen shortage occurred at the time of bud break, when soils were still cold, roots were not fully developed and uptake of N from soils was not at its seasonal maximum (Oren et al. 1988). During this period, old needles exhibited decreased N contents and starch increased, indicating a change in the C/N balance. The N content recovered during the next growing season when supply exceeded demand again.
We hypothesize that a needle or a leaf contains a threshold content of N that assures the functioning of the biochemical processes such as photosynthetic CO2 assimilation. This
threshold N content relates to a certain N concentration, which directly affects photosynthetic capacity per needle area (Field and Mooney 1986, Evans 1989). However, the actual rate of carbon assimilation per needle strongly depends on needle size, and because needle development and needle size strongly depend on N reallocation from existing needles, this process apparently determines the capacity of the needle to assimilate carbon dioxide in the next season. Following reallocation, needle N content and dry weight increase again toward the end of the growing season and this accumulated N serves in turn
Figure 6. Annual stemwood production of
Picea abies versus (A) needle N concentra-tion (mmol N g−1), (B) total foliage N pool
for growth of the next needle generation. During the growing season, wood formation follows needle growth. The sink activ-ity of stem wood formation is initially dependent on N supply, even though wood has a high C/N ratio. Thus, wood growth acts as a strong sink for C in summer if N is not limiting. As a result, SLA of needles remains high throughout the season in central Europe (no C accumulation). In contrast, if N is in short supply (e.g., northern Sweden) the sink activity of wood growth remains low, and ongoing photosynthesis leads to ex-cess photosynthates and to further increases in needle dry weight (SLA decreases to a lower area per dry weight). The relationship between N concentration and plant growth may be different for tree seedlings and herbaceous plants (Ingestad 1979, Fichtner 1991, Lauerer 1995), because leaves of herba-ceous plants have a major storage function and control demand and supply, and they are also the main compartment for growth. Because of the different C/N ratios in wood and leaves, stems of adult woody species act as strong carbon sinks and do not compete for N in leaves as much as stems of herbaceous species.
We conclude that element concentrations of woody species can only be interpreted in the context of C and N interactions at the whole-plant level by considering differences in C/N ratios of the different products. Wood growth is significantly related to foliar N content and the associated needle dry weight rather than to foliar N concentrations in Norway spruce, be-cause needle size determines the extent of carbon assimilation.
Acknowledgments
This study is part of the EC project European (Nitrogen Physiology of Forest Plants and Soils; No. EV5V-CT92-0143). We thank all of the scientists involved in this project for providing us with plant material. The critical reading of the manuscript by F. Bazzaz and A.F.S. Taylor is very much appreciated.
References
Aerts, R. 1996. Nutrient resorption from senescing leaves of perenni-als: Are there general patterns? J. Ecol. 84:597--608.
Cape, J.N., P.H. Freer-Smith, I.S. Paterson, J.A. Parkinson, J. Wolfen-den. 1990. The nutritional status of Picea abies (L.) Karst. across Europe, and implications for forest decline. Trees 4:211--224. Chapin, F.S., III and R.A. Kedrowski. 1983. Seasonal changes in
nitrogen and phosphorous fractions and autumn retranslocation in evergreen and deciduous taiga trees. Ecology 64:376--391. Dambrine, E., M. Bonneau, J. Ranger, A.D. Mohamed, C. Nys and
F. Gras. 1995. Cycling and budgets of acidity and nutrients in Norway spruce stands in northeastern France and the Erzgebirge (Czech Republic). In Forest Decline and Atmospheric Deposition Effects in the French Mountains. Eds. G. Landmann and M. Bon-neau. Springer-Verlag, Berlin, pp 233--255.
Ericsson, A., L.-G. Norden, T. Näsholm and M. Walheim. 1993. Mineral nutrient imbalances and arginine concentrations in needles of Picea abies (L.) Karst. from two areas with different levels of airborne deposition. Trees 8:67--74.
Ericsson, A., M. Walheim, L.-G. Norden and T. Näsholm. 1995. Concentrations of mineral nutrients and arginine in needles of Picea abies trees from different areas in southern Sweden in relation to nitrogen deposition and humus form. Ecol. Bull. 44:147--157.
Evans, J.R. 1989. Photosynthesis and nitrogen relationships in leaves of C3 plants. Oecologia 78:9--19.
Fichtner, K. 1991. Der Einfluß des Stickstoffangebots auf das Wachstum unterschiedlich nitrophiler annueller Pflanzen und die Wechselwirkung zwischen Stickstoffhaushalt und Photosynthese bei Phaseolus lunatus und transgenem Nicotiana tabacum. Thesis, University Bayreuth, Bayreuth, Germany, 92 p.
Field, C. and H.A. Mooney. 1986. The photosynthesis--nitrogen rela-tionship in wild plants. In On the Economy of Plant Form and Function. Ed. T.J. Givinish. Cambridge University Press, Cam-bridge, U.K., pp 25--55.
Fife, D.N. and E.K.S. Nambiar. 1984. Movement of nutrients in radiata pine needles in relation to the growth of shoots. Ann. Bot. 54:303--314.
Haase, D.L. and R. Rose. 1995. Vector analysis and its use for inter-preting plant nutrient shifts in response to silvicultural treatments. For. Sci. 41:54--66.
Hansen, J. and I. Möller. 1975. Percolation of starch and soluble carbohydrates from plant tissue for quantitative determination with anthrone. Anal. Biochem. 68:87--94.
Hauhs, M., K. Rost-Siebert, G. Raben, T. Paces and B. Vigerust. 1989. Summary of European data. In The Role of Nitrogen in the Acidi-fication of Soils and Surface Waters. Eds. J.L. Malanchuk and J. Nilsson. Nordic Council of Ministers, Copenhagen, pp (5)1--(5)37.
Ingestad, T. 1959. Studies on the nutrition of forest tree seedlings. II. Mineral nutrition of Norway spruce. Physiol. Plant. 12:568--593. Ingestad, T. 1979. Mineral nutrient requirements of Pinus sylvestris
and Picea abies seedlings. Physiol. Plant. 45:373--380.
Kaupenjohann, M., W. Zech, R. Hantschel, R. Horn and B.U. Schneider. 1989. Mineral nutrition of forest trees: A regional sur-vey. In Air Pollution and Forest Decline. A Case Study with Spruce (Picea abies) on Acid Soils. Eds. E.-D. Schulze, O.L. Lange and R. Oren. Ecological Studies 77, Springer-Verlag, Berlin, pp 282--296. Lange, O.L. and E.-D. Schulze. 1966. Untersuchungen über die Dick-enentwicklung der kutikularen Zellwandschichten bei der Fichten-nadel. Forstwiss. Centralbl. 85:27--38.
Lauerer, M. 1995. Wachstum, Kohlenstoff- und Stickstoffhaushalt von
Nicotiana tabacum mit reduzierter Nitratreduktaseaktivität. Thesis, University Bayreuth, Bayreuth, Germany, 179 p.
Luxmoore, R.J., R. Oren, D.W. Sheriff and R.B. Thomas. 1995. Source--sink-storage relationships of conifers. In Resource Physiol-ogy of Conifers. Eds. W.K. Smith and T.M. Hinckley. Academic Press, London, pp 179--216.
Marschner, H. 1986. Mineral nutrition of higher plants. Academic Press, London, 889 p.
Matschonat, G. 1995. Zur NH4+-Sorption und NH4+-Fixierung in
europäischen Waldböden. Thesis, University of Bayreuth, Bay-reuther Forum Ökologie, Bayreuth, Germany, Vol. 24., 139 p. In German.
Millard, P. 1996. Ecophysiology of the internal cycling of nitrogen for tree growth. Z. Pflazenernähr. Bodenk. 159:1--10.
Mund, M. 1996. Wachstum und oberirdische Biomasse von Fichten-beständen (Picea abies (L.) Karst.) in einer Periode anthropogener Stickstoffeinträge. Diplom Thesis, University of Bayreuth, Bayreuth, Germany, 106 p.
Nambiar, E.K.S. and D.N. Fife. 1991. Nutrient retranslocation in temperate conifers. Tree Physiol. 9:185--207.
Oren, R., K.S. Werk, E.-D. Schulze, J. Meyer, B.U. Schneider and P. Schramel. 1988. Performance of two Picea abies (L.) Karst. stands at different stages of decline. VI. Nutrient concentration. Oecologia 77:151--162.
Pereira, J.S. 1995. Gas exchange and growth. In Ecophysiology of Photosynthesis. Eds. E.-D. Schulze and M. M. Caldwell. Ecological Studies 100, Springer-Verlag, Berlin, pp 147--175.
Rasmussen, L., T. Brydges and P. Mathy. 1993. Experimental ma-nipulations of biota and biogeochemical cycling in ecosystems. Ecosystem Research Reports 5, Commission of the European Com-munities, Brussels, 348 p.
Rehfuess, K.E. and H. Rodenkirchen. 1984. Über die Nadelröte der Fichte (Picea abies Karst.) in Süddeutschland. Forstwiss. Centralbl. 103:245--262.
Schulze, E.-D., M. Fuchs and M.I. Fuchs. 1977. Spacial distribution of photosynthetic capacity and performance in a mountain spruce forest of northern Germany. III. The significance of the evergreen habitat. Oecologia 30:239--248.
Timmer, V.R. and G. Armstrong. 1987. Diagnosing nutritional status of containerized tree seedlings: Comparative plant analysis. Soil Sci. Soc. Am. J. 51:1082--1086.
van Leeuwen, E.P., G.P.J. Draaijers and J.W. Erisman. 1996. Mapping wet depositon of acidifying components and base cations over Europe using measurements. Atmos. Environ. 30:2495--2511. Yemm, E.W. and A.J. Willis. 1954. The estimation of carbohydrates in