Summary A simple model that describes growth in terms of physical and physiological processes is needed to predict growth rates and hence the productivity of trees at particular sites. The linear relationship expected between absorbed pho-tosynthetically active radiation (ϕpa, MJ m−2) and dry mass production (G(t)); i.e., G(t) = εϕpa, where ε is the radiation utilization coefficient, was fitted to three years’ data from five Western Australian Eucalyptus globulus Labill. plantations for which monthly growth measurements, leaf area indices, weather data and soil water measurements were available. Reductions in growth efficiency relative to absorbed photosyn-thetically active radiation were associated with high vapor pressure deficits (D, kPa) so the relationship between monthly aboveground biomass increments and D was used to calculate utilizable ϕpa. Plotting cumulative aboveground growth against utilizable ϕpa gave strong linear relationships with slope ε. Values of ε ranged from 0.93 to 2.23 g dry mass MJ−1ϕpa. The variation could not be explained either in terms of soil water content in the root zones, because all plantations appeared to have access to groundwater, or in terms of soil chemistry. A value of ε≈ 2.2 is considered near the maximum likely to be applicable to Eucalyptus plantations. An interesting peripheral finding was a strong relationship between allometric ratios and soil phosphorus; this, if confirmed elsewhere, will be of con-siderable value in converting biomass increments to wood production. There was also a strong negative relationship be-tween the average ratio of leaf/total aboveground biomass and soil nitrogen content.
Keywords: growth, productivity, radiation utilization effi-ciency, sustainable yield.
Introduction
Prediction of growth rates and hence of tree productivity at any site is one of the central problems for forest managers, whether they are concerned with plantations or the assessment of sus-tainable yields from natural forests. The solution to the prob-lem has always been the use of conventional mensuration models derived from measurements of trees in the field and statistical descriptions of their size distributions and changes
in size over time. The problem with these models is that they are completely empirical and site specific: they are essentially descriptions of tree growth on particular sites subjected to a particular range of weather conditions and management re-gimes; they cannot be used to evaluate the consequences of different conditions or to estimate the likely productivity of trees at sites where they do not grow, or have not been meas-ured. To overcome these limitations we must develop models that describe tree growth in terms of the physical environment and physiological processes that govern growth.
Several such models have been developed in recent years (see, for example, Running and Coughlan 1988, McMurtrie et al. 1990, Wang and Jarvis 1990, Running and Gower 1991), reflecting our improved knowledge of tree physiology and ability to describe processes and interactions quantitatively. However, these models are essentially research tools; they require too many parameter values and weather data to be of much value for forest management or for the wide-scale esti-mation of forest CO2 uptake and growth using, as input data, information obtained by remote sensing. There is, therefore, a need for a simple model, with few parameters, preferably with robust, conservative values, that can be used by management or easily applied to large areas. Such a model exists in the form of a linear relationship between the radiant energy absorbed by tree canopies and their rate of biomass production.
The change in rate of photosynthesis by a single leaf with increasing photon flux density (PFD) is non-linear, but if a canopy is closed, so that the foliage intercepts all, or most, of the incident radiation, and much of the foliage is not PFD-satu-rated, photosynthesis by the canopy as a whole is likely to be PFD-limited and the relationship between intercepted energy and net photosynthesis by the canopy tends toward linearity. This tendency is strengthened if a high proportion of incoming radiation is diffuse. Non-linearities are also likely to be less apparent over long periods (e.g., weeks, seasons) (Wang et al. 1992). The simple model may therefore be written
G(t)=ε
∑
ϕpa, (1)Evaluating a simple radiation/dry matter conversion model using data
from
Eucalyptus globulus
plantations in Western Australia
J. J. LANDSBERG
1,3and F. J. HINGSTON
21
CSIRO Centre for Environmental Mechanics, Canberra, ACT 2601, Australia 2 CSIRO Divsion of Forestry, Wembley, WA 6014, Australia
3
Author to whom correspondence should be addressed
Received February 13, 1996
where G denotes net primary dry mass production, ε is the radiation utilization efficiency coefficient and ϕpa denotes ab-sorbed photosynthetically active radiation summed over some time interval which, in the case of forests, is not likely to be shorter than a month.
This relationship was first clearly identified by Monteith (1977) for crops and orchards. Jarvis and Leverenz (1983) demonstrated that it could be applied to forests, and Linder (1985) provided the first empirical ε-values for forests. Landsberg et al. (1996) have provided a review of the basis for Equation 1, its implications and the range of values obtained for ε in various studies. Unfortunately, the values of ε obtained for trees are highly variable and the literature is likely to cause confusion because ε-values have been expressed in terms of photosynthetically active radiation (ϕp), total solar radiation (ϕs) and both aboveground (Gb) and total dry mass production (Gt). Because ϕp is approximately 0.5ϕs, values of ε obtained in terms of absorbed solar radiation (ϕsa) will be about half those obtained using ϕpa. Values for aboveground production, in terms of ϕsa, range from ε =1.4 g dry mass MJ−1 for Salix and Populus (Cannell et al. 1987, Cannell et al. 1988) to 0.43 g MJ−1 for several Eucalyptus species, including E. globulus Labill. (Beadle and Inions 1990). Linder (1985) calculated ε = 0.9 g MJ−1ϕpa for young E. globulusstands in Australia and 1.7 g MJ−1ϕpa for aboveground production by forest stands in Australia, New Zealand and Europe. Saldar-riaga and Luxmoore (1991) obtained ε = 0.2 g MJ−1ϕpa for tropical rain forest stands at 23 sites in Colombia and Vene-zuela. (All analyses in this paper are in terms of ϕpa.)
Landsberg (1986) suggested that Equation 1 could be writ-ten in the form
G(t)=ε
∑
ϕpafθfDfT, (2)where the modifying factors fi describe the effects of soil water shortage (fθ), vapor pressure deficit acting on stomata (fD), and temperature (fT). The modifiers would be non-dimensional, with values between zero (no growth) and unity (no environ-mental constraints). They apply to the absorbed energy, modi-fying its effectiveness for growth. This approach was used by Runyon et al. (1994) who applied modifiers based on environ-mental constraints (freezing temperatures, drought, vapor pressure deficit) to the radiation intercepted by a range of plant communities across an east--west transect in Oregon. The modifiers improved the relationship between intercepted ra-diation and net primary productivity (NPP, see later comment on definition); their analysis resulted in ε-values of 0.8 g MJ−1 ϕpa for aboveground NPP and 1.3 g MJ−1 for total NPP. All the vegetation types studied fell on regression lines (NPP versus ϕpa) that had r2 values of 0.99. McMurtrie et al. (1994) used a similar approach in a model-based study of gross primary productivity (GPP) at five pine stands at locations ranging from Sweden to Australia. In general, NPP is about one-third of GPP because maintenance respiration of foliage and other living biomass, plus the construction costs of new material, consume about two-thirds of the carbohydrates fixed by pho-tosynthesis. McMurtrie et al. (1994) improved the relationship
between GPP and ϕpa considerably by using environmental modifiers to alter the effectiveness of radiation utilization. When the modifiers have values less than unity they reduce the amount of effective, or utilizable, radiation, which leads to higher values of ε. In the case of the study by McMurtrie et al. (1994), ε increased from 1.23 to 1.88.
This paper presents an analysis of growth data collected from E. globulus plantations in Western Australia. The data comprise five sets of continuous monthly measurements made at separate sites over three years. They were collected primar-ily to allow evaluation of the performance of one of the de-tailed, mechanistic tree growth models mentioned earlier (BIOMASS; McMurtrie et al. 1990), but offered the opportu-nity to test the applicability of the simple ε-model, to examine environmental constraints on radiation utilization efficiency, and to determine values for ε and examine how they varied.
Sites and measurements Sites
Detailed descriptions of the plantations and site characteristics are given by Hingston et al. (1995). Briefly, the five sites----called Darkan 87, Darkan 84 (the planting dates), Mummbalup, Manjimup and Northcliffe----are located in the south west of Western Australia, in a region with a charac-teristic Mediterranean-type climate, across a climatic gradient with average annual rainfall ranging from about 600 to 1450 mm. Rooting depths were expected to be restricted to about 1.5 m at Mummbalup, 3 m at the Darkan sites, 6 m at Manjimup and up to 20 m at Northcliffe. Estimated total available water when the root zones were wet was at least 200--250 mm in all cases. Neutron access tubes to 6 m at Manjimup and Northcliffe indicated that water was extracted to that depth.
Initial characteristics of the plantations at each site are given in Table 1. The soils are moderately fertile (see Table 2) and analysis of nutrient concentrations in foliage and wood sup-ported the assumption that nutrition was not likely to be a factor limiting tree growth.
Measurements
From February 1991 to July 1993, climatic variables were continuously logged by automatic weather stations located close to each of the sites. Rainfall, total incoming solar radia-tion and total utilizable ϕpa (see ‘Analysis and results’) over the experimental period are given in Table 3. Monthly measure-ments were made of stem diameter (on 30 trees), leaf area index (L*) (determined with a Li-Cor LI-2000 Canopy Ana-lyzer, calibrated by biomass sampling and destructive leaf area determinations) tree height and canopy depth. Leaf area index fluctuated at all sites. The values at the beginning and end of the experimental period are given in Table 1.
Several trees were felled at each site to establish the relation-ship between diameter at 1.3 m and total biomass, and the relationships between stem, branch and foliage mass. Regres-sions were calculated so that the biomass components could be estimated from the monthly stem diameter measurements. Leaf mass was also estimated each month from the regressions, constrained by the relationship with L*.
Analyses and results
Biomass increments (∆G) versus cumulative ϕpa
The normal procedure for determining values of ε is to plot cumulative biomass (G(t)) against cumulative ϕpa(Σtϕpa). In this case, cumulative biomass to any time was the standing aboveground biomass at that time (Gb(t)) estimated from the monthly stem diameter measurements and the regressions on biomass components. A straight line relationship with slope ε is expected. (Note that this definition of cumulative biomass is
not the same as NPP, which is normally defined as carbon fixed minus autotrophic respiration. It would be difficult to obtain good estimates of NPP from biomass sampling, because the procedures would have to account for belowground turnover. To estimate aboveground NPP litterfall must be included. Most of the analyses presented here do not include litterfall, al-though its influence was evaluated (see ε values given in Discussion)).
To calculate ϕpa, daily values of L* were estimated by graphical interpolation between the values measured each month, which were connected by continuous curves. Absorbed photosynthetically active radiation, ϕpa, was calculated from daily solar radiation on the assumption that photon absorption is described by the widely used expression for exponential extinction of light in canopies, so that
ϕpa= 0.5ϕs(1 − exp(−kL∗)). (3)
We used k = 0.5 for all sites----a value unlikely to lead to serious error (see Jarvis and Leverenz 1983). Note that Equations 1 or 2, and 3 account for the influence of leaf area, which need not be considered further as a factor affecting growth.
The initial plots of Gb(t) against Σtϕpa (Figure1) yielded the trends expected, but also revealed that, at each site, there were quite long periods when growth was very slow. To investigate the reasons for this, we plotted monthly biomass increments (∆Gb) against the average air temperature for each month. The data indicated that ∆Gb tended to decrease with increasing temperature, which did not make biological sense for the range of temperatures involved. We therefore investigated the effects of vapor pressure deficit.
Table 1. Plantation characteristics.
Year Stocking Tree LAI LAI Standing Standing
planted stems height Feb July biomass biomass
ha−1 m 1991 1993 Mgha−1 Mgha−1
Darkan 1987 680 7.2 0.5 3.2 17.4 57.6
Darkan 1984 430 14.5 2.5 3.5 48.8 75.5
Manjimup 1984 680 25.0 5.0 4.0 109.6 151.4
Mummbalup 1988 1250 8.8 2.5 4.2 19.9 75.6
Northcliffe 1986 1250 16.3 6.0 6.0 129.5 225.6
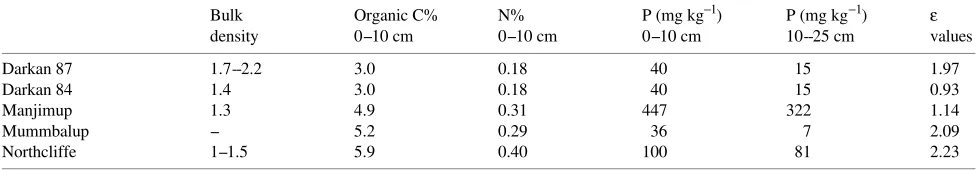
Table 2. Soil conditions and values of ε for each plantation. The ε-values are those for the whole experimental period, based on utilizable ϕpa.
Bulk Organic C% N% P (mg kg−1) P (mg kg−1) ε
density 0--10 cm 0--10 cm 0--10 cm 10--25 cm values
Darkan 87 1.7--2.2 3.0 0.18 40 15 1.97
Darkan 84 1.4 3.0 0.18 40 15 0.93
Manjimup 1.3 4.9 0.31 447 322 1.14
Mummbalup -- 5.2 0.29 36 7 2.09
Northcliffe 1--1.5 5.9 0.40 100 81 2.23
Table 3. Rainfall and radiation data for the experimental sites. Sym-bols: ϕs is total incoming solar radiation; ϕpa* is utilizable (corrected
for the effects of vapor pressure deficit) absorbed photosynthetically active radiation.
Rainfall Rainfall ϕs Oct 1990 ϕpa*
1991 1992 to July 1993 Total
(mm) (mm) (MJ m−2) (MJ m−2)
Darkan 87 384 505 17521 1696
Darkan 84 384 505 17521 2413
Manjimup 978 1118 16731 3348
Mummbalup 771 801 15865 2570
Influence of vapor pressure deficit on growth
Vapor pressure deficit (D) is generally inversely related to air temperature, and there is ample evidence in the physiological literature that stomatal conductance in most plants is inversely related to D (see Dye and Olbrich 1993; for results relating to E. grandis W. Hill ex Maiden; Pereira et al. 1986, Pereira et al. 1987, for results relating to E. globulus). When stomata are closed, leaves cannot absorb CO2 so growth must cease; there-fore, high values of D would be expected to cause reductions in growth. Dry mass increments in trees have not, to our knowledge, previously been shown to be directly affected by average vapor pressure deficits, although Myers et al. (1996)
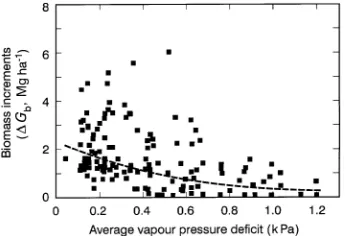
found a strong negative, non-linear relationship between an-nual stem volume increments in plantation eucalypts, and average evaporation rates at various locations in Australia. We calculated the daily average values of D from maximum and minimum temperatures and the corresponding relative humid-ity data, and plotted ∆Gb against the average monthly values of D. The result was a statistically significant inverse relation-ship (see Figure 2).
There is considerable scatter in Figure 2, but in view of the number of factors other than vapor pressure deficit that con-tribute to variation in biomass increments, this is not surpris-ing. To derive the modifier fD (Equation 2) we need to normalize the relationship between ∆Gb and D, so that it has a value of unity when D is small, i.e., where D has no effect. Because of the scatter in the data, several formulations are possible and will give results that are statistically indistiguish-able. A linear relationship is the simplest, but leads to the absurdity of negative values of ∆Gb when D gets high enough, so we used a log-linear model, which is consistent with the form of the relationship used by Dye and Olbrich (1993) (and was a better fit than a linear relationship: r2 = 0.29 versus r2 = 0.15). The resulting equation was ∆Gb = 2.4(exp (−1.88D)). Normalizing this by dividing through by the intercept gives the required equation for fD:
fD = 1.0(exp(−1.88D)). (4)
For reference, Equation 4 gives values of fD = 0.7, 0. 5 and 0.22 for D = 0.2, 0.4 and 0.8 kPa, respectively. Using Equation 4, daily values of fD were calculated and used to correct the daily values of ϕpa. Total aboveground biomass was then plotted
Figure 1. Cumulative aboveground biomass plotted against absorbed photo-synthetically active radiation (ϕpa). The
data cover the experimental period at each of the five sites. The open symbols show the results obtained when ϕpa was
not corrected in any way: the points to note are the ‘steps’ in the curves, indicat-ing no biomass increment despite the ab-sorption of large amounts of radiation. When ϕpa was corrected for the effects of
vapor pressure deficit (Figure 2, and text), to give utilizable radiation, the linearity of the relationships was signifi-cantly improved (filled symbols). The ε-values noted on the diagrams were calcu-lated from these (corrected) data.
Figure 2. Monthly biomass increments plotted against average monthly vapor pressure deficit (D, kPa), derived from daily values. Although there is considerable scatter, the relationship is good, when we consider the errors in estimating monthly growth increments and the number of factors that can influence them. The fitted curve has the equation ∆Gb = 2.4(exp(−1.88D)). Normalized, it gives the humidity
against cumulative values of ΣtϕpafD, which gave relationships with much improved linearity (see Figure 1). The ε-values on the corrected ϕpa curves on Figure 1 (see also Table 3) were calculated by linear regression (r2 values were all > 0.98), although simple graphical analysis gave essentially the same values.
Soil water
We had intended to use soil water data to evaluate fθ (Equa-tion 2). Daily values of total soil water content in the root zone of each plantation were calculated using the water balance routines in BIOMASS (see McMurtrie et al. 1990, McMurtrie et al. 1992). For two of the plantations (Darkan 87 and Mummbalup) the calculated values corresponded closely with values measured with a neutron probe. For the Manjimup and Northcliffe plantations there were periods----particularly when
extractable water was, according to the calculated balances, largely depleted----when measured values were significantly higher than calculated values. For the Darkan 84 plantation, the correspondence between measured and calculated soil water contents was poor.
To illustrate, we present the Darkan 87, Darkan 84 and Northcliffe data in Figure 3. The higher measured than mod-eled water contents indicated that there was capillary rise from the water tables into the root zone as the soils dried.
Unfortunately, the discrepancies between calculated and measured soil water content, the known existence of water tables at about 3 m depth at both the Darkan sites, and clear evidence from neutron probe measurements of extraction to 6 m at Manjimup and Northcliffe combine to make it impos-sible to obtain useful information about the effects of soil water on the growth of these plantations. There was no evidence that shortage of soil water was a major factor affecting the effi-ciency of utilization of absorbed radiation at any site: monthly measurements of predawn leaf water potential (Ψpd), from June 1992 March 1993 (inclusive), showed that, except for February and March 1993 at Mummbalup, Ψpd never fell below --1.3 MPa. (The two exceptions were --1.9 and --3.2 MPa, respectively.) We therefore conclude that, in general, water stress was not a factor affecting the growth of these trees and, even if it was, the differences between sites were not large or consistent enough to allow useful comparative analyses. This conclusion is supported by data presented by Dye (1996), who found that E. grandis trees in South Africa could extract water to at least 8 m depth, and showed no signs of stress until Ψpd reached about −2 MPa.
As another measure of the possible effects of soil water on growth, we calculated monthly average water deficit indices
I
_
θ for each site, based on measured water contents in the top 3 m, for the periods (n days) when soil water content was measured by neutron probe. The formula used was
I
_
θ=
∑
1 t(θ−θmin)⁄(θmax−θmin)
n . (5)
We took θmax = total available water (mm), determined from neutron moisture meter measurements of maximum and mini-mum water contents in the root zones, and θmin = 0. Plotting biomass increments against these values only indicated a rela-tionship in the case of the Darkan 84 data, where monthly biomass increments were inversely related to water deficit indices. At the other sites, scatter in the data was such that no clear relationship could be identified. The overall average values of _Iθ for the last year of the experimental period ranged from 0.37 to 0.49, with no indication of any relationship between them and the ε-values calculated for the same period. (These ε-values were not significantly different from those obtained for the whole experimental period.) Therefore ences in soil water did not provide an explanation for differ-ences in values of ε (i.e., fθ = 1).
Soil chemistry
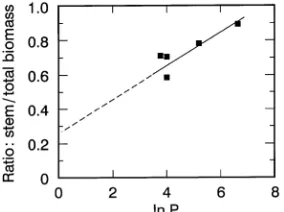
There was no apparent relationship between the chemical properties of the soils and the growth rates and radiation conversion efficiencies of the trees at these five sites. The soil chemical properties are summarized in Table 3, which shows the lack of any relationship with the ε-values. However, in examining the influence of soil chemical properties on the growth and growth patterns of the trees, we plotted the allomet-ric ratios of stem to total biomass (ηs = Gstems/Gb) against the natural logarithm of phosphorus content (mg kg−1) of the top 25 cm of soil. The result was Figure 4, which shows a remark-ably strong relationship between ηs and soil P (r2 = 0.85). Although this does not explain the differences in ε, it is a significant finding, and is discussed below. Hingston et al. (1995), in their assessment of the performance of the model BIOMASS in relation to these data, found that, to achieve correspondence between modeled and measured aboveground productivity, it was necessary to adjust the proportions of assimilate allocated to stems and roots. The allometric ratios for stems in relation to Gb varied from 0.5 to 0.7, but did not vary systematically with stand age.
Discussion
This paper provides information about the values of the radia-tion utilizaradia-tion coefficient (ε) for aboveground growth and about the influence of air humidity on growth. Because the photosynthetically active radiation absorbed by the leaves was corrected for the effects of air humidity on stomatal conduc-tance to give a measure of utilizable radiation, the ε-values resulting from the analysis will tend toward maximum achiev-able values, reflecting the capacity of the plant community to produce biomass under optimum growing conditions. The highest ε-values (for Mummbalup and Northcliffe) are near the value of about 2.8 g MJ−1ϕpa obtained by Cannell et al. (1987, 1988) for young Populus and Salix grown under unconstrained conditions, suggesting that these values are nearing the maxi-mum achievable for trees. When used in models to calculate community productivity, maximum ε-values would be used
and the modifiers applied to them----not to absorbed radia-tion----although the distinction is largely semantic because the modifiers are multiplicative.
The low ε-values obtained from the Darkan 84 and Man-jimup plantations indicate that there were factors limiting radiation utilization by the trees in those plantations that we have not been able to identify.
The ε-values obtained from this analysis (Figure1; Table 3) are based on standing biomass, excluding litterfall, and are higher than the values (about 0.9 and 0.8 g MJ−1ϕpa) estimated by Linder (1985) and by Beadle and Inions (1990), respec-tively (also excluding litterfall). The differences between our values and theirs are easily accounted for by the corrections for utilizable radiation that we made on the basis of the (inverse) relationship between growth and vapor pressure deficits. Un-corrected values of ε would have been: Darkan 87, 0.76; Darkan 84, 0.37; Manjimup, 0.58; Mummbalup, 0.92; North-cliffe, 1.23. When we include total litterfall over the experi-mental period, to give a true estimate of NPP, the ε-values (utilizable radiation) are: Darkan ‘87, 2.34; Darkan ‘84, 1.18; Manjimup, 1.44; Mummbalup, 2.48; Northcliffe, 2.73.
Although the effects of D on stomatal conductance, and hence photosynthesis, are well documented, dry mass incre-ments in trees have not previously been shown to be directly affected by vapor pressure deficits. The results obtained in this analysis are consistent with results from physiological studies by Pereira et al. (1986), who showed that, in a similar climate (Portugal), stomatal conductance and net photosynthesis in E. globulus respond strongly to vapor pressure deficit. Pereira et al. (1986) demonstrated seasonal effects on net photosynthe-sis, which was much higher in winter and spring than in summer. We would expect the relationship between growth and vapor pressure deficit to be influenced by differences in respiration between sites and growth periods (see McMurtrie et al. 1994) and by differences in carbon allocation patterns, which would particularly affect aboveground growth patterns. Nevertheless, the connection established in Figure 2, and its effects on the linearity of the Gb/Σϕpa relationship (Figure 1), provide convincing evidence that vapor pressure deficits exert first-order effects on the efficiency with which absorbed pho-tosynthetically active radiation is converted to biomass, and that ϕpa, and hence ε, should be corrected for these effects.
Soil water effects on radiation utilization efficiency may operate over relatively long periods (weeks, seasons) by influ-encing leaf growth rates and, in severe drought conditions, causing leaf shedding (see Pook 1986, Linder et al. 1987). Over shorter periods (diurnal patterns) we would expect dry soils to affect growth through effects on stomatal responses and interactions with factors such as atmospheric humidity. Direct measurements of stomatal conductance will be needed to identify these (for an example, see the study by Tan et al. 1978). The underlying mechanism governing the soil water/at-mospheric humidity effect on stomata must be the rate at which water can move from the soil to the leaves of the trees: if the atmospheric demand is strong (high D), flow rates to leaves are not fast enough, regardless of soil water content, and the stomata close. If they did not, the leaves would dry out. The
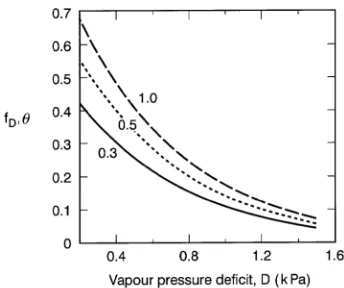
same effect would occur at low D when soil water content in the root zone limits the rate at which water can move from soil to leaves. The fθ term in Equation 2 is therefore likely to have the form fθ = (1--exp(--bθ), where θ takes values between 0 and 1 (see Equation 4) and b would be expected to have a value of about 3. The consequences of this formulation are illustrated in Figure 5.
The generally good correspondence between measured and simulated soil water contents in the Darkan 87 and Mummbalup plantations, and in Manjimup and Northcliffe from the time the rains came in May 1992, indicates that the water balance calculations in the BIOMASS model can gener-ally be accepted as accurate and will be useful as a basis for calculating the probability of water shortages in many situ-ations (see also McMurtrie et al. 1992). The model makes no allowance for the presence of water tables, which appear to account for the differences between measured and simulated soil water content for some periods at some sites.
The lack of any obvious relationship between soil chemical properties and productivity reflects the long-standing diffi-culty in forestry of predicting the effects of soil fertility (as determined by conventional techniques) on tree growth rates and productivity. The difficulty lies in the complexity of soil chemistry per se, and the need to identify the chemical forms taken up and used by plants, and in the fact that growth rates are governed by the rate at which nutrients become available to the trees from the soil. That rate is determined by nutrient mineralization and organic matter turnover rates as much as by the absolute amounts of nutrient present at any time. Effects of soil chemistry on ε would be expected to operate through mechanisms such as the influence of leaf nitrogen content on maximum rates of leaf photosynthesis, although we found no evidence in the literature that this mechanism operates in eucalypts and no clear relationship between average leaf nitro-gen content and ε-values emerged from this study.
The positive relationship between stem/total biomass ratio (ηs) and soil P is important. It indicates that a higher proportion of the carbon fixed by photosynthesis is allocated to the stems of trees in relatively fertile soil than in less fertile soils. This is consistent with the general (but not universal) finding that trees growing in poor soils tend to allocate a greater proportion of
their carbon to roots than to aboveground biomass (see Linder and Rook 1984, Beets and Whitehead 1996). These growth responses to fertility suggest that the influence of nutrition on tree growth and wood production observed in hundreds of forest fertilization experiments may, in many cases, be as much a consequence of altered carbon allocation patterns as of changes in amounts of carbon fixed. Another result that emerged from the analysis was a surprising inverse relation-ship between soil N and the foliage/total biomass ratio (ηf) (Figure 6). This was also statistically highly significant (r2 = 0.58), despite the small number of points. It suggests that, although improved nitrogen nutrition may result in increasing leaf area, it may also result in increased partitioning of above-ground dry mass to stems, so that ηf falls. There was no relationship between ηf and biomass production per se. The form and coefficient values of the relationships between the allometric ratios and soil nutrient status require confirmation from other studies, but they are potentially helpful from the point of view of predicting wood production because the val-ues of the allometric ratios provide a means of estimating stem production. The procedure would be to use Equation 2 to calculate Gb(t), and use allometric ratios to calculate the mass of the component parts (leaves, branches, stems).
In conclusion, we note that the analysis and results presented here strengthen the case for the use of empirical values of ε in models of forest productivity, and for the use of modifiers based on environmental constraints, when these can be clearly identified. Research in this area should focus on the translation of knowledge about the effects of physiological processes on growth into quantitative expressions of the influence of those processes, integrated over intervals of months or seasons, on biomass production. To identify and quantify such effects, it will be necessary to carry out research using more sensitive measures of growth than inferred biomass increments, with measurements of stomatal conductance, leaf nitrogen dynam-ics and plant water relations.
We suggest that ε≈ 2.2 g MJ−1ϕpa is a good working value for actively growing Eucalyptus plantations with adequate soil water and nutrition. Equation 4 can be used to allow for the effects of atmospheric humidity.
Figure 5. The expected form of the soil water content × vapor pressure modifier curves.
Acknowledgments
We thank Richard Waring for useful comments and discussion at the review stage of this paper.
References
Beadle, C.L. and G. Inions. 1990. Limits to growth of eucalypts and their biology of production. In Prospects for Australian Forest Plantations. Eds. J. Dargavel and N. Semple. CRES, Australian National University, Canberra, ACT, pp 183--193.
Beets, P.N. and D. Whitehead. 1996. Carbon partitioning in Pinus radiata stands in relation to foliage nitrogen status. Tree Physiol. 16:131--138.
Cannell, M.G.R., J. Sheppard. and R. Milne. 1988. Light use effi-ciency and woody biomass production of poplar and willow. For-estry 61:125--136.
Cannell, M.G.R., L. Milne, J. Sheppard and M.H. Unsworth. 1987. Radiation interception and productivity of willow. J. Appl. Ecol. 24:261--278.
Dye, P.J. 1996. Response of Eucalyptus grandis trees to soil water deficits. Tree Physiol. 16:233--238.
Dye, P.J. and B.W. Olbrich. 1993. Estimating transpiration from 6-year-old Eucalyptus grandis trees: development of a canopy con-ductance model and comparison with independent sap flux measurements. Plant Cell Environ. 16:45--53.
Hingston, F.J., J.H. Galbraith and G.M. Dimmock. 1995. Evaluating the effects of soils and climate on productivity of Eucalyptus globu-lus plantations on contrasting sites in south west of Western Austra-lia. Final Report to Rural Industries Research and Development Corporation. Project CSF-41A. 67 p.
Jarvis, P.G. and J.W. Leverenz. 1983. Productivity of temperate, de-ciduous and evergreen forests. In Encyclopedia of Plant Physiology, Vol. 12D, Part IV. Eds. O.L. Lange, P. S. Nobel, C.B. Osmond and H. Ziegler. Springer-Verlag, Berlin, pp 234--280.
Landsberg, J.J. 1986. Physiological ecology of forest production. Academic Press, NY, 198 p.
Landsberg, J.J., S.D. Prince, P.G. Jarvis, R.E. McMurtrie, R. Luxmoore and B.E. Medlyn. 1996. Energy conversion and use in forests: an analysis of forest production in terms of radiation utili-sation efficiency. In The Use of Remote Sensing in the Modeling of Forest Productivity at Scales from the Stand to the Globe. Eds.H. L. Gholz, K. Nakane and H. Shimoda. Kluwer Acad. Publ., Dordrecht. In press.
Linder, S. 1985. Potential and actual production in Australian forest stands. In Research for Forest Management. Eds. J.J. Landsberg and W. Parsons. CSIRO, Melbourne, pp 11--35.
Linder, S. and D.A. Rook. 1984. Effects of mineral nutrition on the carbon dioxide exchange of trees. In Nutrition of Forest Trees in Plantations. Eds G.D. Bowen and E.K.S. Nambiar. Academic Press, London, pp 211--236.
Linder, S., M.L. Benson, B.J. Myers and R.J. Raison. 1987. Canopy dynamics and growth of Pinus radiata. I. Effects of irrigation and fertilization during a drought. Can. J. For. Res. 17:157--165. McMurtrie, R.E., D.A. Rook and F.M. Kelliher. 1990. Modelling the
yield of Pinus radiata on a site limited by water and nitrogen. For. Ecol. Manage.30:381--413.
McMurtrie, R.E., R. Leuning, W.A. Thompson and A.M. Wheeler. 1992. A model of canopy photosynthesis and water use incorporat-ing a mechanistic formulation of leaf CO2 exchange. For. Ecol.
Manage. 52: 261--278.
McMurtrie, R.E., H.L. Gholz, S. Linder and S.T. Gower. 1994. Cli-matic factors controlling the productivity of pine stands: a model-based analysis. Ecol. Bull. 43:173--188.
Monteith, J.L. 1977. Climate and the efficiency of crop production in Britain. Phil. Trans. R. Soc. Lond. B. 281:277--294.
Myers, B.J., S. Theiveyanathan, N.D. O’Brien and W.J. Bond. 1996. Growth and water use of Eucalyptus grandis and Pinus radiata
plantations irrigated with effluent. Tree Physiol. 16:211--219. Pereira, J.S., J.D. Tenhunen and O.L. Lange. 1987. Stomatal control
and gas exchange of Eucalyptus globulus Labill. trees under field conditions. J. Exp. Bot. 38:1678--1688.
Pereira, J.S., J.D. Tenhunen, O.L. Lange, W. Beyschlag, A. Meyer and M.M. David. 1986. Seasonal and diurnal patterns in leaf gas ex-change of Eucalyptus globulus trees growing in Portugal. Can. J. For. Res. 16:177-- 184.
Pook, E.W. 1986. Canopy dynamics of Eucalyptus maculata Hook. IV. Contrasting responses to two severe droughts. Aust. J. Bot. 34:1--14.
Running, S.W. and J.C. Coughlan. 1988, A general model of forest ecosystem processes for regional applications. I. Hydrologic bal-ance, canopy gas exchange and primary production processes. Ecol. Model. 42:125--154.
Running, S.W. and S.T. Gower. 1991. FOREST-BGC, A general model of forest ecosystem processes for regional applications. II. Dynamic carbon allocation and nitrogen budgets. Tree Physiol. 9:147--160.
Runyon, J., R.H. Waring, S.N. Goward and J.M. Welles. 1994. Envi-ronmental limits on net primary production and light-use efficiency across the Oregon transect. Ecol. Appl.4:226--237.
Saldarriaga, J.G. and R.J. Luxmoore. 1991. Solar energy conversion efficiencies during succession of a tropical rainforest in Amazonia. J. Trop. Ecol. 7:233--242.
Tan, C. S., T.A. Black and J.U. Nnyamah. 1978. A simple diffusion model of transpiration applied to a thinned Douglas-fir stand. Ecol-ogy59: 221--229.
Wang, Y.-P. and P.G. Jarvis. 1990. Description and validation of an array model----MAESTRO. Agric. For. Meteorol. 51: 257--280. Wang, Y.-P., R.E. McMurtrie and J.J. Landsberg. 1992. Modelling