The Likely Economic Impact from the Yogyakarta and Central Java Earthquake
Tulus TambunanKadin Indonesia-Jetro 2006
Just as people living in the provinces of Yogyakarta and Central Java were recovering from the recent
volcanic eruption of Mount Merapi, an earthquake registering 5.9 on the richter scale according to the
Meteorology and Geophysics Agency hit these two regions. People in the nine regencies and city in the
provinces of Yogyakarta and Central Java were affected. The center of the earthquake was estimated at 38
kilometers south in the Indian Ocean and 33 kilometers below the ocean bed. Three regencies - Bantul and
Gunung Kidul in the special region of Yogyakarta and Klaten in Central Java - were hit the hardest in terms of
casualties and material damage. More than 4,500 people dead, many more injured and around 14,000 houses
destroyed. The government’s preliminary estimate of the material loss is Rp2.5 trillion (US$270 million).
Several tourist attractions, such as the Prambanan Hindu temples and the palace of Yogyakarta’s sultan, were
damaged by the earthquake. However, the nearby Borobudur Buddhist temple was not hit (see the map below).
Map of Java Island and the Earthquake Hit Area
This earthquake is part of a series of earthquakes over the last 18 months starting in Aceh and Nias in North
Sumatera that resulted in the tsunami in December 2004, as the moving plates are under the same belt. The
latest earthquake was not linked to the eruption of Mount Merapi. The earthquakes have been moving south
from North Sumatera to West Sumatera with the last one in Lampung province in South Sumatera, the center of
which was in the Sunda Strait (between the islands of Sumatera and Java. When the Lampung earthquake hit
The provincial government of Yogyakarta estimated that the loss of material damage could reach as much as
Rp2.5 trillion, as around 14,000 houses, mostly belonging to medium- to low-income groups, and public
infrastructure such as Yogyakarta’s international airport, railroads and electric plants were either damaged or
destroyed.
Economic impact
1The province of Yogyakarta is historically a distinctive place in Indonesia’s politics and nationhood. It
became the temporary capital city of Indonesia during the war against the Dutch in the late 1940s when the
former Sultan of Yogyakarta, Sri Hamengku Buwono IX, turned over power to former President Soekarno to
defend the unity of the country. Economically, Yogyakarta has a relatively small share in the nation’s GDP,
being only around 1.07% in 2004. The population of Yogyakarta is only around 3.17 million people, or 1.5% of
the total population of Indonesia. The economic profile and distribution of regional output by sector of
Yogyakarta and Central Java are presented, respectively, in Tables 1 and 2.
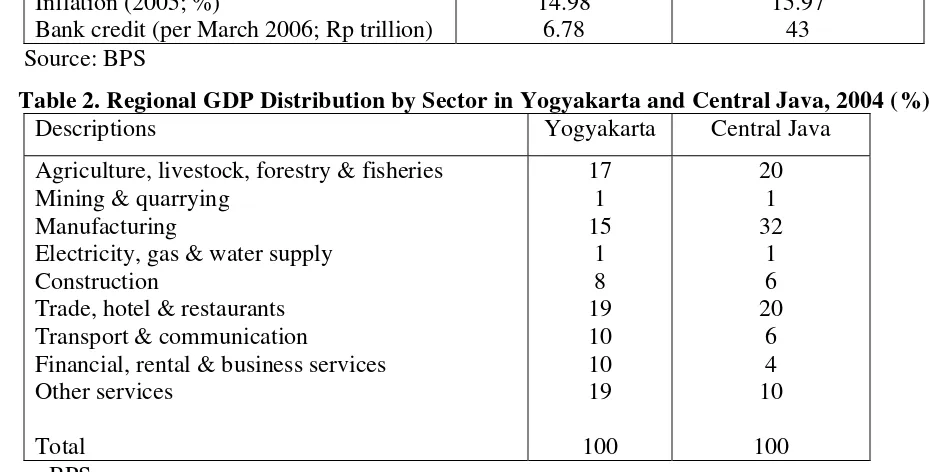
Table 1. Economic Profile of Yogyakarta and Central Java
Descriptions Yogyakarta Central Java
Area (km2) Population (2005)
Regional GDP (2004; Rp. Million) Regional GDP p.c. (2004; Rp) Inflation (2005; %)
Bank credit (per March 2006; Rp trillion)
3,133.15 3,181,200 21,848,682.1
6,777,908.2 14.98
6.78
32,799.71 33,064,400 175,584,778.8
5,395,505.4 15.97
43 Source: BPS
Table 2. Regional GDP Distribution by Sector in Yogyakarta and Central Java, 2004 (%)
Descriptions Yogyakarta Central Java
Agriculture, livestock, forestry & fisheries Mining & quarrying
Manufacturing
Electricity, gas & water supply Construction
Trade, hotel & restaurants Transport & communication
Financial, rental & business services Other services
Total
17 1 15
1 8 19 10 10 19
100
20 1 32
1 6 20
6 4 10
100 Source: BPS
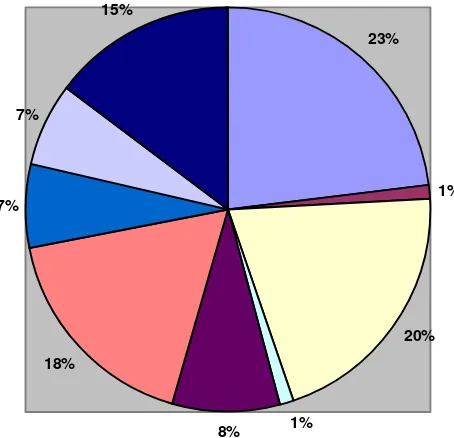
Two areas outside Yogyakarta city (DIY) which are the most destroyed areas are Klaten (in Central Java)
and Bantul (in the Province of Yogyakarta). From a total of more than 6,000 dead, about 3,968 people are in
1
Bantul, compared to 1,680 in Central Java. The most important sector for both Klaten’s and Bantul’s is
agriculture (Figures 1 and 2).
Figure 1: Economic Structure of Klaten, 2004 (%)
23%
1%
20%
1% 8%
25% 3%
5%
14%
Agriculture Mining Industry
Electricity, gas and water Construction
Trade, hotel & restaurant Transport & communication Finance, rental & business services Other services
Figure 2: Economic Structure of Bantul, 2004 (%)
23%
1%
20%
1% 8%
18% 7%
7%
15%
Source: BPS
.
The most important sectors for the two provinces’ economy can be elaborated further as the followings:
1) Trade, hotels and restaurants which are very important economic activities in/sources of regional incomes for
Yogyakarta and Central Java (especially Yogyakarta as it together with Bali are still the most important
(Rp38,942,535.04 million) of the regions’ total GDP, respectively; in Yogyarakta, from that 19% share,
restaurants having a 10.3% share;
2) Services make up, respectively, 19% (Rp4,290,460.27 million) and 10% (Rp19,647,530.03 million) of the
regions’ total GDP, dominated by public administration and defense with a 13.0% share in Yogyakarta;
3) Agriculture makes up, respectively 17% (Rp3,636,705.09 million) and 20% (38,492,121.60 million) of the
regions’ total GDP, and in Yogyakarta the sector is dominated by farm food crops with a 12.6% share;
4) Manufacturing industry makes up, respectively, 15% (3,219,137.30 million) and 32% (63,136,563.39
million) of the regions’ total GDP (all non-oil & gas and most of on small-and medium-scale industries
(SMIs) supporting tourism).
Similar to many other smaller regions outside the capital city of Jakarta, Yogyakarta had a surplus of bank
funds of almost Rp6.0 trillion in January 2006. Total third-party funds in the banking sector reached Rp11.52
trillion, while the amount of commercial bank loans in Yogyakarta was only Rp5.69 trillion, or around 0.9% of
total national bank loans. Although having a relatively higher share of loans from rural credit banks at 5.65% of
the total national rural credit bank loans, the nominal amount of rural credit bank loans in Yogyakarta is
considered small at only Rp825 billion. These loans from rural credit banks serve the needs of SMIs, which are
numerous in the area, for working capital and investment credit.
The impact of higher inflation in Yogyakarta due to higher prices for fuel and transportation is unlikely to
push the national inflation rate much higher, as the weight of Yogyakarta in the national consumption price
index (CPI) is a mere 1.22%. However, there is a growing concern about social implications, as GDP per capita
in Yogyakarta is relatively small at only Rp5.9 million (US$690), or only 63.7% of the nation’s GDP per capita.
Provincial minimum wages in Yogyakarta are also low at Rp460,000, which is 56.2% lower than minimum
wages in the capital city of Jakarta.
However, with a cheaper cost of living in Yogyakarta, purchasing power should be relatively unaffected.
The regency of Bantul, the hardest hit area by the earthquake, has a population of almost 800,000 people living
in an area of 506.85 square kilometers. In this regency, the agriculture sector dominates economic activities (at
29.6% of total regional GDP), followed by small scale manufacturing industry (at 18.5% of total regional GDP),
and hotels and restaurants (at 17.07% of total regional GDP).
From the national economy perspective, the total or multiplier impact (i.e. direct or first round and indirect
or second round) of the earthquake in Yogyakarta and Central Java on the Indonesian economy is likely very
small, especially with respect to Yogyakarta. As can be seen in Table 3, the output distribution of Yogyakarta to
GDP is only 1%, compared to that of Central Java at less than 9%.
Table 3: GDP Distribution by Provinces, 2000-2004 (constant prices 2000)
Nangroe Aceh Darussalam
West Kalimantan Central Kalimantan South Sulawesi Southeast Sulawesi
West Nusa Tenggara East Nusa Tenggara Maluku
Impact on the government budget
Vice President Jusuf Kalla announced that the central government will earmark Rp1 trillion of government
spending (around 0.03% of GDP) to help people in the disaster area recover from the emergency situation and
then rebuild the area. On top of that, many countries have offered to give aid (money, medical/health teams and
in kind) to the government to help the earthquake victims. According to a local newspaper, the total amount of
private companies. Additional government spending of Rp1 trillion is not such a big increase for the
government’s budget deficit. Alternatively, with the approval of parliament, the government could also
reallocate some spending to help rebuild the disaster area. Furthermore, the central government budget was still
in surplus of around Rp11 trillion as of 15 May due to slow spending.
Impact on the market
On the first day of trading following the earthquake on 29 May, government bonds were somewhat slightly
better bid, shaking off any negative impact caused by the earthquake over the weekend. Overall, the market was
quiet with some interest in the FR0025, FR0029, and FR0033. The USD/IDR was sold from 9,270 at the
opening to 9,210. There was market talk that bonds will not continue to consolidate until the inflation figure is
released on 1 June. The Jakarta Stock Exchange Composite Index managed to increase 10pts, closing at 1,333
from the close on 25 May. Government bond yields closed at 12.10% -12.20% for mid tenors, with the longer
end staying at an average of 12.20% - 12.30%.
Impact on Small and Medium Enterprises
In Indonesia, small and medium enterprises (SMEs) have historically been the main players in domestic
economic activities, especially as a large provider of employment opportunities, and hence a generator of primary
or secondary source of income for many households, especially for the poor. For low income or poor farm
households in rural areas, especially small enterprises (SEs), including micro or household enterprises, in non-farm
activities are especially important. These enterprises have also been playing as an important engine for the
development of local economies and communities (Tambunan, 2006).
The importance of SMEs for the Indonesian economy is observable reflected by their relatively huge
number of units. Indeed, a significant feature of the Indonesian economy is the domination by this category of
enterprises, in particular SEs. Totally, in all sectors of the economy, the number of SEs is huge and it keeps
growing; though there was a decline during the 1997 economic crisis. Their number of units is larger than that of
medium enterprises (MEs) and large enterprises (LEs). Especially SEs can be found in all over the country, in
urban as well as rural areas. Such entities contribute the bulk of units and employment in sectors such as
agriculture, trade, manufacturing industry and transportation (Table 4).
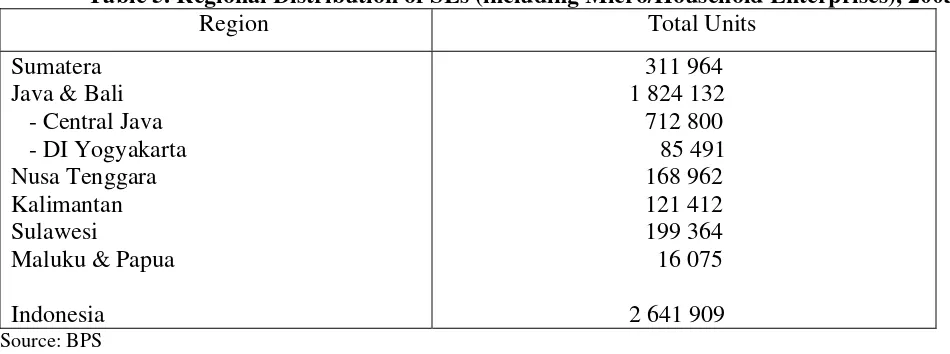
Regionally, the majority of SMEs in all sectors are concentrated in Java, particularly in Central Java,
including the province of Yogyakarta, as the country’s population is also concentrated in this region. As can be
of business with on average 1-4 workers but many of them are self-employment units with family members as
helpers or unpaid workers) are found in Central Java and DI Yogyakarta.
Table 4. Total Enterprises by Size Category
Size Category
1997 1998 1999 2000 2001 2003 2004
∑ SEs* 39,704,661 36,761,689 37,804,536 38,985,072 40,137,773 42,475,756 43,158,468
∑ MEs 60,449 51,889 51,798 55,061 57,743 59,580 63,361
∑ LEs 2,097 1,831 1,832 1,946 2,095 2,169 2,248
Total 39,767,207 36,815,409 37,858,166 39,042,079 40,197,611 42,537,505 43,224,077 Note: *: including micro enterprises.
Source: Menegkop & UKM
Table 5. Regional Distribution of SEs (including Micro/Household Enterprises), 2003
Region Total Units
Sumatera Java & Bali - Central Java - DI Yogyakarta Nusa Tenggara Kalimantan Sulawesi
Maluku & Papua
Indonesia
311 964 1 824 132 712 800 85 491
168 962 121 412 199 364 16 075
2 641 909 Source: BPS
In manufacturing industry, SMEs are usually clustered together by groups of industry (or subsector of
manufacturing) and regions. The clusters were established naturally as traditional industrial activities of local
communities whose production of specific products have long been proceeding. Based on comparative
advantages of the products they make, at least with respect to the abundance of local raw materials and workers
who have special skills in making such products, many of these clusters have a large potential to grow.
Various studies show the importance of clustering not only for the development of SMEs in the clusters, but
also for the development of villages/towns in Indonesia. Schiller and Martin-Schiller (1997), for instance,
describe how clusters of wood furniture producers in Jepara in Central Java in the 1980s had transformed the
town into a thriving commercial center with a five-mile avenue of furniture showrooms and factories, modern
hotels, new commercial banks, supermarkets, telephone and fax stalls, and European restaurants.
According to their level of development, clusters of SMEs in manufacturing industry in Indonesia can be
1) “Artisinal”: mainly micro or home industries; low productivity and wage; stagnated (no market expansion,
increased investment and production, improved production methods, and management,
organization and production development; local market (low-income consumers) oriented; used
primitive or obsolete tools and equipment; many producers are illiterate and passive in marketing
(producers have no idea about their market); the role of middlemen/traders is dominant
(producers are fully dependent on middlemen or trader for marketing); low degree of interfirm
co-operation and specialization (no vertical cooperation among enterprises); no external
networks with supporting organizations.
2. “Active”: used higher skilled workers and better technology; supplied national and export markets; active in
marketing; the degree of internal as well as external networks is high.
3. “Dynamic”: trade networks overseas are extensive; internal heterogeneity within clusters in terms of size,
technology, and served market is more pronounced; leading/pioneering firms played a decisive
role.
4. “Advanced”: the degree of interfirm specialization and cooperation is high; business networks between
enterprises with suppliers of raw materials, components, equipment and other inputs, providers of
business services, traders, distributors, and banks are well developed; cooperation with local,
regional, or even national government, as well as with specialized training and research institutions
such as universities is good; many firms are export-oriented (mainly through trading houses or
exporting companies).
The first type of cluster dominated clusters in Indonesia, indicating that the process of clustering in the
country is still at an infant stage. Altenburg and Mayer-Stamer (1999) refer to such clusters as “survival”
clusters of home industries. In Yogyakarta, some SMI clusters are predominantly home industries.
The second type developed rapidly in terms of skill improvement, technological upgrading, and successful
penetration of domestic and export markets. Typical examples are such as roof tiles industry clusters, metal
casting industry clusters, shuttle-cock industry clusters, shoe industry clusters, furniture industry clusters, and
brass-handicraft industry clusters that can be found many in Central Java.. In these clusters, some enterprises
start to influence the development trajectory of the clusters, and some enterprises produce for export through
middlemen or traders or trading houses from outside the clusters.
Clusters of the third type often overlap and interlink with other clusters in the same region. Such cluster
agglomerations, or often-called industrial districts (the Italian term), form the most complex form of clustering,
where different sectors or subsectors mutually depend on and benefit from each other. Prominent examples of
machinery industry), southern Germany (vehicle, electronics, machinery, and software industries) and Greater
London (banking, insurance, software, publishing, film and music, tourism, fashion industry, advertising,
business services). In Indonesia, one example of a cluster agglomeration is the Yogyakarta–Solo area (Central
Java) with its tourism, furniture and interior decoration, metal processing, leather goods, and textile/clothing
clusters, which all mutually benefit each other.
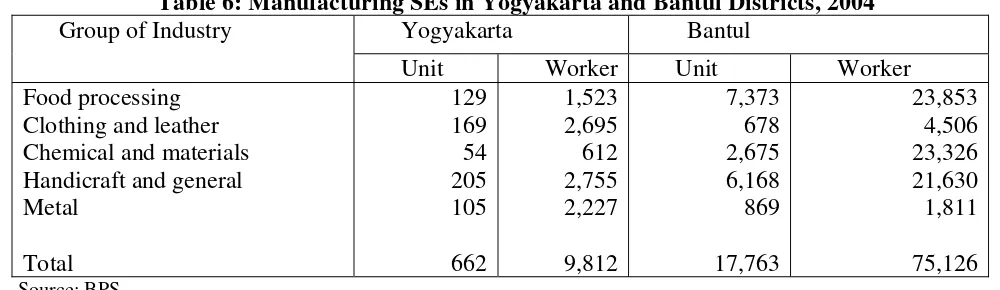
Based on official regional data 2004, in manufacturing industry in Yogyakarta and Bantul districts (within
the Province of Yogyakarta) there were 662 and 17,763 SEs, with total employment of 9,812 and 75.126
people, respectively. The majority of these enterprises were found in handicraft and general industry (Table 6).
In Bantul, there are MEs and LEs, while in Yogyakarta city, in the same period, there were 39 mainly MEs with
a total of 4,076 employees.
Table 6: Manufacturing SEs in Yogyakarta and Bantul Districts, 2004
Yogyakarta Bantul
Group of Industry
Unit Worker Unit Worker
Food processing Clothing and leather Chemical and materials Handicraft and general Metal
Total
129 169 54 205 105
662
1,523 2,695 612 2,755 2,227
9,812
7,373 678 2,675 6,168 869
17,763
23,853 4,506 23,326 21,630 1,811
75,126 Source: BPS
Based on recent official information from the State Ministry of Cooperative and Small and Medium
Enterprises and the Ministry of Industry, a total of 23 SME clusters in Yogyakarta and Central Java are
damaged 25% to 100%. The most damaged clusters (80%) include silver handicraft industry clusters in
Kotagede which consists of 1,500 enterprises. They produce a variety of silver products for export to countries
like Australia, South Africa, and a number of countries in the European Union with minimum 2 to 3 containers
(20 feet) on average per month and for domestic markets in big cities like Bali and Jakarta with minimum 1 to 2
containers on average per month. Others, such as clusters of industries producing gerabah (earthenware vessel)
in Kasongan with 400 units are damaged 90% and industries making kerupuk (chips made of flour slavored) in
Yogyakarta with 138 enterprises are damaged 100%. According to the Office, to put these damaged clusters in
production again about Rp 125 to Rp 150 billions are needed.
The main reasons that they do not produce any more since the earthquake are: (i) factories destroyed; (ii) no
It is generally expected that the stop production of that so many SMEs will hurt the tourism sector not only
in Yogyakarta or Central Java itself but also in Bali. About 60% of handicrafts sold in Bali are originated from
SME clusters in Yogyakarta.
Another most likely effect is that, with the earthquake hitting many SMEs, amount of non-performing loans
(NPL) is expected to increase, despite the possibility of the banking sector extending six months of no default
penalties (similar to what bands did in the tsunami hit area of Aceh). However, with a very small share of credit
extended and a small share of NPL in Yogyakarta (0.33% of total national bank NPL), the impact of increasing
NPL in Yogyakarta on the national NPL is likely to be relatively small.
Impact on Poverty
Historical Trend of Poverty Incidence
By the end of 1960s, the average Indonesian earned only roughly US$50 a year, and over 80% of the
country’s population lived on tiny, fragmented and scattered farms. They had little or no access either to
rudimentary health care or to basic amenities of life such as safe drinking water or adequate shelter. About 60%
of adult Indonesian could not read or write and close to 65% of the country’s population lived in absolute
poverty. However, with a sustained rapid economic growth during the new order (NO) era (i.e. 1966-1998), the
income per capita has increased significantly and the percentage of population deemed as poor has declined
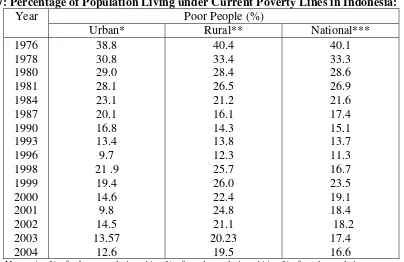
dramatically. The National Socio-Economic Survey (SUSENAS) data from the National Agency of Statistics
(BPS) show that in 1976 the national poverty rate was 40.1% and steadily declined to 11.3% in 1996. When the
crisis occurred in 1997 and reached its climax in 1998, the poverty rate increased to 16.7% and reached its peak
level at 23.5% in 1999. The rebound of the country’s economy in 2000 has led to a drop again in poverty
incidence (Table 7).
As can be seen, in the pre-1997/98 economic crisis period, the poverty rate in rural areas declined faster than
that in urban areas. There were at least three causes: (i) agricultural output growth that led employment in the
sector and farm income to increase; (ii) employment increased in rural non-farm activities like agro-industries,
trade, services and rural transportations as a result of improved rural infrastructure and rural-urban connections;
and (iii) many unskilled labor, unabsorbed by the growth in agriculture and rural non-farm activities, migrated
to urban areas and worked in labor intensive manufacturing industries such as food and beverages, textile and
garments, leather products, electronics and footwear, construction, transportation and services. These were
boomed industries and sectors during the NO era.
The increase of rural poverty during the crisis period was partly a result of returning unemployed people
from urban areas. During the 1997/98 economic crisis, many laid-off workers particularly from manufacturing
to return to their villages where subsistence could at least meet their basic needs. However, in the crisis situation
in which poverty in both urban and rural settings was on the increase, many rural originated people who became
unemployed stayed in cities and considered self-employment or do any kind of low-paid works in urban
informal sector as an option (Amin, 1998; Hugo, 1998). So no doubt that during the crisis agriculture together
with urban informal sector had played an important role as the last resort for the laid off workers from the
formal sector.
Table 7: Percentage of Population Living under Current Poverty Lines in Indonesia: 1976-2004 Poor People (%)
Year
Urban* Rural** National***
1976
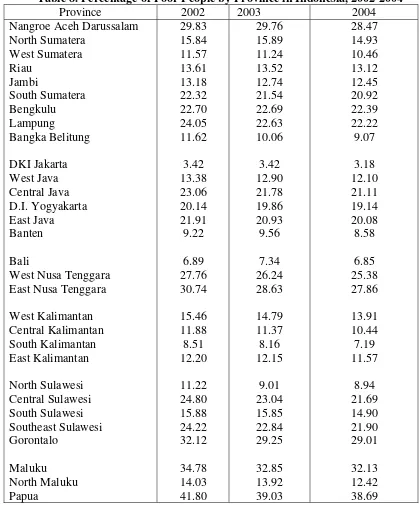
Further, Table 8 shows trends in poverty incidence at the provincial level during 2002-2004. In 2002, Papua,
Maluku, Gorontalo, East Nusa Tenggara, Nanggroe Aceh Darussalam, and West Nusa Tenggara had the highest
proportion of people living below their respectively poverty lines. This condition remained the same until 2004.
However, the trends of poverty incidence during that period indicate that the proportion of people living below
the poverty lines declined in all provinces. In Yogyakarta, the percentage of its total population being poor
Table 8. Percentage of Poor People by Province in Indonesia, 2002-2004
Province 2002 2003 2004
Nangroe Aceh Darussalam North Sumatera
West Nusa Tenggara East Nusa Tenggara
West Kalimantan Central Kalimantan South Kalimantan East Kalimantan
North Sulawesi Central Sulawesi South Sulawesi Southeast Sulawesi
Poverty as An Agricultural Phenomenon
In the Indonesian context poverty is mainly an agricultural phenomenon. That is why agricultural
development has always been the central to poverty reduction in Indonesia for two main reasons. First, although
continuously declining, it remains the largest sector in terms of employment. The National Labour Survey
(SAKERNAS) data from BPS show that in 1971, about 67% of Indonesian total working population worked in
the sector. By 2003, around 46% of the working population still worked in agriculture (Table 9). In fact, during
between 1997 and 1998 the employment share of agriculture in Indonesia increased from 40.8% to 45%
(Feridhanusetyawan, 1999). The pattern of change in employment distribution by sector in Indonesia is also
observable in other important agricultural based economies in Southeast Asia such as China, Vietnam and
Thailand, where other sectors particularly industry manufacturing, construction and services become
increasingly important for employment generation (Figure 3).
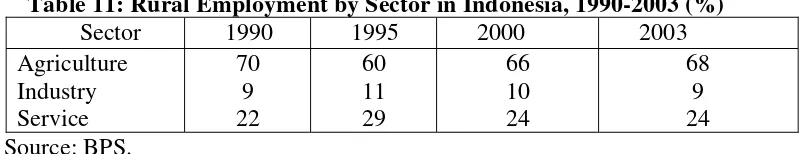
Table 9: Employment by Sector in Indonesia, 1990-2003 (%)
Sector 1971 1980 1985 1990 1995 2000 2003
Agriculture
1985 1990 1995 2000 2003
Indonesia
The majority of workforce in Indonesia still finds employment in rural areas. In 1990, about 75% of
Indonesian total workforce worked in rural areas and declined to around 60% in 2003 (Table 10). The largest
part of rural workers was found in the agricultural sector, although the proportion has declined substantially
during the pre-1997-1998 economic crisis period from 75% in 1990 to 60% in 1995. After the onset the crisis,
however, the role of this sector in providing employment opportunities in rural areas regained its importance. In
2003, the proportion of rural workforce absorbed by the agricultural sector has increased again to 68% (Table
Table 11: Rural Employment by Sector in Indonesia, 1990-2003 (%)
Sector 1990 1995 2000 2003
Agriculture Industry Service
70 9 22
60 11 29
66 10 24
68 9 24 Source: BPS.
Consistent with the employment data, a large fraction of Indonesian households particularly in rural areas,
derive their income from agriculture, either as a sole income source or in combination with other sources. Based
on the Intercensal Population Survey (SUPAS) data from BPS in 1995, Table 12 shows that nationally, almost
25% and 23% of all households, respectively, have derived their incomes wholly and partly from the sector. In
rural areas, 72.6% of total households derived at least part of their incomes from the sector.
Table 12: Household Income Sources in Indonesia, 1995 (%)
Income source National Rural Urban
Wholly:
- Agriculture - Non-agriculture Combination
- Mainly agriculture - Mainly non-agriculture
24.9 52.5 22.6 9.9 12.7
46.3 27.4 26.3 13.2 13.1
6.0 84.0 10.0 2.6 7.4 Source: BPS.
Second, the agricultural sector has the highest poverty incidence compared to other sectors and contributes
the largest proportion of the poor in the country. Based on SUSENAS data on distribution of poor families by
main occupations/income source, Table 13 shows the distribution of poor families by sector for the period
1996-2002. Further, Table 14 shows that almost 70% of the poor in rural areas work in agriculture. Even for
urban poor, agriculture is very important as their main source of income. Semi-subsistence urban farming is
widely believed to make an important contribution to the livelihoods of the urban poor in many developing
countries.2Urban agriculture can encompass aquaculture in tanks, ponds, rivers and coastal bays; livestock
(particularly micro-livestock) raised in backyards, along roadsides, in poultry sheds and piggeries; orchards,
street trees, and backyard trees; and vegetable and other crop production on roof tops, in backyards, in vacant
tracts of land on industrial estates, along canals, on the grounds of institutions, on roadsides and in many
peri-urban and peri-urban farms (Gordon, et al., 2000).
2
Table 13: Distribution of Poor Families by Main Occupations/Income Sources, 1996-2002 (%)
Table 14: Distribution of Poor Families by Sector and Area: 2002 (%)
Sector Urban Rural
Agriculture
The meaning of the above shown evidence is that the impact of the earthquake on poverty in Yogyakarta
and Central Java in particular or in Indonesia in general depends much on its effect on production process in
agriculture, and hence on incomes of farm households. There is no information so far indicating that overall
production activity in the agricultural sector in Yogyakarta and Central Java has been hit seriously by the
earthquake; although some local news papers reported about some reductions in production volume experienced
by some individual farmers soon after the tragedy.
References
Altenburg, T., and J. Meyer-Stamer (1999). “How to Promote Clusters: Policy Experiences from Latin America,” World Development, 27(9), 1213–1230.
Amin, A.T.M. Nurul (1998), ‘The Urban Informal Sector in Indonesia: through the economic recession and recovery’, ARTEP Working Papers, No.2, New Delhi: ILO.
Feridhanusetyawan, Tubagus (1999), “The Impact of the Crisis on the Labor Market in Indonesia”, Report for the Asian Development Bank, Jakarta: CSIS.
Gordon, Ann, Junior Davis, Andrew Long and Kate Meadows (2000), ‘The Role of Natural Resources in the Livelihoods of the Urban Poor’, Policy Series 9, Social Sciences Department, Natural Resources Institute University of Greenwich.
Hugo, Graeme (1998), ‘Some comments on the Employment Consequences of the Currency Crisis in Indonesia’, unpublished manuscript, Jakarta: ILO Office.
Sandee, H., and J. ter Wingel (2002), “SME Cluster Development Strategies in Indonesia: What Can We Learn from Successful Clusters?” paper presented for JICA Workshop on Strengthening Capacity of SME Clusters in Indonesia, Jakarta, March 5–6.
Sanyal, B. (1985), ‘Urban agriculture: who cultivates and why? Food and Nutrition Bulletin, 7: 15–24.
Schiller, J., and B. Martin-Schiller (1997), “Market, Culture and State in the Emergence of Indonesian Export Furniture Industry,” Journal of Asian Business, 13(1), 101-16
Tambunan, Tulus T.H. (2006), Development of Small & Medium Enterprises in Indonesia from the Asia-Pacific Perspective, Jakarta” LPFE-Usakti.
![Figure 3: Shares of Total Employed Workers in Agriculture in Selected Southeast Asian Countries [%]: 1985-2003](https://thumb-ap.123doks.com/thumbv2/123dok/1108407.884196/13.612.76.508.340.466/figure-shares-employed-workers-agriculture-selected-southeast-countries.webp)