F I R S T Q U A R T E R O F 2 0 1 7 R E S U L T S ( U N A U D I T E D )
TICKERS: IDX : TLKM NYSE : TLK
SHAREHOLDER COMPOSITION: Government of Indonesia : 52.1% Public : 47.9%
Excl. Treasury stock : 1,737,779,800 shares.
Investor Relations
PT Telkom Indonesia (Persero) Tbk Graha Merah Putih, 5th Floor Jl. Gatot Subroto Kav. 52, Jakarta 12710 Phone : 62 21 5215109
Fax : 62 21 5220500 Email : [email protected] Website : www.telkom.co.id
DISCLAIMER
This document contains financial conditions and result of operation, and may also contain certain projections, plans, strategies, and objectives of the Company, which would be treated as forward looking statements within the meaning of applicable law. Forward looking statements, by their nature, involve risk and uncertainty that could cause actual results and development to differ materially from those expressed or implied in these statements. Telkom Indonesia does not guarantee that any action, which may have been taken in reliance on this document, will bring specific results as expected.
Highlights
Telkom Indonesia continued its strong momentum by delivering remarkable performance in 1Q17, recorded triple-double-digit growth in Revenue, EBITDA, and Net Income of 12.6%, 14.7%, and 45.8% YoY, respectively.
Data, Internet & IT Services segment remained the growth driver which increased by 25.4% YoY. The segment contributed 41.6% to total Revenue.
Telkomsel remained focus on growing digital business, installing 7,060 new BTSs during the year, all of which were 3G/4G BTS.
Financial Highlights
TLKM Share Performance YTD 2017
Share Price (April 21, 2017):
Rp4,420 (IDX) & USD32.55 (NYSE)
Market Capitalization (April 21, 2017): Rp445.5 Tn (USD32.8 Bn)
Average Daily Trading Volume 2017: 74.9 Mn Shares (IDX) & 365,143 DR (NYSE)
Average Daily Trading Value 2017:
Rp299.9 Bn (IDX) & USD10.8 Mn (NYSE)
Revenues 31,022 27,542 12.6
Expenses 18,531 17,970 3.1
Operating Profit 12,491 9,572 30.5
EBITDA 16,809 14,655 14.7
Telkomsel Flash 68,994 43,843 57.4
2
PT TELKOM INDONESIA (PERSERO) Tbk
FIRST QUARTER OF 2017 (UNAUDITED)
The following analysis and discussion is based on our Indonesian GAAP financial statements for the first quarter ended March 31, 2017 and 2016. The reports have been submitted to Indonesia Financial Services Authority (OJK).
Revenues
Key Indicators
(Rp.Bn) 1Q17 1Q16 YoY Growth (%)
Cellular Voice and SMS 12,995 12,882 0.9
Data, Internet & IT Service 12,917 10,301 25.4
Fixed Line Voice 1,866 1,945 (4.1)
Interconnection 1,270 1,082 17.4
Network and Other Telco Services 1,974 1,332 48.2
Total 31,022 27,542 12.6
Telkom recorded total revenue of Rp31.0trillion in 2017, an increase of 12.6% YoY with Data, Internet & IT
Services as the growth driver. The details are as follows:
Cellular Voice and SMS revenues increased slightly by 0.9% YoY as we were able to manage pricing
strategy and migrate SMS and voice PAYU customers to various attractive packages, that compensate the decline in SMS and voice traffic.
Data, Internet & IT Services revenues increased significantly by 25.4% YoY primarily attributable to strong mobile and fixed (IndiHome) broadband services. Mobile data traffic (payload) increased by 115.5%, while IndiHome continued to add new customers as well as increase its ARPU.
Fixed Line Voice revenues decreased by 4.1% YoY due to cannibalization from mobile services that
resulted in decline in fixed-line traffic.
Interconnection revenues increased by 17.4% YoY due to higher incoming voice call.
Network and Other Telecommunication Services revenues grew by 48.2% YoY mainly due to
increase in managed service business.
3
Expenses
Key Indicators
(Rp. Bn)
YoY
1Q17 1Q16 Growth (%)
Operation, Maintenance & Telecommunication Services 8,298 7,651 8.5
Personnel 2,977 2,999 (0.7)
Interconnection 727 784 (7.3)
Marketing 985 752 31.0
General & Administrative 1,226 701 74.9
Depreciation & Amortization 4,773 4,405 8.4
(Gain)/Loss on Forex – net 50 114 (56.1)
Others – net (505) 564 (189.5)
Total 18,531 17,970 3.1
Total Expenses increased by 3.1% YoY, with Operating Expenses rose by 10.3% YoY, lower than revenue growth which reflected our operational efficiency. Details of Expenses are as follows:
Operation & Maintenance (“O&M”) expenses increased by 8.5% YoY as we continuously developed broadband infrastructure in an effort to grow digital business both in cellular and fixed-line services.
Personnel expenses decreased by 0.7% YoY since in 1Q16 there was additional incentive due to strong 2015 results.
Interconnection expenses declined by 7.3% YoY mainly attributable to lower outgoing voice and SMS
traffic.
Marketing expenses increased by 31.0% YoY primarily due to aggressive promotion of 4G LTE in mobile and IndiHome in fixed line.
General & Administrative expenses increased by 74.9% YoY mainly due to higher provision for accounts receivable.
Depreciation & Amortization expenses grew by 8.4% in line with the network infrastructure development both in mobile and fixed businesses.
Net Forex Loss was relatively small of Rp50 billion reflecting that Telkom is less exposed to foreign currency fluctuation.
EBITDA, EBITDA Margin, and Net Income
As a result of manageable operating expenses, EBITDA increased by 14.7% YoY to Rp16.8 trillion with EBITDA margin improved to 54.2% from 53.2% last year. While our Net Income sharply increased by 45.8% YoY to Rp6.7 trillion with strong Net Income margin of 21.6%, improved from 16.7% in 1Q16.
4
Financial Position
Key Indicators (Rp.Bn)
YTD
1Q17 FY16 Growth (%)
Assets 187,590 179,611 4.4
Liabilities 75,133 74,067 1.4
Non-controlling Interests 21,380 21,160 1.0
Equity attributable to owners of the company 91,077 84,384 7.9
Total assets as of 31 March 2017 reached Rp187.6 trillion, increased by 4.4% mainly due to increase in
cash & cash equivalents and accounts receivables in line with strong sales.
Total liabilities at end of March 2017 increased 1.4% to Rp75.1 trillion mainly attributed to higher accrued
expenses and taxes payable.
Non-controlling interest increased by 1.0% due to improving subsidiaries’ performance.
Our equity increased by 7.9% due to higher retained earnings as a result of strong performance during
the first quarter of 2017.
Cash Flows
Key Indicators (Rp. Bn) YoY
1Q17 1Q16 Growth (%)
Cash Flow from Operating Activities 13,070 13,143 (0.6)
Cash Flow used in Investing Activities (6,540) (5,582) 17.2
Cash Flow used in Financing Activities (2,570) 314 918.5
Net Increase in Cash & Cash Equivalents 3,960 7,875 (49.7)
Effect of Exchange Rate Changes on Cash & Cash Equivalents (28) (254) (89.0)
Cash & Cash Equivalents at Beginning of Year 29,767 28,116 5.9
Cash & Cash Equivalents at End of Period 33,699 35,737 (5.7)
Net cash provided by operating activities decreased by 0.6% YoY due to higher cash payment for
expenses during the period.
Net cash used in investing activities increased by 17.2% YoY in line with acquisition of fixed assets in
an effort to grow our digital business in cellular and fixed services.
Net cash used in financing activities increased by 918.5% YoY mainly due to payment of dividend to
5
Debts
Currencies (Rp.Bn)
YTD Portion (%)
1Q17 FY16 Growth (%) 1Q17 FY16
IDR/Rupiah 26,219 26,091 0.5 94.1 93.9
USD/US Dollar 910 991 (8.2) 3.3 3.6
JPY/Japanese Yen 732 707 3.5 2.6 2.5
Total 27,861 27,789 0.3 100.0 100.0
At the end of March 2017, total debts amounting to Rp27.9 trillion, increased by 0.3% compared to the end of 2016. Around 94.1% of our debt was in Rupiah currency, 3.3% was in US Dollar currency and the balance was in Japanese Yen, consisting of short and long-term Bank Loans, Bonds and Two-Step Loans. Our debt to equity ratio (“DER”) was still relatively low at 30.6%.
Financial Ratios
Ratios (%)
YoY
1Q17 1Q16 Growth (ppt)
EBIT Margin 40.3 34.8 5.5
EBITDA Margin 54.2 53.2 1.0
Net Income Margin 21.6 16.7 4.9
Current Ratio 133.3 148.2 14.9
Total Liabilities to Equity 82.5 96.3 (13.8)
Return on Assets 14.3 10.4 3.9
Return on Equity 29.4 23.0 6.4
Return on Invested Capital 22.5 16.7 5.8
Gearing
Key Indicators YTD
1Q17 FY16 Growth (ppt)
Net Debt to Equity (%) (6.4) (2.3) (4.1)
Debt to Equity (%) 30.6 32.9 (2.3)
Debt to EBITDA (%) 41.4 46.7 (5.3)
Debt Service Ratio (Times) 9.3 7.8 1.5
Capital Expenditure
6
Mobile Services
Telkomsel Financial Result
Telkomsel continued its strong performance for the first quarter of 2017 by delivering triple-double-digit growth in Revenues, EBITDA and Net Income of 10.4%, 13.0% and 17.8% YoY, respectively. This solid performance was contributed by transformation initiatives in Digital Business as the engine of growth and continuous effort in maintaining performance in Legacy businesses. Revenues grew 10.4% to Rp22,302 billion supported by Digital Business which posted 22.5% YoY growth, driven by Data which increased by 21.3% YoY and Digital Services which increased by 34.8% YoY. Digital Business accounted for 37.7% of total revenues, increased from 34.0% a year ago. We were able to sustain our Legacy business despite Over the Top (OTT) cannibalization to SMS, which grew by 4.2% YoY (Voice +11.1% and SMS -15.1% YoY) due to successful execution of cluster-based pricing, market segmentation and superior network. EBITDA and Net Income margins were higher by 1.4ppt and 2.2ppt to 59.2% and 34.5%, respectively.
Despite its saturated market, Telkomsel was able to have a healthy growth in subscriber base of 10.3% YoY to 169.4 million attributable to effective sales and marketing programs. In line with our philosophy to lead in network supply and grow Digital Business, we deployed 7,060 new BTS during first quarter of 2017 with all of BTS were 3G and 4G BTS. Our data traffic increased by 115.5% to 365,959 TB mainly fueled by high growth in 3G/4G capable device that reached 83.8 million (+29.9% YoY), or 49.5% of our customer base. In terms of infrastructure, by end of March 2017 our BTS on-air totaled to 136,093 units (+23.1% YoY), 63.4% of which were 3G/4G BTS.
Statements of Profit and Loss
Financial Performance
(Rp. Bn) 1Q17 YoY 1Q16 Growth (%) 1Q17 QoQ 4Q16 Growth (%)
Revenues 22,302 20,196 10.4 22,302 23,076 (3.4)
Legacy 13,884 13,325 4.2 13,884 14,589 (4.8)
Digital Business 8,419 6,871 22.5 8,419 8,488 (0.8)
Expenses incl. Depreciation & others 12,292 11,675 5.3 12,292 13,694 (10.2)
EBITDA 13,194 11,673 13.0 13,194 12,649 4.3
EBITDA Margin (%) 59.2 57.8 1.4ppt 59.2 54.8 4.3ppt
Net Income 7,702 6,539 17.8 7,702 7,169 7.4
Net Income Margin (%) 34.5 32.4 2.2ppt 34.5 31.1 3.5ppt
Proportion of Digital Business (%) 37.7 34.0 3.7ppt 37.7 36.8 1.0ppt
Telkomsel recorded operating revenues of Rp22,302 billion for 1Q17, an increase of 10.4% YoY.
Prepaid revenue increased by 9.4% YoY to Rp18,984 billion, mainly driven by growth in Digital
Business and voice revenues. Its subscriber base grew by 10.2% YoY to 165.2 million subscribers, with revenue accounted for 85.1% of Telkomsel’s total revenue.
Postpaid revenue increased by 13.5% YoY to Rp1,675 billion mainly driven by the increase in the
7
Interconnection and International Roaming revenues increased by 17.8% YoY to Rp1,422 billion, due to
traffic from other operators.
In 1Q17, total expenses including depreciation and amortization increased by 5.3% YoY to Rp12,292 billion, lower than revenue growth of 10.4%, indicating Telkomsel operational efficiency. The growth was mainly driven by few activities, firstly from Operational & Maintenance expenses as company’s accelerated network deployment to maintain network quality, resulted in higher transmission and network space rental costs. In additional, Marketing expenses increased due to promotion of our 4G LTE program across the country as well as general marketing and sales activities. And lastly, personnel expenses growth that is aligned with increase in number of employees as well as salaries and benefit.
EBITDA and Net Income increased 13.0% YoY to Rp13,194 billion and 17.8% YoY to Rp7,702 billion, respectively, while EBITDA and Net Income margins improved to 59.2% and 34.5%, respectively.
Statements of Financial Position
Statements of Financial Position (Rp Bn) Mar-17 Dec-16 Growth (%)
Current Assets 32,025 28,818 11.1
Non-Current Assets 60,833 60,963 (0.2)
Total Assets 92,858 89,781 3.4
Current Liabilities 24,230 21,891 10.7
Non-Current Liabilities 8,549 8,520 0.3
Equity 60,079 59,370 1.2
Total Liabilities & Stockholders’ Equity 92,858 89,781 3.4
As of 31 March 2017, total Assets increased 3.4% to Rp92,858 billion, total liabilities increased 7.8% to Rp32,779 billion and total Equity increased 1.2% to Rp60,079 billion.
Current Assets increased 11.1% to Rp32,025 billion, mainly due to increase in cash and cash
equivalents.
Non-current Assets decreased 0.2% to Rp60,833 billion, mainly due to lower intangible assets.
Current Liabilities increased 10.7% to Rp24,230 billion mainly due to the increase in accrued liabilities.
Non-current Liabilities increased 0.3% to Rp8,549 billion, mainly due to the increase in deferred tax liabilities.
Total Equity increased by 1.2% to Rp60,079 billion due to additional retained earnings as a result of the
higher net income in this period.
Cash Flow
8
Statements of Cash Flows
For Three Months Ended March 31, 2017 and 2016
Statements of Cash Flows (Rp Bn) 1Q17 1Q16 Growth (%)
Cash Flow from Operating Activities 12,613 12,776 (1.3)
Cash Flow for Investing Activities (2,764) (2,274) 21.6
Cash Flow from (for) Financing Activities (172) (268) (36.1)
Dividend Payment (6,749) - N/A
Net Increase in Cash & Cash Equivalents 2,929 10,233 (71.4)
Cash and Cash Equivalents at Beginning of Years 19,681 13,802 42.6
Cash and Cash Equivalents at End of Years 22,611 24,036 (5.9)
Debt Profile
As of 31 March 2017, Telkomsel’s total outstanding loans amounted to Rp1,000 billion which will mature in 2018. Telkomsel Debt to Equity Ratio (DER), including finance lease, was 10.3%.
Telkomsel has to maintain several financial covenants related to its loans/debts. As of 31 March 2017 the covenants were as follows:
Covenants to be Maintained Required Actual
EBITDA to Debt Service ≥1.25 9.80
Debt to Tangible Net Worth ≤2.00 0.02
RESULTS BY SERVICE
Celullar Services
Voice and SMS
We were able to sustain healthy revenue growth from voice, which increased by 11.1% YoY to Rp10,060 billion, despite the decline of Voice traffic (-16.1% YoY to 52.4 billion minutes). The healthy growth in voice revenue mainly attributed by our initiative in dynamic cluster based pricing and successful migration from Pay As You Use (PAYU) to package customers.
On the other hand, revenue from SMS declined by -15.1% YoY to Rp2,843 billion due to the decline in SMS traffic (-21.0% YoY to 38.2 billion units) as we have seen trend of OTT services cannibalization such as instant messaging applications.
Digital Business
Digital business remained one of engine of growth. This segment recorded strong performance with 22.5% YoY growth to Rp8,419 billion and increased its contribution to total revenue substantially to 37.7% from 34.0% last year.
9
Digital Services also grew strongly by 34.8% YoY to Rp835 billion. Key products and services in this segment included Digital Lifestyle (scale up video, games & market place, music, etc.), Digital Banking and Advertising, Mobile Financial Services (Cash and Wallet) and Enterprise Digital Services (Drive, T-Bike, etc.).
Network Deployment
Our focus on Digital Business was reflected from our network deployment. We continued to accelerate our network development with aggressive 3G/4G BTS deployment to support Digital Business growth. Our 4G LTE deployment is on-demand basis, taking into account 4G handset penetration and level of demand in Broadband cities. We have deployed 11,130 4G BTS to date. The network roll out brought total BTS on air to 136,093 units at end of March 2017, or increased by 23.1% YoY, of which 86,320 units were 3G/4G BTS (+40.6% YoY).
ARPU
As we are shifting from legacy business to digital business, blended ARPU might experience a slight decline. It is due to the impact of cannibalization OTT on SMS as well as the impact of competition. However, our Data ARPU grew by double digit due to increase in 3G/4G capable device penetration as well as strong growth in data payload.
The following table presents performance of our cellular business:
Operational Indicators YoY QoQ
1Q17 1Q16 Growth (%) 1Q17 4Q16 Growth (%)
Customer Base (000) 169,368 153,614 10.3 169,368 173,920 (2.6)
Net Adds (000) (4,552) 973 (567.9) (4,552) 10,220 (144.5)
3G/4G Capable Device (000) 83,793 64,506 29.9 83,793 82,647 1.4
ARPU (000) 43 43 (0.4) 43 45 (5.2)
BTS on Air (units) 136,093 110,512 23.1 136,093 129,033 5.5
Total Employees 5,149 4,878 5.6 5,149 5,191 (0.8)
MoU (In billion minutes) 52.4 62.5 (16.1) 52.4 55.5 (5.5)
SMS (In billion units) 38.2 48.3 (21.0) 38.2 41.6 (8.2)
10
Fixed Line Services
Consumer Services - IndiHome
As of 31 March 2017, total IndiHome subscribers reached 1.78 million which represents a 32% YoY growth. IndiHome Netizen, a Dual Play (2P) service that we launched in December 2016, revealed strong traction that contributed around 12% of total subscribers in only four months after it was launched. We expect IndiHome Netizen customers to continue growing significantly going forward on top of our 3P product.
ARPU of IndiHome in 1Q17 was Rp357 thousand, improved from Rp341 thousand in the last quarter of 2016. In order to improve IndiHome ARPU level, we encouraged customers to purchase various add-ons or to upgrade to higher speed services. In addition, we keep enriching IndiHome content. Starting 1Q17, a video streaming platform, HOOQ, is in our list to further strengthen IndiHome content.
Enterprise, Wholesale and International Services
Telkom also delivers fixed line services to enterprise and wholesale business segments. Enterprise division serves 1,453 corporate customers, 300,416 SME customers and 944 government institutions, with 2,759Gbps total bandwidth in service.
While in the wholesale and international business segment, Telkom provides various services from connectivity, infrastructure, MNO & MVNO, tower, data center to satellite. We also develop several cross-border wholesale digital services within Telkom’s international business subsidiaries.
Satellite
After successfully launched on 15 February 2017 from Kourou, French Guiana, Telkom 3S Satellite was officially operated. The satellite is managed from Telkom Satellite Main Control Station in Cibinong starting 17 April 2017. Telkom 3S has total capacity of 42 transponders and covers all regions of Indonesia, Southeast Asia, as well as parts of East Asia.
Meanwhile, Telkom-4 Satellite is planned to be launched in 3Q18. It will carry 48 C-Band and 12 extended C-Band transponders and covers Southeast Asia and South Asia region. Currently, the progress of this project is around 53%.
Recent Development
Dividend Pay Out Ratio of 70% – The Company's Annual General Meeting of Shareholders (held on
21 April 2017) has decided to distribute a total of 70% dividend pay out for 2016 fiscal year, increased from 60% pay out for 2015 fiscal year. Telkom will distribute cash dividend of Rp11,611,211,188,567.60 or equal to 60% of net income, inclusive of interim dividend which has been paid in December 2016. In addition, the Company will distribute special dividend of Rp1,935,200,213,724.32 or equal to 10% of net income. This represents total dividend per share of Rp136.7465. The remaining Rp117.3675 dividend per share will be paid on 26 May 2017.
Change in the Board of Directors and Board of Commissioners – On 21 April 2017, the Annual
General Meeting of Shareholders (AGMS) appointed three new Board of Directors (BOD) members and defined new nomenclatures. The new BOD members are Mas'ud Khamid (formerly Sales Director of Telkomsel), David Bangun (formerly President Director of Mitratel) and Zulhelfi Abidin (formerly IT Director of Bank BRI). Below are Telkom's current BOD members and titles:
President Director : Alex J. Sinaga
11
Director of Consumers Service : Mas’ud Khamid
Director of Human Capital Management : Herdy R. Harman
Director of Network & IT Solution : Zulhelfi Abidin
Director of Digital & Strategic Portfolio : David Bangun
Director of Wholesale & International Service : Abdus Somad Arief
Director of Enterprise & Business Service : Dian Rachmawan
Moreover, in the AGMS, Mr. Pontas Tambunan was honorably discharged from his position as Commissioner. AGMS also appointed Ms Devy W. Suradji and Mr Cahyana Ahmadjayadi as new Commissioners. Therefore, current Board of Commissioners members are as follows:
President Commissioner : Hendri Saparini
Commissioner : Hadiyanto
Commissioner : Devy W. Suradji
Commissioner : Rinaldi Firmansyah
Independent Commissioner : Dolfie Othniel Fredric Palit Independent Commissioner : Margiyono Darsasumarja
Independent Commissioner : Pamiyati Pamela Johanna Waluyo Independent Commissioner : Cahyana Ahmadjayadi
Product and Marketing Activities
Fixed Line & Enterprise
IndiHome in collaboration with premium video-on-demand provider HOOQ launched a new service called
IndiHome HOOQ which provides richer video content experience for IndiHome and WiFi.id subscribers. IndiHome subscribers can now enjoy HOOQ’s various video contents from popular TV series to local and Hollywood blockbuster movies.
Mobile
Legacy business and data penetration program
In order to acquire more postpaid customers, Halo Kick! was launched as a new postpaid package with more rewards & benefits including data quota up to 140 GB, extra for Telkomsel Poin & TCASH balance and bonus content for HOOQ, viu & MusicMax. The Halo Kick! package priced starting from Rp100,000 with activation through UMB *111# or mytelkomsel application.
New package of simPATI MiFi 4G TELKOMSEL was relaunched with bonus of 14 GB at the first month. After the bonus expired, 3 different MiFi packages were available consist of Lite Package (10 GB/month at Rp75,000), Medium Package (20 GB/month at Rp125,000) and Heavy Package (30 GB/month at Rp200,000).
Acceleration on 3G/4G Device Adoption
12
ADDITIONAL INFORMATION
Awards & Recognition
During 1Q17, we have been awarded by several institutions for our achievements, among others:
Brand Finance Global 500 2017 for Telkom as the most valuable telco company in Southeast Asia with
brand value of US$4.33 billion from Brand Finance.
Indonesia Most Innovative Business Award 2017 for Telkom from Warta Ekonomi.
TOP BRAND Award 2017 in the category of Internet Service Provider Fixed for IndiHome from
Marketing Magazine and Frontier Consulting Group.
Indonesia Prestige Brand Award 2017 for Telkomsel as Brand Used Most Often & Highest Top of Mind
Brand in Mobile Phone Operator & Internet Service Provider Category from Warta Ekonomi.
Customer Loyalty Award 2017 for Telkomsel as The Net Promotor Scope (NPS) Leader for Postpaid
GSM SIM Card Category (kartuHalo) & Mobile Data Category from SWA Magazine and Hachiko Net Promoter Score Solutions.
Excellent Service Experience Award (ESEA) 2017 for Telkomsel in Telecommunication Industry
Category for GOOD Performance in Delivering Positive Customer Experience Based on Experience Audit ESEI 2017 from Bisnis Indonesia Newspaper and Carre-Center for Customer Satisfaction & Loyalty (CCSL).
Top Brand Award 2017 for kartuHalo (Postpaid SIM Card) and simPATI (Prepaid SIM Card) in
Recognition of Outstanding Achievement in Building the Top Brand from Frontier Consulting Group and Marketing Magazine.
Indonesia WOW Brand 2017 for Telkomsel in Cellular Operator Category (Gold Champion) and for The
NextDev Campaign in Public Relation Category (Gold Champion) from MarkPlus Inc.
Indonesia Netizen Brand Choice Award 2017 for TCASH in Netizen Payment Gateway Choice from
13
Table 1
PERUSAHAAN PERSEROAN (PERSERO)
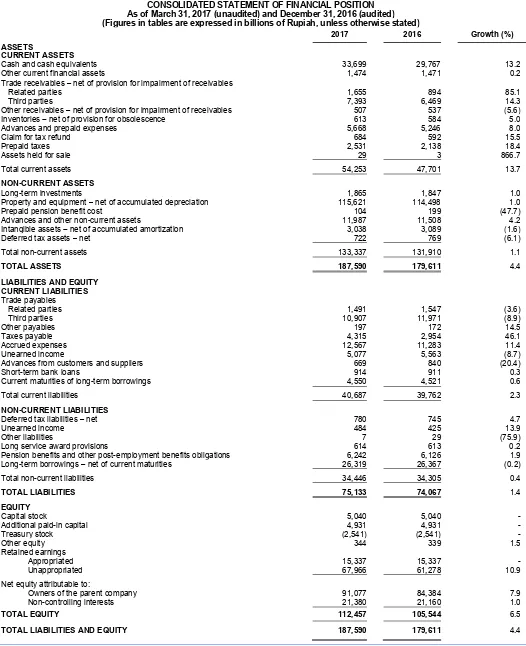
PT TELEKOMUNIKASI INDONESIA Tbk AND SUBSIDIARIES CONSOLIDATED STATEMENT OF FINANCIAL POSITION As of March 31, 2017 (unaudited) and December 31, 2016 (audited) (Figures in tables are expressed in billions of Rupiah, unless otherwise stated)
2017 2016 Growth (%) ASSETS
CURRENT ASSETS
Cash and cash equivalents 33,699 29,767 13.2
Other current financial assets 1,474 1,471 0.2
Trade receivables – net of provision for impairment of receivables
Related parties 1,655 894 85.1
Third parties 7,393 6,469 14.3
Other receivables – net of provision for impairment of receivables 507 537 (5.6)
Inventories – net of provision for obsolescence 613 584 5.0
Advances and prepaid expenses 5,668 5,246 8.0
Claim for tax refund 684 592 15.5
Prepaid taxes 2,531 2,138 18.4
Assets held for sale 29 3 866.7
Total current assets 54,253 47,701 13.7
NON-CURRENT ASSETS
Long-term investments 1,865 1,847 1.0
Property and equipment – net of accumulated depreciation 115,621 114,498 1.0
Prepaid pension benefit cost 104 199 (47.7)
Advances and other non-current assets 11,987 11,508 4.2
Intangible assets – net of accumulated amortization 3,038 3,089 (1.6)
Deferred tax assets – net 722 769 (6.1)
Total non-current assets 133,337 131,910 1.1
TOTAL ASSETS 187,590 179,611 4.4
LIABILITIES AND EQUITY
Accrued expenses 12,567 11,283 11.4
Unearned income 5,077 5,563 (8.7)
Advances from customers and suppliers 669 840 (20.4)
Short-term bank loans 914 911 0.3
Current maturities of long-term borrowings 4,550 4,521 0.6
Total current liabilities 40,687 39,762 2.3
NON-CURRENT LIABILITIES
Deferred tax liabilities – net 780 745 4.7
Unearned income 484 425 13.9
Other liabilities 7 29 (75.9)
Long service award provisions 614 613 0.2
Pension benefits and other post-employment benefits obligations 6,242 6,126 1.9
Long-term borrowings – net of current maturities 26,319 26,367 (0.2)
Total non-current liabilities 34,446 34,305 0.4
TOTAL LIABILITIES 75,133 74,067 1.4
EQUITY
Capital stock 5,040 5,040
-Additional paid-in capital 4,931 4,931
-Treasury stock (2,541) (2,541)
14
Table 2
PERUSAHAAN PERSEROAN (PERSERO)
PT TELEKOMUNIKASI INDONESIA Tbk AND SUBSIDIARIES
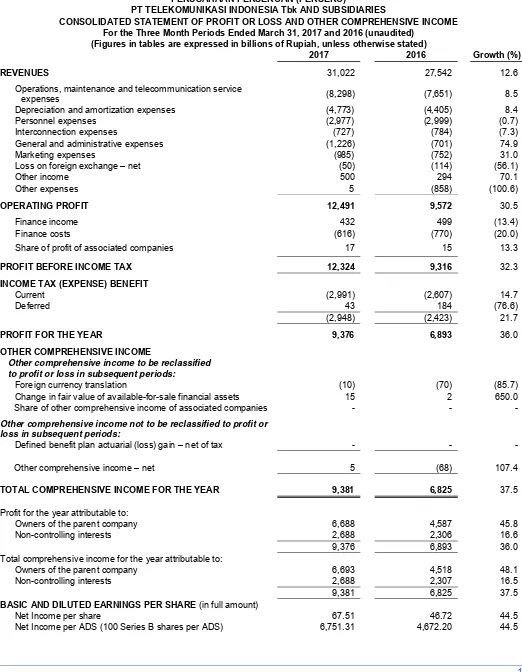
CONSOLIDATED STATEMENT OF PROFIT OR LOSS AND OTHER COMPREHENSIVE INCOME For the Three Month Periods Ended March 31, 2017 and 2016 (unaudited)
(Figures in tables are expressed in billions of Rupiah, unless otherwise stated)
2017 2016 Growth (%)
REVENUES 31,022 27,542 12.6
Operations, maintenance and telecommunication service
expenses (8,298) (7,651) 8.5
Other comprehensive income not to be reclassified to profit or
loss in subsequent periods:
Defined benefit plan actuarial (loss) gain – net of tax - - -
Other comprehensive income – net 5 (68) 107.4
TOTAL COMPREHENSIVE INCOME FOR THE YEAR 9,381 6,825 37.5
15
Table 3
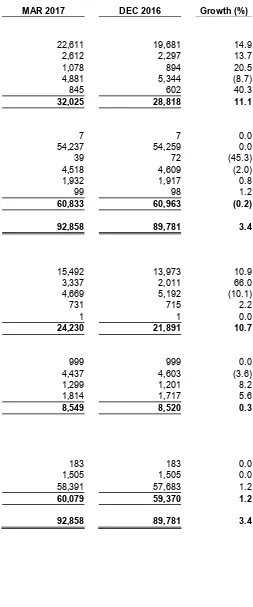
PT TELEKOMUNIKASI SELULAR (TELKOMSEL) STATEMENTS OF FINANCIAL POSITION
AS OF MARCH 31, 2017 (UNAUDITED) WITH COMPARATIVE FIGURES AS OF DECEMBER 31, 2016 (AUDITED)
(figures are presented in billions of Rupiah)
Accrued income 1,078 894 20.5
Current portion of long-term prepayments 4,881 5,344 (8.7)
Others 845 602 40.3
Total Current Assets 32,025 28,818 11.1
NON-CURRENT ASSETS
Total Non-current Assets 60,833 60,963 (0.2)
TOTAL ASSETS 92,858 89,781 3.4
LIABILITIES AND EQUITY CURRENT LIABILITIES
Accounts payable & accrued liabilities 15,492 13,973 10.9
Taxes payable 3,337 2,011 66.0
Unearned revenue 4,669 5,192 (10.1)
Current maturities of oblig. under finance leases 731 715 2.2
Other current liabilities 1 1 0.0
Total Current Liabilities 24,230 21,891 10.7
NON-CURRENT LIABILITIES
Medium-term & long-term loans - net of current maturities 999 999 0.0
Obligations under finance lease - net of current maturities 4,437 4,603 (3.6)
Deferred tax liabilities 1,299 1,201 8.2
Others 1,814 1,717 5.6
Total Non-current Liabilities 8,549 8,520 0.3
EQUITY
16
Table 4
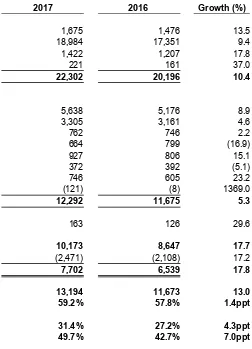
PT TELEKOMUNIKASI SELULAR (TELKOMSEL) STATEMENTS OF PROFIT AND LOSS
FOR THREE MONTHS ENDED MARCH 31, 2017 AND 2016 (UNAUDITED)
(figures in tables are presented in billions of Rupiah)
2017 2016 Growth (%)
REVENUES
Postpaid 1,675 1,476 13.5
Prepaid 18,984 17,351 9.4
Interconnection & international roaming 1,422 1,207 17.8
Others 221 161 37.0
Total Revenues 22,302 20,196 10.4
EXPENSES
Operation & maintenance 5,638 5,176 8.9
Depreciation & amortization 3,305 3,161 4.6
Cost of services 762 746 2.2
Interconnection & international roaming 664 799 (16.9)
Personnel 927 806 15.1
General & administration 372 392 (5.1)
Marketing 746 605 23.2
Others - net (121) (8) 1369.0
Total Expenses 12,292 11,675 5.3
Finance income (charges) - net 163 126 29.6
INCOME BEFORE TAX 10,173 8,647 17.7
INCOME TAX EXPENSE (2,471) (2,108) 17.2
NET INCOME 7,702 6,539 17.8
EBITDA 13,194 11,673 13.0
EBITDA Margin- over revenues 59.2% 57.8% 1.4ppt
ROA 31.4% 27.2% 4.3ppt
ROE 49.7% 42.7% 7.0ppt