Voice Verification System
Based on Bark-Frequency Cepstral Coefficient
Karisma Trinanda Putra
Department of Electrical Engineering, Faculty of Engineering, Universitas Muhammadiyah Yogyakarta
Kampus Terpadu UMY, Jl. Lingkar Selatan, Kasihan, Bantul, Yogyakarta 55183 e-mail: [email protected]
Abstract – Data verification systems evolve towards a more natural system using biometric media. In daily interactions, human use voice as a tool to communicate with others. Voice charactheristic is also used as a tool to identify subjects who are speaking. The problem is that background noise and signal characteristics of each person which is unique, cause speaker classification process becomes more complex. To identify the speaker, we need to understand the speech signal feature extraction process. We developed the technology to extract voice characteristics of each speaker based on spectral analysis. This research is useful for the development of biometric-based security application. At first, the voice signal will be separated by a pause signal using voice activity detection. Then the voice characteristic will be extracted using a bark-frequency cepstral coefficient. Set of cepstral will be classified according to the speaker, using artificial neural network. The accuracy reached about 82% in voice recognition process with 10 speakers, meanwhile, the highest accuracy was 93% with only 1 speaker.
Keywords: artificial neural network, bark-frequency cepstral coefficient, voice activity detection
I.
Introduction
Human interaction system consists of two parts: identifying the opponent and convey information. Humans have several ways to interact such as eye contact, body language and voice. The most often used by humans is by voice. Human beings have complex assets to speak, include reproductive voice organ, the auditory organs and the brain as an organ of information processing. With the voice, information can be delivered with more detail. The information can be consist of the content and/or who the speaker is. This research aims to develop artificial intelligence technology that can recognize and identify the speaker. The theme of this research is a voice-based verification system which is implemented using a pascal programming language. The voice signal is an analog signal that requires further processing such as signal feature extraction
and pattern recognition [1]. At first, the sound signal is separated from the pause signal (silence) using voice activity detection. Then the signal characteristics extracted using bark-frequency cepstral coefficients. This system emulates the human auditory system by analyzing the frequency spectrum into several specific spectral filter. An artificial neural network (ANN) will be used in the identification process based its cepstral. ANN is a group of network processing unit that can model something based on human neural network system. ANN is able to process non-linear statistical data. ANN will provide a statistical assessment of voice signal with data trained before.
This study will contribute to the development of
human-machine interaction system.
II.
Related Work
Smart machine is a machine that can understand about the task based on the command given. The machine must have a user interface that allows users to interact with it. By nature, humans interact and recognize his opponent by using visual sensing and vocals. Both have different characteristics and result.
Visual sensing system is the translation of analog signals in the form of light that reflects the shape of an object by a machine. To bring an attractive interface, a machine equipped with a camera for detecting biometric features of the users such as face [2] and the form of the iris [3]. Visually, translation command requires special handling because the technology is highly dependent on the lighting, depth of image and object detection [4]. In certain cases such as the translation of complex commands, visual sensing system will meet its limits. The use of visual sensing as interface has a weakness, especially on accuracy are greatly affected by environmental conditions [5].
Vocal-based sensing system allows machines to understand the variation of sound provided by the user. Voice recognition system will process voice signals into data and translate it into appropriate speaker. Voice recognition has many variations of use such as translating voice command [6], controlling mobile robot [7] and industrial robots [8].
In general, the voice recognition system is divided into two processes, includes feature extraction and pattern recognition. The purpose of feature extraction is to represent the characteristics of the speech signal by its cepstral. Cepstral represent local spectral properties of the signal for analysis frame. Mel-frequency cepstral coefficients (MFCC) and bark-frequency cepstral coefficients (BFCC) become candidates for spectral analysis. BFCC relatively produce better results than MFCC in noise handling and spectral distortion [9]. Meanwhile artificial neural network is used to identify the cepstral patterns. ANN produces better recognition accuracy rather than existing methods [10].
III.
The Proposed Method
The proposed system consists of two blocks subsystem that includes feature extraction and artificial neural network block. Voice feature extraction recognize the voice signal as a set of cepstral. This subsystem utilize bark-frequency cepstral coefficients as a method of voice signal feature extraction. Then, ANN used to classify the signal characteristics in accordance with the related speaker. signal characteristic reflect the differences in the spoken sounds. Therefore, short-time spectral analysis can be used to characterize the sound signal. In this study, BFCC is used as a method to extract voice signal.
A signal sounds coming out of the system caused by the excitation input and also the response of the system. From the viewpoint of signal processing, the output of the system can be treated as an input to the convolution of the excitation system response. Sometimes in the process of learning and signal processing, each component should be separated. The process of separating the two components referred to as deconvolution.
Voice Activity Detection
Dialogue consists of excitation source and the vocal tract system components. To analyze the speech signal, the excitation and system models of speech components must be separated. The purpose of this analysis is to separate cepstral of the source and system components without any special knowledge about the source and / or the system. According to the theory of speech production sources, the speech signal is generated can be regarded as a sequence of convolution models excitation and vocal tract filter characteristics. If e(n) is the excitation sequence and h(n) is a sequence of vocal tract filter, the speech s(n) can be expressed as follows.
s(n) = e(n) × h(n) (1)
From Equation (1), the magnitude of the speech spectrum can be represented as:
S(φ) =E(ω) × H(ω) (2)
To combine linearly E (ω) and H (ω) in the
frequency domain, logarithmic representation is used. So the logarithmic representation of Equation (2) will be written as:
log |S(φ)| = log |E(ω)| + log |H(ω)| (3)
As shown in Equation (3), log operation change the operator between excitation and component parts of the vocal tract. With the summation operator, two components can be separated.
Separation can be done by performing inverse domain. It is mathematically described in Equation (4). Discrete cosine transform (DCT) is used primarily in BFCC to replace IDFT. DCT is used to find the orthogonal projection of many dimensions of data. DCT is similar to calculating IDFT with no imaginary part and produce energy compression better than IDFT.
Fig. 2. The process of converting sound into cepstral
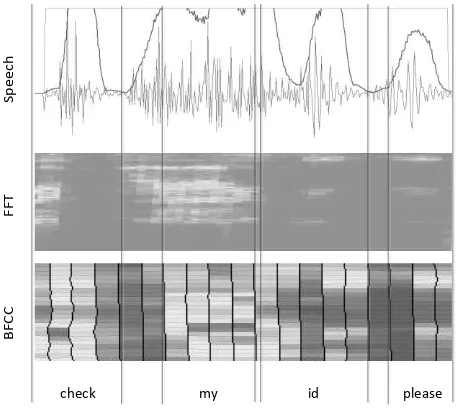
Generally, the process to get the feature extraction of voice signals using BFCC can be done through several stages. These stages include pre-emphasis filtering, frame blocking, windowing, fast fourier transform-frequency, bark wrapping and discrete cosine transform.
1) Voice Activity Detection (VAD)
The main function of the voice activity detection (VAD) is to detect the presence of speech for the purpose of helping speech processing to provide the beginning and ending of the voice segment. The basic function of a VAD algorithm is to extract some features or quantity of an input signal and to compare these quantities with the threshold value, the characteristic is usually extracted from the characteristics of the noise and the voice signal. Decision-making that the signal is active started if the value of the test results approaching the upper limit value and ends when the value approaches the lower limit. Selection of the appropriate threshold will determine the success of VAD whether the signal is active or inactive.
The usual method is by calculate the signal power within a certain time.
= 1 �=1( 2) (5)
where p is the signal power, xj is the voice signal
upper threshold lower threshold VAD power signal
Fig. 3. VAD output
2) Pre-emphasize Filtering
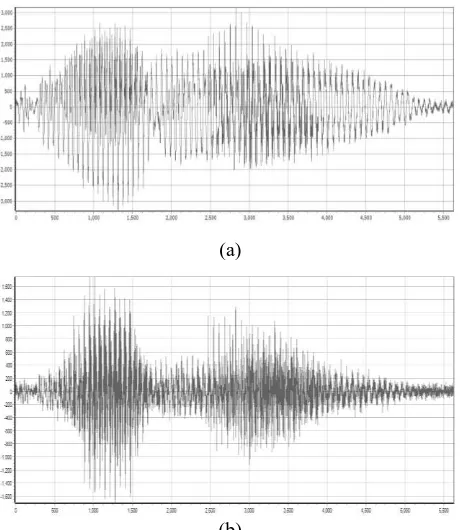
Pre-emphasis filetering is one type of filter that is often used before a signal is processed further. This filter maintains high frequencies in the spectrum, which is generally eliminated during sound production (see Fig. 4).
= − � −1 (6)
where yn is the pre-emphasis signal filtering, signal xnis the result of the previous process, and α
is a pre-emhasis coefficient between 0.9 - 1.
(a)
(b)
Fig. 4. (a) original signal, (b) pre-emphasis signal results
3) Frame Blocking
The signal must be processed within a certain time (short frame), because the sound signal is constantly changing as a result of a shift in the articulation of sound reproduction organs. The length of the frame is about 25 milliseconds (see Fig. 5). On the one hand, the size of the frame should be as long as possible to show a good frequency resolution. But on the other hand, the frame size should also be short enough to show a good time resolution. The process of frame blocking is carried on until the entire signal can be processed. In addition, these processes are overlapping for each frame. The length of overlap area is about 30% of the length of frame. Overlapping is done to avoid the loss of traits or characteristics of the sound.
4) Windowing
The framing process cause spectral leakage (magnitude leakage) or aliasing. Aliasing is a new signal having a frequency that is different from the original signal. This effect may be due to a low number of sampling rate or frame blocking, causing the signal becomes discontinue. To reduce the spectral leakage, the result of blocking the frame should be passed through windowing process. A good window function should be tapered at the main-lobe and wide in its side-lobe.
= (0.54−0.46 � 2�
�−1) (7)
yn is the result of windowing and xn is the result
of the previous process signals.
8.3 ms
25 ms
Fig. 6. Short time fourier transform
5) Fast Fourier Transform (FFT)
Fast fourier transform (FFT) is a solution that can be used in the analysis of frequency due to the speed and effectiveness in data processing. This transformation can calculate fourier series pretty
quickly compared to the discrete fourier
transformation. For a thousands number of data or even millions, fast fourier transformation can reduce the computation time by several orders of magnitude. FFT utilizes the periodic nature of the DFT. FFT in a short time span called short-time fourier transform (STFT). The idea behind this method is to make a non-stationary signal into a stationary signal representation by inserting a window function. In this case, the signals are divided into a few frames and then every frame converted by an FFT.
6) Bark-Frequency Cepstral Coefficients
This stage is the convolution process with n-filter for each frame spectrum signal. This perception is expressed in the scale of bark that have a relationship which is not linear with the sound frequency. Frequency wrapping generally is done by using bark filter banks (See Fig. 7).
Filter bank is one form of a filter that is done in order to determine the size of the energy of a certain frequency. Filter bank applied in frequency domain. In both cases, the filter consists of 24 channels which is done linearly in range 0-4 kHz. Bark filter is formed using Equation (8) and (9).
� =1960(26.28�+0.53)−
� (8)
= 52548
�2−52.56 �+690 .39 (9)
fc is a center frequency in Hz, Bc is a center
frequency in bark scale and Bw is bandwidth.
The form of filters overlapping each other. Bark-frequency wrapping use convolution filter to the signal, by multiplying the spectrum of the signal with its filter bank coefficient. More and more channels are used, then the higher the signal characteristic detail and the amount of data becomes larger. Here is the formula used in the calculation of bark-frequency wrapping.
= ��=1 ℎ (10)
yk is the result of the convolution with a
magnitude filter bank, xn is the input signal
frequency and hn is filter bank coefficient.
7) Discreate Cosinus Transform
Cepstrum obtained from the discrete cosine transform (DCT) to regain signal in time domain. The result is called a bark-frequency cepstral coefficient (See Fig. 8). BFCC approach can be calculated using Equation (11).
= � � � −0.5
� �
=1 (11)
j = 1, 2, 3, ..., Nfilter, Yi is a coefficient obtained
from the equation (10) and Cj is BFCC result.
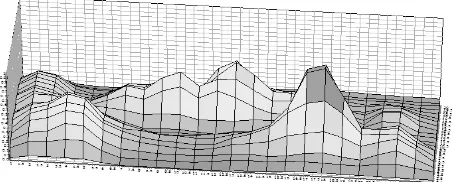
Fig. 7. Frequency wrapping
∑
1 xf
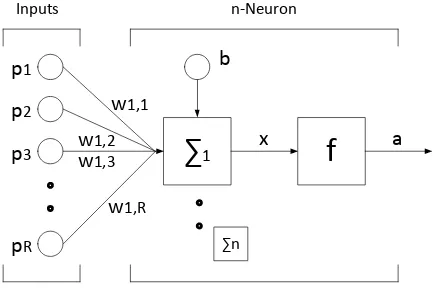
aFig. 9. Structure of ANN
III.2. Artificial Neural Network
In general, ANN is a network of a group of small processing units modeled by using human neural network. ANN is an adaptive system that can change its structure to solve problems based on external or internal information that flows through the network. Basically ANN is a modeling tool non-linear statistical data. ANN can be used to model complex relationships between inputs and outputs to find data patterns. Fundamentally, the learning system is the process of adding knowledge represented by weight and bias of ANN. Neurons are the basic parts of a neural network processing.
1) Forward Pass
A neuron with input R (See Fig. 9). Input p1, p2, ..., pR weighted by the elements corresponding to w [1.1]; w [1.2]; ...; w [1 R]. Output neuron calculated by Equation (12). Then the value of the output will be scaled using activation function f (x). This function will scale the output into a range of values between -1 and 1. output multiplied by the derivative of the activation function.
The experiment consists of voice activity detection, identification systems with neural network pattern, variation of SNR in pattern recognition and speaker variation accuracy.
Voice activity detection testing purpose is to examine the influence of several variations of the variables involved in the process of separating the voice signal, which contain information or not.
Several variations of the speed pronunciation tested, then the effect of a moving average filter band (length) and threshold limit of VAD amplitude analized (See Table I). With an optimal value of the moving average filter and threshold, the accuracy tested. This experiment is done by increasing the signal to noise ratio gradually. VAD accuracy is obtained by calculating the success rate of VAD.
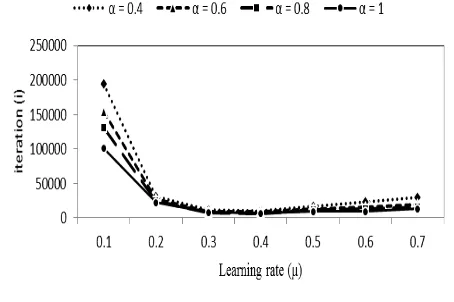
The purpose of identification system testing is to analyze all of variables influenced neural network such as beta, alpha and learning rate (See Fig. 10). Testing is done by varying the parameter values of ANN which are beta (β), alpha (α) and the learning
rate (μ). Then calculation complexity of ANN recorded using the number of iterations required in the process of learning to achieve convergence. Testing the effect of beta variations was also tested later. The experiment was conducted several times to produce average of accuracy. Accuracy is obtained by comparing the expected output with the actual output neuron.
The purpose of SNR testing is to test the effect of the many variations of sentence and noise with the accuracy (See Fig. 11). Noise testing starts by taking a data sample maximum 28 pieces of the speech signal variations for each sentence. Then neural network trained until the mean square error reach less than β. The test performed by recorded SNR which are 35 dB, 30 dB, 25 dB and 20 dB.
Fig. 10. The effect of ANN parameter to the complexity of calculations
Fig. 11. SNR variation compared to the accuracy
Fig. 12. Speaker variation compared to the accuracy
The purpose of speaker variation testing is to see the effect of the user voice compared to the accuracy. Tests conducted by the sentence spoken by 10 different speaker. The test results done in 20 repetitions for each speaker (See Fig. 12).
V.
Discussion
Then, to test variations of the threshold value that has been normalized, the experiment got the optimal value about 1.29 x 10⁻⁵. The threshold value which is more than 1.29 x 10⁻⁵ gets note (**). The result is quite good, the accuracy just not consistent for a few tries.
In SNR variations testing, the optimal conditions of VAD can produce good accuracy with SNR ≥ 25 dB. Testing with SNR <25 dB produces a very low level of accuracy. VAD difficult to distinguish signals that contain information or not because it is in a pause condition, the signal power is already too high that categorized as active signal.
Each variable affects the neural network processing complexity. The complexity of the calculation is increasing with the increasing of learning coefficient (μ). μ value symbolizes the learning speed of neurons in updating the weight and bias values to match with the targets to be achieved. Through experiments that have been
conducted, the optimal value of μ is approximately
0.3. The greater the value of μ has less effect on the complexity of the calculations. But smaller value of
μ can increase the complexity of the calculations dramatically. The constant slope of the curve (α)
also affects the complexity of the calculations. The
lower the value of α, the growing complexity of the
calculations. The complexity of the calculation will affect the delay process of learning. With more efficient computation, computer resources can be saved and the work can be completed more quickly. On the other hand, β affects the accuracy. The smaller the beta value is given, the higher the accuracy. The accuracy is improved with a value of
β ≤ 10-5. Smaller β will actually slow down the learning process to achieve convergent.
In SNR testing, it influence the accuracy of identification proccess. SNR power obtained by subtracting the average of the speech signal with an average power signal noise in dB. The higher the SNR, the higher the accuracy of pattern recognition. Greater distance of SNR indicate that the speech signal and noise signal is widening. This affects the accuracy of the VAD in the process of signal cutting. The great value of SNR will make it easier to distinguish the signal pattern from a silent speech. Instead SNR is low will lead to the data
being processed VAD becomes inaccurate.
Consequently, ANN undergone many mistakes in the process of identifying patterns. To improve expected output variation. The higher the variation of object classification, the lower the accuracy. Every sentence spoken by different speaker have specific characteristics that differ from each other. It really depends on the color of the voice of each people. Basically, BFCC and ANN can be used to study the data patterns of speech signals. But, ANN accuracy decreases with the increasing number of data patterns that were able to be identified. The highest accuracy obtained with 1 speaker, reaching 94%. Otherwise, the accuracy at the time of testing with 10 people is about 82%.
VI.
Conclusion
In this study, VAD has been designed with an accuracy of about ≥ 85% for SNR ≥ 25. The success of VAD in selection process will determine the success of voice verification system. In the ANN. BFCC-based feature extraction system combined with ANN produces 82% accuracy for 10 different speakers. Accuracy decrease with the increasing number of SNR and sentence variations learned.
Artificial neural network has a weakness in accuracy when confronted with many variations output. Adding more neurons can be a temporary solution to accommodate the amount of learning sample data. However, the distribution of weight become a barrier of ANN in identifying many variations of data pattern. ANN should be designed in a modular network which is used to train simplified data.
Acknowledgements
References
[1] Fardana, A. R., Jain, S., Jovancevic, I., Suri, Y., Morand, C. and Robertson, N. M. (2013). “Controlling a Mobile Robot with Natural Commands based on Voice and Gesture”, Proceedings of the IEEE International Conference on Robotics and Automation (ICRA).
[2] Barbu, T. (2010). “Gabor Filter-Based Face
Recognition Technique”, Proceedings of the
Romanian Academy, Series A, Volume 11, Romania. [3] Anitha, D., M.Suganthi, M., Suresh, P. (2011). “Image Processing of Eye to Identify the Iris Using Edge Detection Technique based on ROI and Edge Length” Proceedings of the International Conference on Signal, Image Processing and Applications (ICEEA), Singapore.
[4] Purwanto, D., Mardiyanto, R., Arai, K. (2009). “Electric wheelchair control with gaze direction and eye blinking” Proceedings of the 14th International Symposium on Artificial Life and Robotics, Oita, Japan.
[5] Damaryam, G., Dunbar, G. (2005). “A Mobile Robot Vision System for Self navigation using the Hough Transform and neural networks”, Proceedings of the EOS Conference on Industrial Imaging and Machine Vision, Munich, pp. 72.
[6] Putra, K. T., Purwanto, D., Mardiyanto, R., (2015). “Indonesian Natural Voice Command for Robotic Applications”, Proceedings of the International Conference on Electrical Engineering and Informatics (ICEEI), Bali.
[7] Jangmyung, L., MinCheol, L. (2013). “A Robust Control of Intelligent Mobile Robot Based on Voice Command”. Proceedings of the 6th International Conference, ICIRA.
[8] Teller, S., Walter, M. R., Antone, M., Correa, A., Davis, R., Fletcher, L., Frazzoli, E., Glass, J., How, J. P., Huang, A. S., Jeon, J. H., Karaman, S., Luders, B., Roy, N., Sainath, T. (2010). “A Voice -Commandable Robotic Forklift Working Alongside Humans in Minimally-Prepared Outdoor Environments”, Proceedings of the Robotics and Automation (ICRA).
[9] Kumar, P., Biswas, A., Mishra, A .N., and Chandra, M. (2010). "Spoken Language Identification Using Hybrid Feature Extraction Methods", Journal of Telecommunications. Volume 1. Issue 2.
[10] Waibel, A., Hanazawa, T., Hinton, G., Shikano, K., Lang, K. (1988). "Phoneme Recognition: Neural Networks vs Hidden Markov Models", Proceedings of the International Conference on Acoustics, Speech, and Signal Processing (ICASSP).
Authors’
information
Karisma T. Putra born in Bondowoso on
June 19, 1990. Graduated from elementary to senior high school in Bondowoso until 2008. Studied bachelor degree program in Surabaya, precisely in Electronics Engineering Polytechnic Institute of Surabaya (EEPIS) until 2012. He got scholarship program to continue master degree in Institut Teknologi Sepuluh Nopember (ITS) Surabaya. Now, he is a lecturer at electrical engineering, faculty of engineering, Universitas Muhammadiyah Yogyakarta. The main focus of research is the intelligent systems and controls. He engaged in joint research related to the development of food commodity tracking systems and integrated intelligent systems. He was involved in several competitions in developing smart devices. Pursue the field of electronics and software development since college.