Contents list available at IJRED website
Int. Journal of Renewable Energy Development (IJRED)
Journal homepage: www.ijred.com
Economic Impact of CDM Implementation through Alternate Energy
Resource Substitution
K.J. Sreekanth
*, S. Jayaraj, and N. Sudarsan
Department of Mechanical Engineering, National Institute of Technology, Kozhikode, Kerala- 673601, INDIA
Article history:
Received Nov 12, 2012
Received in revised form Dec 8, 2012 Accepted Jan 5, 2013
Available online
ABSTRACT: Since the Kyoto protocol agreement, Clean Development Mechanism (CDM) has garnered large emphasis in terms of certified emission reductions (CER) not only amidst the global carbon market but also in India. This paper attempts to assess the impact of CDM towards sustainable development particularly in rural domestic utility sector that mainly includes lighting and cooking applications, with electricity as the source of energy. A detailed survey has undertaken in the state of Kerala, in southern part of India to study the rural domestic energy consumption pattern. The data collected was analyzed that throws insight into the interrelationships of the various parameters that influence domestic utility sector pertaining to energy consumption by using electricity as the source of energy. The interrelationships between the different parameters were modeled that optimizes the contribution of electricity on domestic utility sector. The results were used to estimate the feasible extent of CO2 emission reduction through use of electricity as the
energy resources, vis-à-vis its economic viability through cost effectiveness. The analysis also provides a platform for implementing CDM projects in the sector and related prospects with respects to the Indian scenario.
Keywords: clean development mechanism, indian scenario, domestic energy consumption
* Corresponding author:
Email: [email protected]
1. Introduction
One of the important responses of Kyoto Protocol towards mitigation of global warming is Clean Development Mechanism (CDM) that has garnered large emphasis amidst the global carbon market in terms of Certified Emission Reductions (CER). While CDM aims to achieve sustainable development in energy production and consumption in developing countries, the results achieved through its implementation are still uncertain. More than four hundred studies have been undertaken since 1997 with respect to CDM. However, the contribution of these studies towards effective implementation of CDM at regional level and thereby reap the benefits of sustainable development has been ill addressed.
India as a rapidly developing nation has an enormous potential to benefit from CDM. The projects pertaining to CDM implementation, is expected to encourage private investments owing to the high rate of financial
P a g e |
This paper attempts to present the details of the investigation and analysis undertaken in this study with Section 1 highlighting the need of the study as Introduction. Section 2 outlines the energy scenario in India, followed by energy scenario in Kerala. Section 3 focuses on an exploratory analysis of the data collection and its validation. The CO2 emission reduction analysis
by interchanging the conventional energy resources with electricity is presented in Section 4 which is followed by its economic impact analysis in Section 5. The key findings of the analysis are discussed in section 6. The major conclusions drawn from the study are presented in the final section.
2. Energy Scenario in India
India experiencing a GDP growth rate of 8% per annum, putting tremendous pressure on the power sector of the country. The deficiency in the supply of energy is generally met through imports from other countries. The Indian energy scenario shows a drift in the energy balance mainly due to the differed energy sources in India. The country deal with amazingly impressive challenges in meeting its energy needs and providing adequate energy both in terms of sufficient quality and quantity to users in a sustainable fashion and at tenable costs. If the energy production pattern is analyzed, coal and oil account for about 65%. The rest is met by hydro power, nuclear power and natural gas. In the generation sector about 60% is from coal fired thermal power plants and 70% of coal produced every year in India is being used for thermal power generation.
On the consumption side, about 55% of commercial energy consumption is by the industrial sector. Even though the per capita energy consumption in India is one of the lowest in the world, the energy intensity, which is energy consumption per unit of GDP, is one of the highest in comparison to other developed and developing countries (Fig.1.) (Devadas 1997).
Fig. 1 Per capita energy consumption (Source: CMIE- (Centre for monitoring Indian economy-www.cmie.com))
The energy intensity is about 4 times that of Japan, 1.6 times that of USA, 1.5 times that of Asia and about 1.55 times that of the world average, rendering a large scope for energy conservation.
2.1 Energy Scenario in Kerala
Kerala s energy scenario is inextricably complex as compared with that of the nation. The installed capacity has expanded from 1,362 MW in 1947 to 1, 41,079 MW in January 2008. The per capita consumption of energy has increased from 16 kWh to 650 kWh. With the phenomenal increase in world energy prices, the economy of Kerala is struggling to cope with devastating increases in production costs. At the same time, due to limited new generation capacity additions and deficient rain fall, Kerala is experiencing severe and chronic energy shortages. The majority of energy in Kerala is consumed by households, which represent about 79% of all energy users and 46% of total electricity use. This is shown in Fig.2. Since, more than 2/3rd of the energy consumed in Kerala is for domestic use; even a minor alteration in the pattern of domestic energy consumption can bring significant changes to the total energy consumption. The important stages of energy transformation in an energy path comprises of generation, distribution, utilization and conservation. Cooking, lighting, heating, food processing and transportation are major energy end uses in Kerala.
Fig. 2 Consumer profile of electricity distribution in Kerala
3. Data Collection and Verification
probability, with a random start. The Districts administratively are a collection of panchayats, each of which is further sub divided in towards each comprising about 1200 households. Data pertaining to randomly selected 120 households was taken to be the representative sample of the District. Data collection was carried out from May 2009 to September 2009, through a questionnaire, prepared for the purpose that provides for gathering minute and precise details regarding the energy usage details. In order to verify the sufficiency of the sample size for 95% confidence interval the following equation was employed (Bernes 1980): Kerala was categorized into three regions namely, hilly, coastal and plain region based on geographic considerations. The data collected were also cross verified with data obtained from official statistics and other sources of information.
4. CDM Implementation Analysis
The National Sample Survey Organization (NSSO), in its sixth survey that is carried out once in five years included coverage of Non-agricultural Enterprises in the Informal Sector additionally. The highlights of the survey particularly applied to lighting sector reveals that at national level, electricity and kerosene accounted for 99% of the households as primary source for lighting in both rural and urban areas. There has been a decrease in the percentage of households using kerosene as predominant source of energy for lighting, from 62% to 51% in rural India, and from 17% to 10% in urban India, since 1993-94 (NSSO 1997). However, quantity of electricity used in Kerala domestic utility sector has witnessed an increase from 15 GWh in 1983 to 48 GWh in 1998, which is nearly threefold as per NSSO report, 1999-2000.
One of the previous studies on determinants of energy consumption concludes that income is a weak predictor of residential lighting energy consumption, explaining nearly 40% of energy consumption. The consumption of kerosene as a lighting fuel by a household essentially depends on the location and the socio-economic factors of the household. Using the SPSS regression analysis and EXCEL trend analysis, the differences in the average consumption of electricity across all the districts were tested. The results of both these tests indicate that there are significant differences
in the average quantity of electricity consumed by the households in the different districts and across different slabs of usage. This justifies the sample selection and its purpose. The trend analysis shows that the usage of electricity is increasing in the rural sector. The trend equation obtained for this application is given as: y = 2.24x – 4427 with a R2 value of 0.995. The CO2
emission from electricity can be found out by the IPCC guide line 2006 which is as follows:
CO2 emission from electricity use = [(kWh
consumed X Electricity emission factor)/ (Transmission and Distribution Efficiency)]
The electricity emission factor for India is 0.0008 ton of CO2/kWh and for the Transmission and Distribution
CO2 emission for Kerala from electricity
Year Quantity (mT) Year Quantity (mT) alternative strategies for energy resource replacements have been estimated in accordance with IPCC guidelines 2006.
Present fuel consumption = X million kg per year. CO2 reduction for 10% of fuel A replacement with fuel
B = X x 0.1x d.
Using the above calculations, the replacement levels for different fuels and CO2 reductions were calculated
by assuming the following values: net calorific value of firewood = 15 MJ/kg, Calorific value of natural gas = 49.5 MJ/kg, Calorific value of Kerosene = 46.2 MJ/kg. The percentage
Kyoto target analysis and CO2 emission reduction for
Kerala with fuel replacement options especially in domestic sector is given in Table 2. The variation of replacement scenario with CO2 emission reduction in
P a g e |
Table 2
The percentage Kyoto target achievable with fuel replacements
Replace-
Fig. 3 The variation of replacement scenario with CO2 emission
reduction in mT (Rural sector)
From this table it is very much evident that the replacement of firewood with LPG is very effective in reducing the CO2 emission in the state.
5. Economic Analysis
The results obtained from the CO2 emission
reduction analysis were extended to estimate the economic viability for implementation and the analysis carried out is highlighted. The economic implications of replacing fuel A with fuel B, was analyzed based on guidelines prescribed by the IPCC is presented:
By replacing 10% of fuel A with fuel B, the cost saved by 10% replacement = [c x m- b] x 0.1a.
The cost reduction achievable through replacement of different fuels were computed and presented in Table 3 to 5.
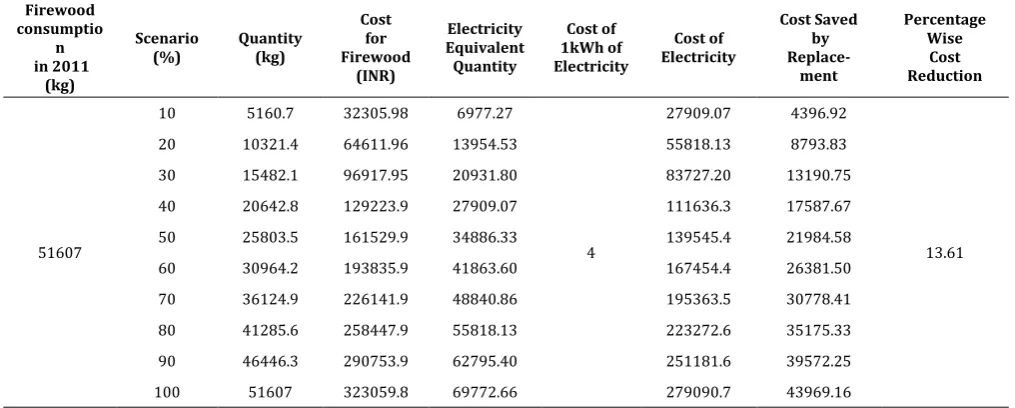
Table 3
Cost reduction analysis- Firewood replacement with electricity Firewood
30 15482.1 96917.95 20931.80 83727.20 13190.75
40 20642.8 129223.9 27909.07 111636.3 17587.67
50 25803.5 161529.9 34886.33 139545.4 21984.58
60 30964.2 193835.9 41863.60 167454.4 26381.50
70 36124.9 226141.9 48840.86 195363.5 30778.41
80 41285.6 258447.9 55818.13 223272.6 35175.33
90 46446.3 290753.9 62795.40 251181.6 39572.25
Table 4
Cost analysis- Kerosene replacement with electricity
Kerosene
Cost analysis- LPG replacement with electricity
LPG
70 7924.63 175847.5 85982.24 66206.3 109641.22
80 9056.72 200968.6 98265.41 75664.4 125304.25
90 10188.81 226089.7 110548.6 85122.4 140967.28
100 11320.9 251210.7 122831.8 94580.5 156630.31
The energy requirement equivalence for a given application was arrived at, with the assumption that, for economically and demographically comparable households are expected to have similar per capita energy requirement. Based on the data collected the energy resource equivalence were estimated to be, 1 kg of firewood = 0.00446 kg of LPG = 0.0909 kg of
replacement with electricity, around 52% cost reduction is possible which is clear from Table 4.
Table 5 indicates that there is considerable cost reduction of around 62.35% is possible while replacing LPG with electricity which can be attributed to the dwindling usage of electricity in primary applications.
P a g e |
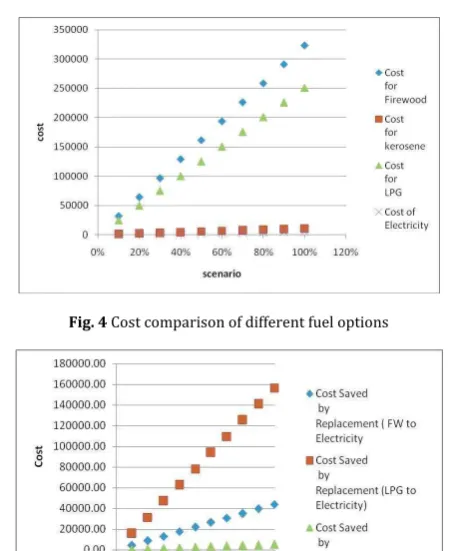
Fig. 4 Cost comparison of different fuel options
Fig. 5 Cost saved by different fuel replacement options (Rural sector)
6. Key Findings
While replacing the firewood, LPG and kerosene with electricity, there is the dual advantage of CO2
emission reduction as well as cost saving. The maximum cost saved among the above three scenarios are when replacing LPG with electricity which is followed by kerosene replacement with electricity. But when the CO2 emission too is considered, the most
beneficial scenario is to replace firewood or kerosene with electricity. Also, the usage of dual fuels like LPG and electricity together can be promoted as a means to reduce CO2 emission as well as to get maximum
economical benefit.
In all the above cases it can be seen that the R2 value
is around 0.995 which is very much satisfactory. Firewood and Biomass fuels, until recently a dominant household energy source in Kerala particularly for cooking purposes, play only a limited role in current household activities. The study reveals that this increased reliance on modern energy resources such as electricity for lighting and LPG for cooking, arises from a preference among consumers for relatively more operational convenience and availability. The end result had been that, Kerala households have witnessed dramatic increases in use of modern fuel in recent years especially in domestic utility sector. Changing patterns of household activity and livelihood underlie this growth.
Electricity demand has increased rapidly in Kerala in recent years. Higher appliance saturations and more intensive lighting sources like electricity despite the decrease in household income, have spurred this growth. Electricity availability covers almost all households in Kerala, albeit subject to frequent load shedding, black outs, and voltage fluctuations. The average monthly per household and per capita consumption of electricity has been observed as 120 and 25 kWh, respectively.
7. Conclusions
The study results presented herein is a primary attempt in modeling energy consumption patterns and trends in the state of Kerala in India, identifying the various factors influencing that could form a platform for energy planning in not only in the state but also for India as a whole. The models predicted to be developed is expected to aid in setting up and acclimatization of CDM in the energy sector, which could go a long way in contributing to reduction in Carbon Emission Reduction. The methodology outlined is expected to aid not only in financial planning of CDM implementation in the energy sector, but also, can go a long way in contributing to reduction in Carbon Emission Reduction through exploitation of electricity as an alternative energy resources particularly in rural India. From the study, it can be concluded that, Kyoto target can well be achieved with replacement of LPG or Firewood consumption by electricity in not only cost effective manner but also with minimum impact on environment. However, in the case of kerosene replacement scenario, there is only insignificant reduction in the CO2 emission
as well as the cost. The study presents only minor area concerning the energy requirement patterns for lighting in rural sector. However the study methodology can be extended to other areas of energy applications surrounding equally both rural and urban areas.
References
Bernes, R.M. (1980) Motion and Time Study. Asia Publishing House, Bombay.
Choi, J.N. & Thomas, Sy. (2009) Group Level Organizational Citizenship Behavior: Effects of Demographic Fault Lines and Conflict in Small Work Groups, Journal of Organizational Behavior, 31(7), 1032-1054.
Devadas, V. (1997) Micro level Planning: Part II—Impact Analysis through Scenarios. Energy Sources, Part A: Recovery, Utilization, and Environmental Effects, 19, 635-642.
Lean, H.H. & Smyth, R. (2010) CO2 Emissions, Electricity Consumption
and Output in ASEAN. Applied Energy, 87, 1858–1864.
NSSO (1997) National Sample Survey Organization, New Delhi, Dept of Statistics, Ministry of Planning and Program Implementation. Govt of India, New Delhi, Sarvekshana, XX(4), 365-398.
Ramachandra, T.V. (2009) RIEP: Regional Integrated Energy Plan.
Renewable and Sustainable Energy Reviews, 13(2), 285-317. Tiwari, P. (2000) An Analysis of Sectoral Energy Intensity in India.