THE OPTIMIZATION OF PRODUCTION ZEOLITE Y
CATALYST FROM RHA BY RESPONSE SURFACE
METHODOLOGY
Didi Dwi Anggoro and Aprilina Purbasari
*)Department of Chemical Engineering, Faculty of Engineering, University of Diponegoro
Jl. Prof. Soedarto, SH, Tembalang, Semarang, Indonesia, 50239, Tlp.:62-24-7460058, Fax.: 62-24-76480675 *)
Corresponding author: [email protected]
Abstract
Rice husk is the milling byproduct of rice and is a major waste product of the agriculture industry. Amorphous silica, commonly referred to as rice husk ash, was extracted from rice husk by acid leaching, pyrolysis, and carbon-removing processes. These properties make the ash a valuable raw material for many industries. This paper is study of synthesized of zeolite Y from rice husk ash. Zeolite Y synthesis is used for petroleum industry as expensive catalyst. Rice husk was calcined at temperature
700oC for two hours using furnace to produce pure silica. The composition of synthesized of zeolite Y
from rice husk was 2.24 Na2O:Al2O3:8SiO2:112 H2O.The gel solutionwas mixed at room temperature
for 24 hours using autoclave. Then, the gel solution was heated with variable temperature and time crystallization. The product zeolite synthesis Y was filtered and washed with distilled water until pH
lower than ten, than dried at oven. This product was analyzed with X-Ray Diffraction (XRD).From
XRD analyze result indicated that from rice husk ash can produced zeolite synthesis Y which high crystallization degree. The optimum conditions for synthesis of zeolite Y from rice husk ash are
temperature at 100oC for 48 hours, silicate at 20%, and aluminate at 10%.
Key words: response surface methodology, rice husk ash, synthesized, zeolite Y
Abstrak
Sekam padi merupakan hasil samping penggilingan beras dan limbah utama pada industri pertanian. Silika amorf, biasa disebut abu sekam padi, diekstraksi dari sekam padi dengan proses leaching asam, pirolisa, dan penghilangan karbon. Kandungan silika dalam abu sekam padi menjadikannya bahan baku yang bermanfaat untuk banyak industri. Makalah ini mempelajari pembuatan zeolit Y dari abu sekam padi. Zeolit Y sintetis digunakan untuk industri petroleum sebagai katalis yang harganya
mahal. Sekam padi dikalsinasi pada suhu 700oC selama dua jam menggunakan furnace untuk
menghasilkan silika murni. Komposisi zeolit Y sintetis adalah 2,24 Na2O : Al2O3 : 8 SiO2 : 112 H2O.
Larutan gel dicampur pada suhu kamar selama 24 jam menggunakan autoklaf. Kemudian, larutan gel dipanaskan dengan variabel suhu dan waktu kristalisasi. Produk zeolit sintetis Y disaring dan dicuci dengan air suling hingga pH kurang dari sepuluh, kemudian dikeringkan dengan oven. Produk tersebut dianalisis dengan X-Ray Diffraction (XRD). Dari hasil analisa X-Ray Diffraction (XRD) menunjukkan bahwa dari abu sekam padi dapat dibuat zeolit sintetis Y dengan derajat kristalisasi
yang tinggi. Kondisi optimum sintesis zeolit Y dari abu sekam padi adalah pada suhu 100oC selama
48 jam, silikat 20%, dan aluminat 20%.
Kata kunci: response surface methodology, abu sekam padi, sintetis, zeolite Y
INTRODUCTION
The present world rice production of about 400 million tons per year will probably increase in the future, owing to the great increase in population, particularly in Asian countries. When rice grains are husked, the husks make up about 14 to 35%, depending on the variety of rice; since the husks have a
low bulk weight of about 100 kg/m3, they take up 560
to 1400 million m3. In Indonesia, rice husk ash is
produced in abundance after rice harvesting reason (Report of Indonesian Statistic Centre, 2002).
(RHA). The composition of the mineral ash is
normally within the following limits: 92-97% of SiO2,
0.75-3.0% of Al2O3, 0.17-2.0% of Fe2O3, 0.36-3.0% of
CaO, and 0.32-1.5% of MgO (Tutsek et al, 1977). In addition, up to 30% carbon is found, depending on the degree and nature of combustion of the organic constituents before analysis. Because of its non-biodegradable property, the presence of the silica ash causes a number of problems to the environment. In order to solve this problem, useful applications of the waste product are desirable, including the large-scale synthesis of zeolite. Preliminary efforts were made in the synthesis of zeolite using this source. Thus, Bajpai et al (1981) obtained mordenite, Wang et al (1998) obtained ZSM-48 type zeolite, Ramli (1995); Ramli and Bahruji, (2003) obtained X and ZSM-5, and Prasetyoko et al (2006) obtained zeolite beta using RHA as a silica source. They were found that zeolite Beta started to form after 12 hours and the complete crystallization of zeolite Beta phase was achieved after 2 days.
Zeolite Y synthesis is used for petroleum industry as expensive catalyst (Scherzer J., 1990). Type Y zeolite is prepared using a minimum excess of reactants by a method wherein required sodium hydroxide, silica, alumina and water reactants are combined in multi-stage procedure to obtain a uniform fluid reaction slurry. The procedure permits the efficient commercial production of high quality type Y zeolite and minimizes the formation of excess silicate containing by-product effluent (Vaughan et al, 1979). Sand can be used as a source of silica in the production of zeolite Y by activating the sand with from 50 to 2000 ppm alumina (Kostinko et al, 1981). Rice husk
was calcined at temperature 700oC for two hours using
furnace to produce pure silica. This paper is optimization study of synthesized of zeolite Y from rice husk ash by response surface methodology.
Response surface methodology (RSM) is a method to determine the optimum condition of a process. RSM has similarity with regression analysis. In regression analysis, empirical mathematical model are derived from the experiment data. RSM is a set of techniques designed to find the optimum value of the response and the influencing factors. RSM technique has been successfully applied in the field of quality experimental work (Amin and Anggoro, 2004; Kasankala et al, 2007; Mundra et al, 2007; Pio and Macedo, 2007; K¨orbahti et al, 2007; Macedo and Pio, 2007; Ushakumari et al, 2007; Psomas et al, 2007; Anggoro and Istadi, 2008).
This article estimates the optimization of temperature, % of silicate and % of aluminate on crystallinity of Y zeolite from RHA using response surface methodology (RSM). The temperature, % silicate and % aluminate concentration used were
70oC, 90oC, 110oC; 10%, 20%, 30% and 5%, 10%,
15%, respectively, resulting in a two-level experimental design, with 16 experiments. Empirical parameters were estimated with standard least-square
procedure, using the Design Expert Statsoft software “Statistica” version 6.0.
EXPERIMENTAL METHOD
The raw material rice husk was obtained from a rice mill. Their major constituents are cellulose, lignin and ash. Amorphous silica, commonly referred to as rice husk ash (RHA), was extracted and purified from rice husk by acid leaching, pyrolysis, and carbon-removing processes. In this experiment, the raw rice husk was washed with distilled water to remove
adhering soil and was then dried at 100oC in an air
oven. The dried rice husk was refluxed with 3N HCl
solution in a glass round-bottomed flask at 100oC
within a thermostat for 1 h. After leaching, the husk was thoroughly washed with distilled water and dried.
The composition of synthesized of zeolite Y
from rice husk was 2.24 Na2O: Al2O3: 8 SiO2: 112
H2O.The gel solutionwas mixed at room temperature
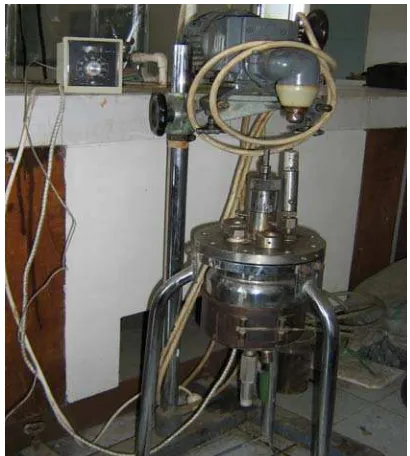
for 24 hours using autoclave, as shown Figure 1. Then, the gel solution was heated with variable temperature and time crystallization. The product zeolite synthesis Y was filtered and washed with distilled water until pH lower than ten, than dried at oven. This product was analyzed with X-Ray Diffraction (XRD). All of the products were characterized by powder X-ray diffraction (XRD) for the crystallinity and purity of the solid materials, using a Siemens 5000 diffractometer with the Cu Ka radiation as the diffracted monochromatic beam. The pattern was acquired in the 2θ 0–60o range.
Figure 1. Stainless steel Autoclave with stirred
Table 1. The experiment design with difference temperature, silicate, and aluminate
Run No Temperature Si Al
RESULTS AND DISCUSSION
Effect of Time and Temperature of Crystallization
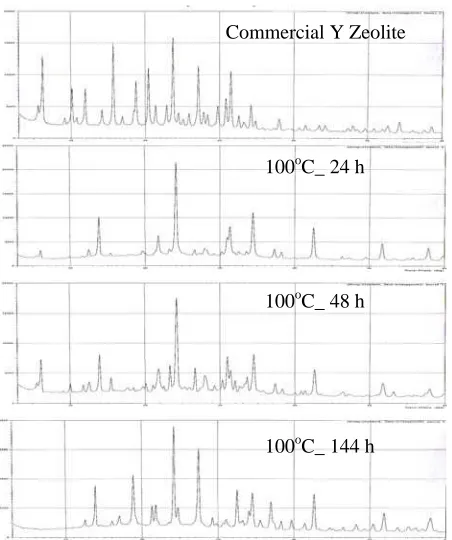
X-ray diffractogram of commercial zeolite Y (CY) and synthesis zeolite Y (Y1, Y2, and Y3) is shown in Figure 2.
Figure 2. X-Ray Diffractogram of Four Samples
It indicates that all samples have zeolite Y crystal, but have different crystallity percent. Percent of crystallinity and unit cell are calculated by following equation (Glusker and Trueblood, 1972):
%
The unit cell and solid crystallinity of
commercial Y zeolite and synthesis Y zeolite (Y1, Y2,
and Y3) with difference of crystallization time are
tabulated in Table 2. The unit cells of all samples are nearly similar, while the solid crystallinity of all
synthesis Y zeolite (Y1, Y2 and Y3) is lower than
commercial Y zeolite.
Table 2. Unit Cell and Percent of Four Samples
Sample Unit Cell (Å) % Crystalinity
Commercial Y Zeolite 24.6 100.0
Y1 (100oC_ 24 h) 25.6 37
Y2 (100oC_ 48 h) 24.4 74.0
Y3 (100oC_ 144 h) 24.4 39.0
Time of crystallization can be optimized in the synthesis of zeolite. In system that produce only one zeolitic phase, optimizing maximum crystallization over a short span of time is important from a practical standpoint, and is accomplished by applying knowledge of the contribution of the many component in the synthesis mixture to minimize the crystallization time. Crystallization parameters must be adjusted to minimize the production of the other phases while also minimizing the time needed to obtain the desired crystalline phase (Szostak, 1989).
Commercial Y Zeolite
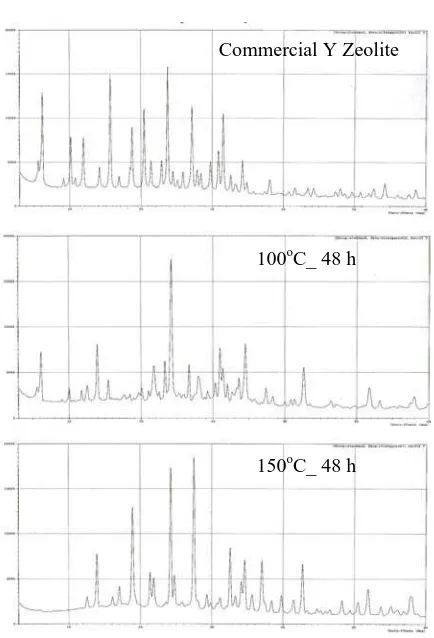
X-ray diffractograms of commercial Y zeolite
and synthesis Y zeolite (Y2 and Y4) with difference of
crystallization temperature are shown in Figure 3. It indicates that all samples have Y zeolite crystal, but have different the solid crystallinity percent. Crystallization of all synthesis Y zeolite is lower than commercial zeolite Y, as tabulated in Table 3.
100oC_ 24 h
Temperature influences several factors in zeolite synthesis. It can alter the zeolite phase obtained as well as change the induction period before the start of crystallization. This induction period decreases with increasing temperature. For any mixture as the temperature increases, the rate of crystallization increases. As the temperature increases, the solubility of the aluminate and silicate species increase, causing a shift in the concentration of the liquid phases (Szostak, 1989).
100oC_ 48 h
100oC_ 144 h
Optimization
Figure 3. X-Ray Diffractogram of Four Samples
Table 3. Unit Cell and Percent of Four Samples
Sample Unit Cell (Å) % Kristalinitas
Commercial Y
Zeolite 24.6 100.0
Y2 (100oC_ 48 jam) 24.4 74.0
Y4 (150oC_ 48 jam) 24.3 48.0
In both cases, the different solubilities of the silicate anions and the resulting interaction with the aluminate anions presence in the solution contribute to the different behaviors of both types of silica (Szostak, 1989).
The optimum condition (100oC and 24 hours),
which obtained in early experiments, is used to study the effect of silicate and aluminate. For this purpose, the experiment design and results is tabulated in Table 4. From Table 4, the effect temperature and silicate on zeolite Y synthesis can be obtained by pareto chart analysis, as shown Figure 4. Figure 4 indicated that the temperature has more effect than silicate.
The optimum condition between temperature and silicate for zeolite Y synthesis can obtained by 3D analysis using statistica 6.0 software, as shown Figure 5. Figure 5 indicated that the optimum condition for
synthesis zeolite Y is the temperature at 100oC and
silicate at 20%.
Table 4. The solid crystallinity of zeolite with difference temperature, silicate, and aluminate Commercial Y Zeolite
Run
No Temperature Si Al
The solid crystalinity
1 70 10 5 70
2 70 10 15 75
3 70 30 5 78
4 70 30 15 80
5 110 10 5 82
6 110 10 15 85
7 110 30 5 88
8 110 30 15 78
9 90 20 10 95
10 54 20 10 72
11 125 20 10 76
12 90 2.3 10 80
13 90 37.6 10 75
14 90 20 1.2 80
15 90 20 18.8 78
16 90 20 10 94
100oC_ 48 h
150oC_ 48 h
.1301391 -.813154
1.555994 -1.77868
-2.42562
p=.05 Effect Estimate (Absolute Value) (2)Silikat(L)
1Lby2L (1)Suhu(L) Silikat(Q) Suhu(Q)
Figure 4. Pareto chart analysis for temperature versus silicate
80 70 60 50
From Table 4, the effect temperature and aluminate on zeolite Y synthesis can be obtained by pareto chart analysis, as shown Figure 6. Figure 6 indicated that the temperature has more effect than aluminate. The optimum condition between temperature and aluminate for zeolite Y synthesis can obtained by 3D analysis using statistica 6.0 software, as shown Figure 7. Figure 7 indicated that the optimum condition for synthesis zeolite Y is the temperature at
100oC and aluminate at 10%. Effect Estimate (Absolute Value)
(2)Aluminat(L) 1Lby2L Aluminat(Q) (1)Suhu(L) Suhu(Q)
Figure 6. Pareto chart analysis for temperature versus aluminate
80 70 60 50
Figure 7. The 3 D analysis for temperature versus aluminate
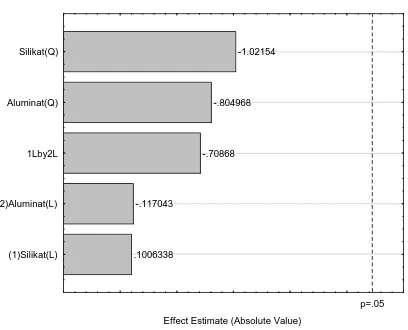
From Table 4, the effect silicate and aluminate on zeolite Y synthesis can be obtained by pareto chart analysis, as shown Figure 8. Figure 8 indicated that the crystalinity of zeolite Y synthesis not depend on both silicate and aluminate. The optimum condition between silicate and aluminate for zeolite Y synthesis can obtained by 3D analysis using statistica 2002 software, as shown Figure 9. Figure 9 indicated that the optimum condition for synthesis zeolite Y is the silicate at 20% and aluminate at 10%.
.1006338 Effect Estimate (Absolute Value)
(1)Silikat(L) (2)Aluminat(L) 1Lby2L Aluminat(Q) Silikat(Q)
Figure 8. Pareto chart analysis for silicate versus aluminate
Figure 9. The 3 D analysis for silicate versus aluminate
CONCLUSIONS
From the experimental result for synthesis zeolite Y using rice husk ash, characterization analysis using X-Ray Diffraction (XRD), and optimization analysis using statistica 6.0 software can conclude that rice Husk Ash is potential silica sources for produce synthesis zeolit Y. Temperature and time of synthesis are not affected of unit cells length, but affected of
percent of the solid crystallinity. Temperature at 100oC
and time at 48 hours are the best operation condition of synthesis zeolite Y. The optimum conditions for synthesis of zeolite Y from rice husk ash are
temperature at 100oC, silicate at 20%, and aluminate at
10%.
ACKNOWLEDGMENTS
REFERENCES Psomas, S.K., Liakopoulou-Kyriakides, M., and Kyriakidis, D.A., (2007), Biochemical Engineering Journal, 35(3): 273
Amin, N.A.S and Anggoro, D.D., (2004), Fuel, 83(4– 5): 487
Ramli, Z., (1995), Rhenium-impregnated zeolites: synthesis, characterization and modification as catalysts in the metathesis of alkenes, Ph.D. thesis, UTM, Malaysia.
Bajpai et al, (1981), Ind. End. Chem. Prod. Res. Dev., 20, 721–726.
Didi Dwi Anggoro and Istadi, (2008), J. of Natural Gas Chemistry, 17(1): 39.
Ramli, Z. and Bahruji, H., (2003), Malaysian Journal Chemistry, 5, 48–55.
Glusker, J.P and Trueblood, K.N (1972), Crystal Structure Analysis: A Primer, New York, Oxford
University Press. Report of Indonesian Statistic Centre (2002).
Scherzer, J., (1990), Octane – Enhancing Zeolitic FCC Catalysis, Marcel Dekker.Inc.
Kasankala, L.M, Xue, Y., Weilong, Y., Hong, S.D., He , Q., (2007), Bioresource Technology, 98(17): 3338
Szostak, R., (1989), Molecular Sieves Principles of Synthesis and identification, Van Nostrand Reinhold Catalysis Series, Elsevier.
Kostinko et al, (1981), United States Patent 4,264,562 (April 28, 1981)
K¨orbahti, B.K, Aktas, N., and Tanyolac, A., (2007), J.
Hazardous Materials, 148(1–2): 83 Tutsek et al, (1977), United States Patent 4,049,464
(September 20, 1977). Macedo, G. and Pio, T., (2007), J. Biotechnology,
131(2): S211 Ushakumari, S.R., Rastogi, N.K., and Malleshi, N.G.,
(2007), J. Food Engng, 82(1): 35 Mundra, P., Desai, K., and Lele, S.S., (2007),
Bioresource Technology, 98(15): 2892 Vaughan et al, (1979), United States Patent, 4,178,352
(December 11, 1979) Pio, T.F. and Macedo, G.A., (2007), Enzyme Microb
Technol, 41(5): 613 Wang et al, (1998), Journal Hazard Material, 58,
147–152. Prasetyoko et al, (2006), Waste Management,