Central Statistics Organization of Afghanistan Page 1
Introduction
Kabul was the fourth province to have successfully completed the Socio-Demographic and Economic Survey in the country. SDES in Kabul was launched in June 2013, jointly by the Central Statistics Organization (CSO) and the United Nations Population Fund (UNFPA) where the latter provided the technical assistance to the entire survey operations. SDES data serve as the benchmark for demographic information at the district level and to some extent, group of villages/enumeration areas.
SDES is a continuing project designed to get those vital population information and at the same time to provide CSO staff additional experience in designing and conducting surveys in a large platform contributing much to one of the primary objectives of the institution’s capacity building. It is the only survey that addresses the need of local development planners for information at the lower level of disaggregation. There are other surveys that CSO has conducted but these are available only at the national and provincial levels.
To achieve a responsive and appropriate policymaking, statistics plays a vital role. In Afghanistan, there has been a longstanding lack of reliable information at the provincial and district levels which hinders the policy making bodies and development planners to come up with comprehensive plans on how to improve the lives of Afghans. With SDES data, though it is not complete yet for the whole country, most of the important indicators in monitoring the progress towards the achievement of Afghanistan’s Millennium Development Goals (MDGs) are being collected.
I.
Objectives, Methodology, Monitoring, Supervision, and Data Processing
A.
Objectives
1.
Evidence
‐
Based Decision Making, Policy Making,
Planning, and Administration
From 2002, Afghanistan began receiving a massive amount of multi-sector support for development projects. Most of these projects were designed and implemented despite a lack of reliable data, especially at the village and district levels; a situation which persisted until the development of SDES. This lack of data has hampered effective policy formulation and strategic development planning at the local level; the absence of precise baseline data also makes it difficult to measure progress and to target priority populations ensuring the efficient allocation of resources. The SDES was designed to address this, by collecting social and economic data on Afghan households, leading to better targeted policies and service delivery.
2.
Data for Businesses and Industries
Central Statistics Organization of Afghanistan Page 2
3. Housing Policy and Programmes
SDES provides data on the current housing status of the residents, and the structural make-up of the houses. In conjunction with the profile of the area’s inhabitants and their capacity to acquire such property, it is possible to analyse housing demand in the area. This information can guide policy makers in their design of basic housing programmes.
4. Data on Vulnerable Population and their Utility
SDES collects data on categories of the population with varying types of vulnerability. These include people with disabilities, youth and women. The demographic and socio-economic attributes of these groups require special treatment in policy and programming, and must be factored into development processes at all levels.
5. Humanitarian Assistance
SDES includes a mapping and listing of all houses, business establishments and institutions at the district and village levels. It also provides the location of community infrastructure including health facilities, schools, mosques, markets and roads. These are essential for emergency preparedness plans to prevent or mitigate widespread devastation in the event of a disaster. The data categorizes population groups by sex, age, education, literacy, employment status and other important variables to help shape humanitarian assistance if needed.
6. Research
SDES will provide invaluable data for further analysis, comparison with other survey results and as a basis for further research. The data will be extremely useful for government and non-government institutions; for instance, data on out-of-school youth can generate new policies to address the situation.
B. Methodology
T
he survey consisted of two related activities: a) the extensive listing and mapping of houses, establishments and institutions (conducted before the household survey) and b) the household survey.1.
Extensive Listing of Houses, Establishments and Institutions
Central Statistics Organization of Afghanistan Page 3 village, the presence of electricity, water sources, potential relocation sites, etc. was also collected.
The surveyors used the mapping outputs to guide them in conducting the survey and ensure complete coverage. In total, 16 nahias, and around 843 villages in 14 districts in Kabul Province were canvassed, divided into 3,068 enumeration areas.
2. Survey Enumeration
Unlike previous CSO surveys, which were designed to provide data at the provincial level, SDES focuses on district and lower levels, including urban subdivisions, major villages and clusters of smaller villages. This will prove valuable for local development planning and the monitoring of public service delivery.
The survey first involved a listing of every household in each village. Half of these listed households (i.e. every other household) were taken as samples and asked questions on education, literacy, employment, migration, functional difficulty, fertility, mortality, parents’ living status, birth registration and household and housing characteristics.
C. Monitoring and Supervision
T
he listing and mapping activity was carried out by 343 CSO and hired cartographers and 343 hired assistant cartographers with 60 District Statistics Officers (DSOs)/Nahia Statistics Officers (NSOs) and assistants. The field enumeration was conducted by 2,690 surveyors and 527 controllers, under the supervision of the DSOs/NSOs and their assistants and CSO staff supervisors.Monitoring during the training was undertaken by CSO and UNFPA technical staff who visited the nahias and districts centers during the two-week training of the DSOs/NSOs and assistants, controllers and surveyors. They clarified the concepts and procedures to follow in executing the survey and responded to logistical, administrative, financial, and human resource problems as needed.
CSO and UNFPA technical staff were also responsible for editing the questionnaires, spot-checking, re-interviewing and recording observations during household interviews in all 16 nahias and 14 districts. This helped ensure that errors were corrected at an early stage of enumeration. CSO supervisors used computer tablets in recording the findings during monitoring and supervision.
In addition, a third party monitoring company was contracted and 115 CSO monitors went to check the coverage of the survey and observed the enumeration. They were tasked to monitor the work of surveyors and controllers and their findings were immediately relayed to CSO supervisors for necessary action.
Central Statistics Organization of Afghanistan Page 4 movements of the vehicles if NSOs/DSOs went out in the field to carry out monitoring.
D. Data Processing
A Data Processing Centre (DPC) in Karte-char was established to house the data processing activity, which includes editing, coding and encoding of entries from the questionnaires. A total of 344 data processors who underwent strict screening and extensive technical training were hired. Computers, an electricity generator, furniture, air conditioner, heaters, Internet connection and other materials and utilities were likewise provided.
Data encoding and cleaning were also done in Karte-char where 178 encoders were hired and four CSO supervisors were detailed to oversee the whole data processing stage.
II. Major Findings of SDES
1.
Population Distribution
Figure 1 below shows the population distribution by sex and age group in Kabul Province. There were more males than females in the population of Kabul, with the males comprising 51.6 percent or a sex ratio of 106 males for every 100 females. This is the same sex ratio on record for the whole country, which was 106 males for every 100 females as reported in the NRVA 2011-20121.
Half of the population of Kabul was aged 18 years or younger at the time of the survey, implying a young population in the province. The 5–9 year age group constituted the largest segment of the provincial population at 15 percent, followed by 10-14 year age group at 14.1 percent and those younger than 5 years at 13.9 percent. The relatively small 0-4 age group in Figure 1 indicates three possible major reasons: 1) fertility decline over the decade as reported in the NRVA results; 2) omission of small children during enumeration which is common in many countries; and 3) age misreporting and digit preference.
The youth’s population (aged 15-24 years) comprised 23.2 percent of the province’s population, of which 52.4 percent were males and 47.6 percent were females. This distribution leads to a dependency ratio of 83 persons younger than 15 and older than 64 years for every 100 persons aged 15–64 years. This ratio, however, is lower than the recorded national dependency ratio of 104.
Among 15 to 19 years old, around 5.8 percent were married; close to 40 percent among 20 to 24 years; 76.4 percent among 25 to 29 years old; and more than 90 percent among 30 years old and above. The estimated mean age at first marriage in Kabul was 24 years, higher for males than females (26 years and 23 years, respectively).
1
All national-level data used for comparison in this report were taken from the National Risk and Vulnerability
Central Statistics Organization of Afghanistan Page 5 By district, Kabul City, the Provincial Capital, had the largest population size making up 77.2 percent of the total population in the province, followed by Bagrami District comprising 5.2 percent, while Guldara and Khak-E-Jabar Districts had the smallest at 0.3 percent each of the total.
Table 1. Population Distribution by Sex and District: Kabul, 2013
Province/District Male (%) Female (%) Percent of District Population to Total Kabul Population
Kabul 51.6 48.4 100.0
Kabul City 51.6 48.4 77.22
Paghman 51.9 48.1 3.6
ChaharAsyab 51.7 48.3 1.4
Bagrami 51.4 48.6 5.2
Dehsabz 51.6 48.4 3.0
Shakar Dara 51.3 48.7 1.8
Musahi 52.1 47.9 0.6
Mir Bacha Kot 51.5 48.5 1.2
Khak-E-Jabar 51.1 48.9 0.3
Kalakan 50.6 49.4 0.6
Guldara 51.0 49.0 0.3
Farza 51.1 48.9 0.6
Estalef 50.6 49.4 0.4
QaraBagh 51.7 48.3 1.8
Surubi 51.7 48.3 1.9
2
As per IDLG classification, Kabul City is divided into 16 nahias.
10 5 0 5 10
0 - 4 5 - 9 10 - 14 15 - 19 20 - 24 25 - 29 30 - 34 35 - 39 40 - 44 45 - 49 50 - 54 55 - 59 60 - 64 65 - 69 70 - 74 75+
Percentage
Figure 1. Population by Age and Sex: Kabul, 2013
Female
Central Statistics Organization of Afghanistan Page 6 By population density, which is the ratio of the population to land area, Kabul City had the most number of people who occupy the same size of land (7,907 persons per sq km of land area),while Khak-E-Jabar had the fewest (24 persons per sq km).
2. Education
2.1 Literacy
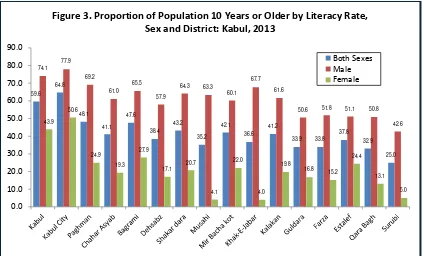
According to the survey findings, the literacy rate of the household population aged 15 years or older in Kabul Province was 55.2 percent (71.4 percent for males and 37.7 percent for females). These rates were higher than the national rates: with the country’s overall literacy rate at 31.4 percent (45.4 percent for males and 17 percent for females).
The literacy rate of the provincial population aged 10 years or older was 59.6 percent. The males’ literacy rate was 74.1 percent, while that of females’ was 43.9 percent. On the other hand, the illiteracy rates for the male and female was 25.8 percent and 56 percent, respectively. The youth’s (population aged 15 to 24 years old) literacy rate was 70.7 percent (83.3 percent for males and 56.9 percent for females), much higher than the national youth’s literacy rate at 47 percent (61.9 percent for males and 32.1 percent for females).
Central Statistics Organization of Afghanistan Page 7 2.2 Highest Class Completed
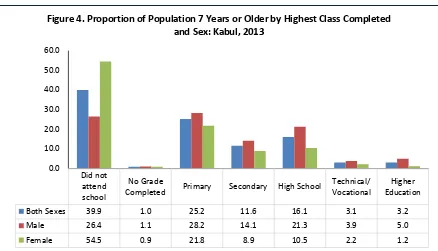
Two in five persons 7 years or older (39.9 percent) in Kabul Province had not attended any formal education at the time of the survey. A larger proportion was reported among females (54.5 percent), compared with males (26.4 percent). The same pattern was observed in all districts, with more females who had not attended any formal school. Khak-E-Jabar District had the highest percentage point difference between males and females at 60.2 points, followed by Musahi at 58.5 percentage points. Kabul City and Estalef District had the smallest percentage point difference at 24.8 points and 27.0 points, respectively.
Only 5.1 percent of the population 18 years old and older in the province had attended higher education (8.0 percent for males and 1.9 percent for females). Among districts, Kabul City had the highest proportion (6.1 percent) of those who attended higher education because of its accessibility to universities and colleges. A larger proportion was observed among males (9.5 percent) compared to females (2.3 percent). Guldara and Estalef Districts had the lowest proportions (0.2 percent) of those who attended the higher education.
59.6
Figure 3. Proportion of Population 10 Years or Older by Literacy Rate, Sex and District: Kabul, 2013
Central Statistics Organization of Afghanistan Page 8
2.3 Net School Attendance3
Among the population in Kabul aged 7–12 years, some 740,000 children were attending primary school (classes 1–6) at the time of the survey. This represents a net primary attendance rate of 67.6 percent, higher than the national rate of 56.8 percent. Among the boys, the net primary attendance rate was 74.4 percent, while it was 60.4 percent for girls. The same pattern was observed among those aged 13–15 years attending secondary school (classes 7–9), with the boys’ net attendance rate at 52.2 percent and the girls’ rate at 36.5 percent (the combined rate was 44.6 percent). Among the population aged 16–18 years, 35.4 percent were attending high school (classes 10–12) at the time of the survey; 42.9 percent among males and 27.3 percent among females.
Kabul City had the highest net primary, secondary and high school attendance rates (73.1 percent, 48.9 percent and 39.1 percent, respectively). Kalakan District had the second highest net primary attendance rate at 60.8 percent; Shakar Dara District had the second highest net secondary attendance rate 35.7 percent; while Paghman had the second highest net attendance high school rate at 27.3 percent. On the other hand, Surubi District had the lowest net primary and secondary school attendance rates (29.5 percent and 20.2 percent, respectively) while Musahi District had the lowest high school attendance rate at 13.7 percent.
3
Net school attendance is the percentage of children in the age group that officially corresponds to primary schooling which is age 7-12 years; secondary schooling, age 13-15 years; and high school, age 16-18 years.
Did not attend school
No Grade
Completed Primary Secondary High School
Technical/ Vocational
Higher Education
Both Sexes 39.9 1.0 25.2 11.6 16.1 3.1 3.2
Male 26.4 1.1 28.2 14.1 21.3 3.9 5.0
Female 54.5 0.9 21.8 8.9 10.5 2.2 1.2
0.0 10.0 20.0 30.0 40.0 50.0 60.0
Central Statistics Organization of Afghanistan Page 9
Table 2. Net Attendance Rates by District and Sex: Kabul, 2013
District Net Primary Attendance Rate Net Secondary Attendance Rate Net High School Attendance Rate
Both Sexes Boys Girls Both Sexes Boys Girls Both Sexes Boys Girls
Kabul 67.6 74.4 60.4 44.6 52.2 36.5 35.4 42.9 27.3
Kabul City 73.1 77.4 68.4 48.9 54.8 42.8 39.1 45.3 32.4
Paghman 56.0 70.0 41.5 34.8 49.0 20.3 27.3 40.1 13.3
ChaharAsyab 46.6 63.8 28.4 26.9 40.7 12.2 21.4 33.1 7.8
Bagrami 57.0 68.4 44.9 34.1 46.1 21.3 25.0 35.6 13.4
Dehsabz 47.6 61.2 32.8 27.4 39.5 13.8 19.4 29.8 7.6
Shakardara 56.4 71.6 40.5 35.7 53.2 18.9 26.1 39.4 11.6
Musahi 36.9 63.4 6.8 23.1 43.8 0.4 13.7 26.2 0.0
Mir Bacha kot 54.7 68.5 40.1 25.7 38.3 12.8 24.1 35.5 11.5
Khak-E-Jabar 43.2 72.1 10.8 26.4 53.1 1.1 20.5 40.2 0.0
Kalakan 60.8 74.3 48.1 30.5 49.2 12.6 22.8 38.9 6.9
Guldara 48.2 64.7 28.2 22.6 32.6 12.5 17.9 26.2 10.9
Farza 50.0 64.3 34.2 24.7 39.1 11.8 20.0 33.3 5.6
Estalef 54.4 64.6 43.4 30.2 39.5 21.4 22.3 30.9 14.5
QaraBagh 56.9 70.2 42.1 24.8 39.8 9.6 18.1 31.1 3.2
Surubi 29.5 44.0 11.9 20.2 31.8 5.5 15.3 27.3 2.3
Central Statistics Organization of Afghanistan Page 10 3. Migration
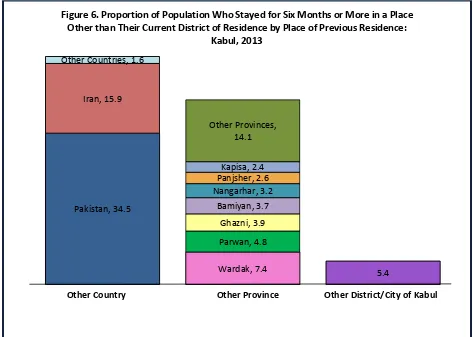
From the total population of Kabul Province, 31.9 percent resided for at least six months in a place other than their current residence at the time of the survey (another district of Kabul Province, another province, or abroad). Half of them (52.0 percent) came from abroad while around 42.1 percent came from other provinces and just 5.4 percent lived in different districts within Kabul Province.
One in three (34.5 percent) persons who resided for at least six months outside of the current district of residence came from Pakistan and close to one in six (15.9 percent) came from Iran while just 1.6 percent came from other countries. On the other hand, the distribution of migrants from other provinces is as follows: Wardak, 7.4 percent; Parwan, 4.8 percent; Ghazni, 3.9 percent; Bamiyan, 3.7 percent; Nangarhar, 3.2 percent; Panjsher, 2.6 percent; Kapisa, 2.4 percent; and other provinces, 14.1 percent.
Pakistan, 34.5
Wardak, 7.4 Iran, 15.9
Parwan, 4.8 Other Countries, 1.6
Ghazni, 3.9
5.4 Bamiyan, 3.7
Nangarhar, 3.2 Panjsher, 2.6
Kapisa, 2.4 Other Provinces,
14.1
Figure 6. Proportion of Population Who Stayed for Six Months or More in a Place Other than Their Current District of Residence by Place of Previous Residence:
Kabul, 2013
Other Country Other Province Other District/City of Kabul
Central Statistics Organization of Afghanistan Page 11
Not Reported
0.6% Don't Know
5.4%
Not Registered 28.0%
Registered 66.0%
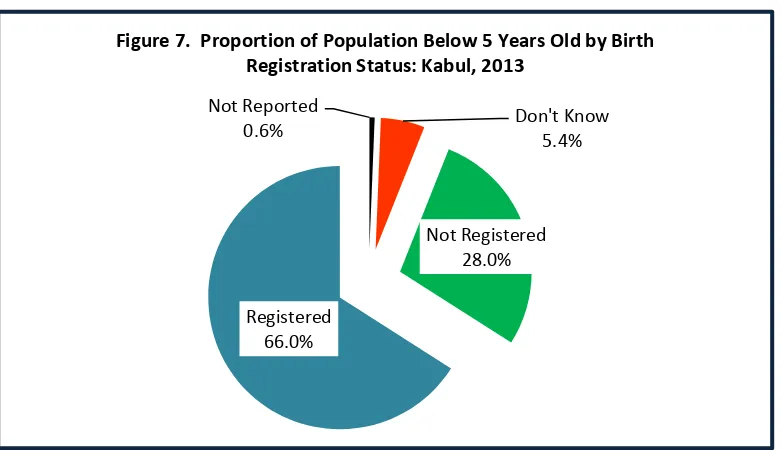
Figure 7. Proportion of Population Below 5 Years Old by Birth Registration Status: Kabul, 2013
4. Birth Registration
The birth of two in three (66.0 percent) children below 5 years old was registered. This is much higher compared to the national estimate reported at one birth in three (35.2 percent). There was little difference in the birth registration rate between boys and girls in Kabul (66.5 percent and 65.4 percent, respectively).
Among the districts, Mir Bacha Kot had the highest registered births at 84.0 percent, while Surubi had the lowest at 28.1 percent.
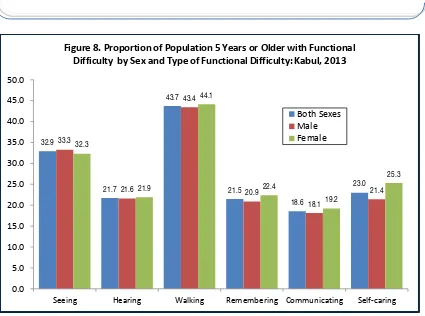
5. Functional Difficulty
Around 1.7 percent of the Kabul population 5 years or older at the time of the survey had at least one functional difficulty in seeing, hearing, walking, remembering, communicating, or self-caring. Among those with functional difficulty, the most common was walking (43.7 percent), followed by seeing (32.9 percent) and then self-caring (23.0 percent).
Central Statistics Organization of Afghanistan Page 12
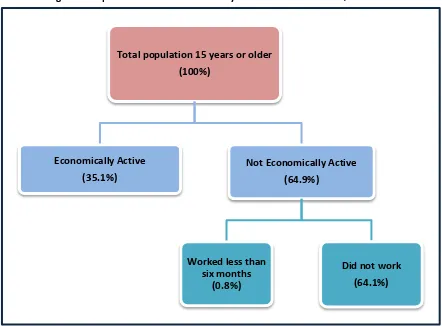
6. Economic Activity
The Socio-Demographic and Economic Survey collected data on the main activity carried out by household members 5 years or older during the 12 months prior to the survey.
In Kabul Province, among the population 15 years or older, 35.1 percent were considered economically active which means that they did some work for 6 months or more during the 12 months prior to the survey. Persons who were considered as not economically active were those who worked for less than 6 months or did not work at all during the reference period comprised 64.9 percent. The percentage of persons who did not work to the total population 15 years and older was high at 64.1 percent while only 0.8 percent worked for less than 6 months.
32.9
Seeing Hearing Walking Remembering Communicating Self-caring
Figure 8. Proportion of Population 5 Years or Older with Functional Difficulty by Sex and Type of Functional Difficulty: Kabul, 2013
Both Sexes Male Female
Functional difficulty
Central Statistics Organization of Afghanistan Page 13 Figure 10 shows that the proportion of persons who did not work during the reference period was the highest in all districts ranging from 55.6 percent in Kalakan District to 66.5 percent in Khak-E-Jabar District as compared to those who worked (for more than or less than 6 months). Kalakan District had the highest percentage of persons 15 years and older who reported to have worked for more than 6 months at 40.1 percent while Paghman District had the lowest at 32.7 percent.
Kabul SDES shows that around 42,000 children aged 5 – 17 years were working. Among them, 2.7 percent had worked for more than six months during the previous 12 months or were considered economically active.
Total population 15 years or older
(100%)
Economically Active
(35.1%)
Not Economically Active
(64.9%)
Worked less than six months
(0.8%)
Did not work
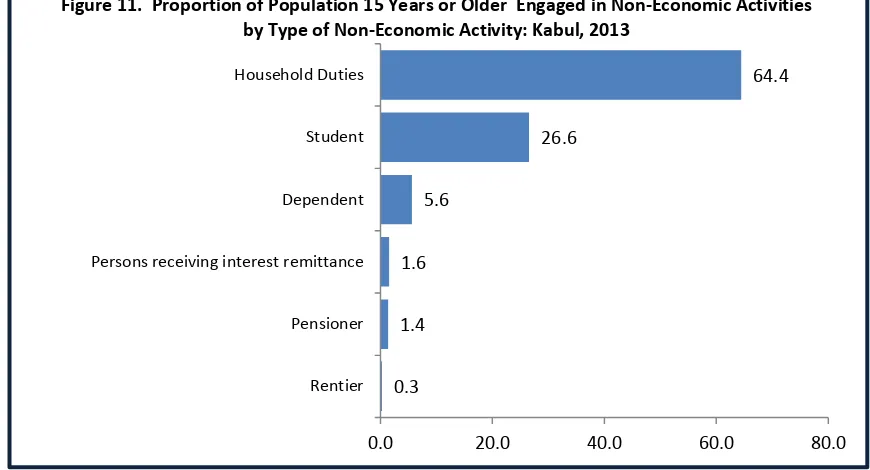
Central Statistics Organization of Afghanistan Page 14 Among those persons 15 years or older who were engaged in non-economic activities during the 12 months prior to the survey (did not work and worked less than six months), most reported that they were attending to household chores (64.4 percent) or studying (26.6 percent). Some 5.6 percent of them were reported as dependents, probably due to old age or too young.
35.1 35.2
Figure 10. Population 15 Years and Older by Economic Status and District: Kabul, 2013
Worked 6 Months or More Worked Less than 6 Months Did Not Work
0.3
Central Statistics Organization of Afghanistan Page 15 7. Fertility
Nine in ten ever married women (91.1 percent) 15 years or older at the time of the survey reported having given birth to at least one child. While 45.4 percent of ever married women in the 15 to 19 year age group had given birth, 95.5 percent of ever married women aged 25 to 49 years had given birth to at least one child. Moreover, among the 15 to 24 year old ever married women (youth), 69.8 percent had given birth.
Among the districts, the largest proportion of ever-married women aged 15 to 49 years who gave birth was reported in Surubi (90.8 percent) while the smallest proportion was in Khak-e-Jabar (84.0 percent).
These estimates, as with any fertility estimates from other surveys likely suffers from underreporting of new born and thus necessitates a fertility estimation using an indirect technique.4
4
A recalculation of fertility rates using the indirect technique will be included in the final report.
89.8 89.9
90.6
89.8 89.2
88.9 89.2 88.9 89.3
84.0 89.2
88.2
87.8 88.1
89.5 90.8
80.0 82.0 84.0 86.0 88.0 90.0 92.0
Central Statistics Organization of Afghanistan Page 16 8. Mortality
The survey found more than 42,000 deaths during the two years prior to the survey period. There were more males who died (58.6 percent) than females (41.4 percent). Among female deaths, 16.1 percent were in the age group 15 to 49 years at the time of their death.
Of the total deaths, 12.9 percent were infants, with more male infant deaths (57.6 percent) compared to female infant deaths (42.4 percent). About one in five (18.8 percent) of the persons who died was a child below 5 years; there were more boys than girls (57.5 percent and 42.6 percent, respectively).
Because of the two-year time parameter, respondents may not have recalled accurately the death of household members, especially if it was a newborn that lived only for a short period of time. This section, as with any survey on mortality, likely suffers from underreporting of deaths and thus necessitates a mortality estimation using an indirect technique.5
9. Household Characteristics
9.1 Average household size
Of the 590,000 households in Kabul Province, the average household size was 6.9 persons, lower than the average at the national level (7.4 persons). Kabul City, Surubi, and Mir BachaKot had a lower average household sizes than the provincial average, 6.8 persons in Kabul City and Surubi, and 6.4 persons in Mir Bacha Kot, while the rest were above the provincial average which ranged from 7.1 persons in Estalef, Guldara, and Shakardara Districts to 8.4 persons in Musahi and ChaharAsyab.
5
A recalculation of deaths using the indirect technique will be included in the final report.
6.9
8.4 8.4 8.2
7.8 7.6 7.6
7.4 7.3 7.3 7.1 7.1 7.1
6.8 6.8 6.4
0.0 1.0 2.0 3.0 4.0 5.0 6.0 7.0 8.0 9.0
Central Statistics Organization of Afghanistan Page 17 9.2 Main Source of Energy for Cooking, Heating and Lighting
Eight in ten (81.5 percent) households in Kabul Province used Liquefied Petroleum Gas (LPG) for cooking; some 13.1 percent used wood; 2.1 percent used electricity; and 3.3 percent used other fuels such as animal dung, charcoal, and agricultural crop for cooking.
Three in five households (63.4 percent) used wood for heating their houses. Charcoal was used by 15.6 percent of households, while gas by 6.8 percent and electricity by 3.9 percent.
Electricity was the leading source of energy for lighting among households and was used by four in five households (80.7
Electric
Figure 14. Proportion of Households by Main Source of
Energy for Cooking: Kabul, 2013
Figure 15. Proportion of Households by Main Source of Energy for
Lighting: Kabul, 2013
Figure 16. Proportion of Households by Main Source of Energy for Heating: Kabul, 2013
Central Statistics Organization of Afghanistan Page 18 9.3 Main Source of Water for Drinking, Washing, Cooking and Other
Purposes
Three in four households in the province (78.4 percent) had access to improved drinking water sources (29.2 percent with protected well, 15.9 percent with piped water into the dwelling, 14.9 percent with a tube well borehole, 13.5 percent with piped water into the compound, 2.9 percent with piped water into neighbor, and 1.9 percent with a protected spring). This rate is much higher than the national estimate of 45.5 percent.
Bagrami, Dehsabz, Kabul City and Musahi had the largest proportions of households with access to improved drinking water sources (85.8 percent, 84.4 percent, 82.9 percent and 82.0 percent, respectively). In contrast, in Estalef almost all households (90.5 percent) had no access to the improved drinking water sources where a high proportion of households (62.1 percent) used surface water for drinking.
The main source of water for cooking, washing and other purposes in Kabul Province was either protected well (29.7 percent) or piped water into dwelling unit (15.7 percent). Water from unprotected spring was commonly used in Surubi District with 42.8 percent of the households drawing water from this type of source while water from protected wells was used mostly by the households in Kalakan, Bagrami and Mir BachaKot Districts (48.5 percent, 47.5 percent and 41.9 percent, respectively).
78.4 82.9 45.0 60.6 85.8 84.4 48.5 82.0 51.8 56.2 66.3 51.3 42.5 9.3 53.5 42.8
21.6 17.1 55.0 39.4 14.2 15.6 51.5 17.9 48.2 43.7 33.6 48.7 57.5 90.5 46.5 57.2
0% 10% 20% 30% 40% 50% 60% 70% 80% 90% 100%
Figure 17. Proportion of Households by Access to Improved Sources of Drinking Water and District: Kabul, 2013
Central Statistics Organization of Afghanistan Page 19 9.4 Land ownership
One in four households (25.3 percent) in Kabul owned an agricultural land (in Kabul or in other provinces) at the time of the survey. Majority of the households in most of the districts in the province owned an agricultural land: Khak-e-jabar, 84.4 percent; Guldara, 76.6 percent; Farza, 69.3 percent; Musahi, 68.1 percent; Kalakan, 67.9 percent; Surubi, 64.3 percent; Qarabagh, 62.6 percent; Estalef, 57.1 percent; and Shakar Dara, 56.7 percent. The size of land owned, however, was small where 85.7 percent of all households with land owned less than five gerib or 10,000 sq m (1 gerib = 2,000 sq m).
9.5 Ownership of livestock and poultry
Livestock raising specifically cattle is more common among the households in Kabul compared to poultry raising (12 percent of households raised at least one type of livestock compared to 10.3 percent of households that raised at least one type of poultry). Figure 18 shows that 5.7 percent of the households raised at least one cattle at the time of the survey, 2.8 percent raised at least a sheep, 1.8 percent raised at least a goat, and 1.7 percent raised at least a horse. Most of the households with cows (80.7 percent) owned only one or two cattle.
Raising of chicken on the other hand, is the most popular activity among the households that were engaged in raising any type of livestock or poultry (57 thousand households or 9.7 percent of the households raised at least one
70.6 75.8 56.4 61.6 73.9 62.8 37.6 31.2 48.4 15.3 28.6 20.7 19.6 36.4 35.8 29.2 25.3 20.0 40.4 37.1 25.7 32.4 56.7 68.1 47.7 84.4 67.9 76.6 69.3 57.1 62.6 64.3
0% 10% 20% 30% 40% 50% 60% 70% 80% 90% 100%
Without agricultural land With agricultural land
Central Statistics Organization of Afghanistan Page 20 chicken). Most of the households raised chicken for food sustenance where 48.2 percent of households raised less than five chickens. A small proportion of households raised either duck or turkey (0.6 percent).
9.6 Household assets and facilities
Mobile phone was the most common item (among the list of 16 items) found in most of the households in Kabul Province (97.2 percent). The necessity of a communication facility is evident in all districts; from 88.3 percent of households in Estalef to 97.6 percent in Kabul City.
The presence of electricity in their houses is also a necessity in most districts where about nine in ten households of the six districts had electricity in their houses (Musahi, 98.1 percent; Kabul City, 94.9 percent; Khak-e-Jabar, 94.7 percent; Bagrami, 91.9 percent; Chahar Asyab, 91.2 percent; and Paghman, 89.8 percent; ). For the rest of the districts, at least six to eight in ten households (61.9 percent to 84.3 percent) had electricity in their houses.
A comparison of media and communication equipment reveals that most of the households in Kabul owned a television set (79.0 percent), followed by a radio (59.2 percent), and a few households with an internet access (8.0 percent).
In terms of a vehicle present in the households, either for personal or business use, 25.1 percent of households had at least car/truck.
0.6
9.7 1.7
1.8 2.8
5.7
0.0 2.0 4.0 6.0 8.0 10.0 12.0
Duck/Turkey Chicken Horse/Donkey/Mule Goat Sheep Cattle
Central Statistics Organization of Afghanistan Page 21 Table 3. Proportion of Households by Type of Asset/Facility Present and District: Kabul, 2013
P
10.1 Construction Materials of the Roof, Walls and Floor
Central Statistics Organization of Afghanistan Page 22 Table 4. Proportion of Households by Construction Materials of the Roof of the Housing
Units and District: Kabul, 2013
Province/District Wood/Wood
Planks with Mud Cement Metal Others
Kabul 75.1 16.0 4.4 4.5
Kabul City 72.1 18.6 4.2 5.1
Paghman 84.8 8.9 4.6 1.7
ChaharAsyab 82.9 10.5 3.1 3.5
Bagrami 79.5 11.6 5.6 3.3
Dehsabz 78.1 5.7 0.5 15.7
Shakardara 92.5 3.7 2.6 1.2
Musahi 97.1 0.5 1.8 0.6
Mir Bacha Kot 95.5 1.9 1.4 1.2
Khak-E-Jabar 95.8 0.1 1.6 2.6
Kalakan 98.7 0.5 0.1 0.7
Guldara 98.4 0.9 0.2 0.5
Farza 97.6 1.0 0.4 0.9
Estalef 98.3 0.7 0.2 0.8
QaraBagh 94.5 1.1 3.3 1.1
Surubi 91.7 3.1 1.5 3.7
Central Statistics Organization of Afghanistan Page 23 Table 5. Proportion of Households by Construction Materials of the Outer Walls of the
Housing Units and District: Kabul, 2013
Province/District Adobe Bricks Dirt/Stone
with Mud
Cement/ Stone with
Lime
Others
Kabul 43.9 24.4 20.6 9.1 2.0
Kabul City 47.1 27.4 12.8 11.0 1.7
Paghman 30.6 14.7 49.1 3.9 1.6
ChaharAsyab 29.0 12.5 48.8 6.2 3.4
Bagrami 56.7 24.5 14.7 1.7 2.4
Dehsabz 31.2 23.8 38.7 3.1 3.2
ShakarDara 28.0 8.5 60.4 0.7 2.4
Musahi 24.0 1.3 73.8 0.3 0.7
Mir Bacha Kot 37.2 7.8 51.9 1.2 1.9
Khak-E-Jabar 3.6 0.8 93.9 0.4 1.2
Kalakan 9.9 3.4 85.1 0.5 1.0
Guldara 30.2 4.5 63.2 0.2 1.8
Farza 44.7 2.8 49.6 1.6 1.3
Estalef 28.1 2.9 66.2 0.3 2.4
QaraBagh 12.1 3.3 81.3 0.5 2.9
Surubi 7.2 0.6 79.4 3.9 8.9
10.2 Type of Toilet Facility
Two in five households in Kabul Province reported to be having an improved sanitation facility (37.9 percent with flush or pour flush to sewer system, septic tank, or to pit; 5.4 percent with ventilated improved pit latrine or pit latrine with slab; and 0.5 percent with composting toilet).
Kabul City had the highest number of households (53.1 percent) using an improved sanitation facility and most (46.2 percent) of them were using the flush or pour to pipe/septic tank/pit. Bagrami District was next at 16.1 percent in which 13.4 percent of them were using the flush or pour flush to septic tank.
Central Statistics Organization of Afghanistan Page 24
10.3 Ownership of the Housing Unit
Tenure status of the housing unit is an important proxy variable for measuring the poverty status of a household. In the province, seven out of ten households reported owning the housing unit they occupied, 22.8 percent reported that they were renting, 2.8 percent were occupying the unit for free while 2.5 percent said that the housing units they were living in were given as a pledge (gerawee).
Table 6. Proportion of Households by Tenure Status of the Housing Units and District: Kabul, 2013
Province/District Owned Rented Pledged
(Gerawee) Free Lodging
Kabul 71.9 22.8 2.5 2.8
Kabul City 67.2 27.1 3.1 2.6
Paghman 88.3 7.6 0.5 3.5
ChaharAsyab 87.9 7.9 0.6 3.6
Bagrami 83.1 14.1 0.6 2.2
Dehsabz 86.6 11.0 0.2 2.1
Shakardara 93.7 1.9 0.1 4.3
Musahi 93.4 1.4 0.1 5.1
Central Statistics Organization of Afghanistan Page 25 Annex 1 - Definition of Terms
Adult Literacy Rate. Percentage of persons aged 15 and over who can read and
write.
Dependency Ratio. The ratio of the number of persons in the unproductive ages
0-14 and 65 and over to the number of persons in the most productive ages of 15-64, expressed as a percentage.
Economically Active Population. Persons who were usually economically
active for 6 months or more during the 12 months prior to the survey.
Functional Difficulty. A person with difficulty in functioning may have activity
limitations, which may range from a slight to a severe deviation in terms of quality or quantity in executing an activity in a manner or to the extent that is expected of people without the health condition. In general, functional difficulties experienced by people may be due to their health condition (such as disease or illness), other health problem (such as a short - or – long-lasting injury), a mental or emotional problem or a problem with alcohol or drug use. A health condition may also include other circumstances, such as pregnancy, aging, stress or congenital anomaly. Difficulty is usually manifested when a person is doing an activity with increased effort, discomfort or pain, slowness or changes in the way the activity is typically done.
Improved Drinking-Water Source. Defined as one that, by nature of its
construction or through active intervention, is protected from outside contamination, in particular from contamination from fecal matter. It includes piped water into the dwelling, compound and neighbor; tube well borehole, protected well; and protected spring.
Improved Sanitation Facilities. For MDG monitoring, it is defined as one that
hygienically separates human excreta from human contact. It includes flush or pour flush to sewer system, septic tank, or to pit; ventilated improved pit latrine or pit latrine with slab; and composting toilet.
Net School Attendance. Percentage of children in the age group that officially
corresponds to primary schooling which is age 7-12 years; secondary schooling, age 13-15 years; and high school, age 16-18 years.
Not Economically Active Population. Persons who worked for less than 6