USI NG PA R T I C I PA T OR Y A PPR OA C H T O I M P R OV E A V A I L A B I L I T Y OF S PA T I A L
D A T A F OR L OC A L G O V E R NM E NT
T . K liment a,c, V . C etl. a, H. T omi č a, J . L isiak b, M. K liment c
a
Uni versity of Z agreb, F aculty of Geodesy, K ačićeva 26, HR -10 000 Z agreb, C roatia - (tkliment, vcetl, htomic) @ geof.hr
b
T he city of Požega, T rg S v. T roj stva 1, 34000 Požega, C roatia - josip.lisiak@ pozega.hr
c
S lovak Uni versity of A griculture in Nitra, Horticulture and L andscape E ngineering F aculty, T ulipánová 7, 949 76 Nitra, Slovakia - marcel.kliment@ uniag.sk
K E Y W OR D S: A uthoritative G eospatial D ata, Participatory A pproach, L ocal SD I, W eb and Mobile GIS.
A B ST R A C T :
Nowadays, the availability of authoritative geospatial features of various data themes is becoming wider on global, regional and national levels. T he reason is existence of legislative frameworks for public sector information and related spatial data infrastructure implementations, emergence of support for initiatives as open data, big data ensuring that online geospatial information are made available to digital single market, entrepreneurs and public bodies on both national and local level. However, the availability of authoritative reference spatial data linking the geographic representation of the properties and their owners are still missing in an appropriate quantity and quality level, even though this data represent fundamental input for local governments regarding the register of buildings used for property tax calculations, identification of illegal buildings, etc. W e propose a methodology to improve this situation by applying the principles of participatory G IS and V G I used to collect observations, update authoritative datasets and verify the newly developed datasets of areas of buildings used to calculate property tax rates issued to their owners. T he case study was performed within the district of the C ity of Požega in eastern C roatia in the summer 2015 and resulted in a total number of 16072 updated and newly identified objects made available online for quality verification by citizens using open source geospatial technologies.
1. I NT R O D UC T I ON
L ocal governments at the municipality level make policy decisions directly affecting citizens’ life on a daily basis. T he geospatial information ( G I) resources play a crucial role assisting local governments in various activities as urban planning, environmental monitoring, local tax obligations linked to real estate ownerships ( property tax declaration) , risk management, among others ( Miranda et al, 2011) .
T he availability of authoritative spatial data has increased in the last decade due to ongoi ng regional ( e.g. INSPIR E – Infrastructure for Spatial Information in E uropean C ommunity) , national (e.g. NSD I – National Spatial Data Infrastructure in C roatia) and local activities related to establishing of a Spatial D ata Infrastructure ( SD I) ( Nebert, 2009).
However, there are only few examples of having organized spatial data in a "SD I like", thus interoperable and usable way on the local level in C roatia (e.g. Z agreb S D I ( Šiško et al, 2012) ) . On the other hand, some of the spatial data required for decision making made by local government ( administration) are not meant to be produced on the national level. Spatial data need to be collected / managed / verified by l ocal resources most ideally with some community support with currentl y emergent practices as participatory G IS ( E rik de Man, 2006) and voluntary geographic information ( V G I) (M iranda et al, 2011).
In the current situation, the significant number of l ocal governmental information i nfrastructures still lacks the high quality spatial data normall y made available from the authoritative bodies on a national level (geodetic, mapping, environmental, agricultural, etc. agencies) due to various reasons. T oday the traditional techniques of data gathering are still in use, however the frequency and di versity of updates requires to maintain the local government GI up to date. T his can easily become an unfeasible task from human, technical and financial perspective. T herefore, participatory G IS approaches used to collect spatial data in order to update the property systems
deployed as local SD I can considerably support decisions of a local government.
T hese days, the academy mostly plays a role of educator and at the same time could be seen a professional supporter of public administration bodies. T he later often lacks resources and related expertise to produce spatial data, thus outsourcing the work to academia is an optimal solution. A ctually, this is one of the cornerstones of a knowledge based economy where the appropriate management of the relationship between the state executi ve bodies on local level and academy institutions is vital to a strong and dynamic future for these institutions (George, 2006).
In addition, the citizens as volunteers produce voluntary geographic information ( V GI) ( C oleman et al, 2009) by gathering, revising and augmenting G I stored and made available online via a local SD I and related W eb based and / or mobile applications. On the global level, there has been an explosion of interest in using the W eb to collect and share GI provi ded voluntarily by peoples within the projects as W ikimapia and OpenStreetM ap ( Goodchild, 2007) . Nevertheless, only a few number of current research works reported usage of V GI on a local SD I level, even though the most important and unique GI citizens can provide are related to their indi vidual interest. F inally, the last decade has shown that available open source geospatial technologies can provide effective, efficient and affordable way to provide interfaces between local governments and citizens taking into consideration available resources on both sides.
T he main objective behind the current research was to develop a methodology and perform its pilot implementation aiming at calculations of buildings features areas based on more accurate authoritative geospatial data, participatory field observations, open source W eb G IS components and interfaces and data validation performed by V G I provided by citizens, thus property owners and tax payers. In this research we simulated V G I by
students who were collecting the data in the field. It is expected that in the future these tasks might be performed by citizens. T he present paper is structured as follows: i.) the methodology section describes the steps taken to deliver the final products / outputs; ii) the results section reports the datasets developed from calculations of new areas deri ved from geometries of spatial features available in authoritative dataset and extended by information from the field works, web GIS client deployed for citizens in order to display the final datasets and verify the quality. iii) T he last section concludes the research and draws future directions improving the final products as well as recommends steps to be considered by other local governments demandi ng to establish an S D I supporting their strategic decisions.
2. M A T E R I A L S A ND M E T H O D S
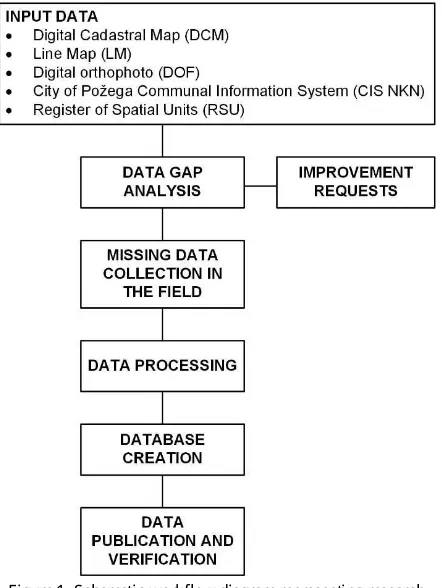
C onstructed by the main goal of the research study, the methodol ogy consisted of the following steps ( F igure 1): i) analysis of the data available from the local SD I and authoritative data available from state geodetic administration (input data); ii) harmonization of input data based on gap analysis and identified improvement requests; iii) data collection; iv) data processing v) new database modelling and integration of input / processed data, raw field observations and user needs identified for the final system, vi) authorized data publication and verification based on open source G I technologies.
F igure 1. Schematic workflow diagram representing research
study methodology
2.1 Study ar ea
T he study area was located within the district of the C ity of Požega, whole admi nistrative area of the city that includes a large number of surrounding suburbs and smaller villages (F igure 2). Požega is a city in western S lavonia, in eastern part of C roatia, with a total population of 26,248 according to 2011 census. It is
the administrative centre of the Požega-Slavonia C ounty. T he city is located at 45.34° N and 17.68° E at 152 m above sea level in the fertile valley, which is framed by the Slavonian mountain ring Psunj, Papuk, D ilj and K rndija. T his fertile valley has been important since the antiquity - its R oman name was V allis A urea, meaning "golden valley".
F igure 2. L ocation of C ity of Požega within C roatian territory
and study area divided into fi ve main field observation
2.2 I nput data
In C roatia, the land administration system is based on two registers: C adastre, under the responsibility of State Geodetic A dministration (SGA ) and L and B ook which is under the responsibility of L ocal C ourts. A ccording to the law, the real estate consists of a land parcel including everything that is relativel y permanentl y connected to it over and under its surface ( Official Gazette, 16/2007) . R eal estate is registered in land and real estate cadastre, and the rights on them are realized by registering in the land book. Unfortunatel y, about 70% of cadastral maps in official use today were initially made by graphic surveys (R oić, 2012). V ery often situation in the registers does not correspond to the real situation in the field. R egisters however have correctl y registered parcel boundaries as well as the registered owners, but some main objects ( e.g. houses) and majority of secondary objects ( e.g. garages) are still unregistered. C ity of Požega as a local admini strative unit consists of several cadastral municipalities. T he majority of cadastral maps for cadastral municipalities in Požega were made by numeric surveys in 1970’s and 1980’s. In those digital cadastral plans objects coincide very well with satisfactory accuracy with objects from line map (those that exists in cadastral map) . In addition, three cadastral municipalities have new map made from new cadastral survey using modern geodetic methods (classic terrestrial geodetic survey combined with GNS S methods and aerial photogrammetry base maps) – K O ( C roatian K atastarska općina– C adastral municipality) V idovci, K O D ervišaga and K O Novo Selo. In those municipalities, objects from cadastral map and from line map coincide almost 100%.
D ue to this, the line map data product was used as input base layer for geographic and geometric identification of the buildi ngs in the study area. L ine map ( L M) ( C roatian: linijska karta) is a digital product which was used in the pilot realized as a part of C roatian-Norwegian funded project C R ONO-GIP ( R ožić et al, 2003). Purpose of L ine Mapping was to reduce the field surveying during the R eal Property R eambulation. L ine Map dataset consists of following objects: buildings and other structures, land use and legal regimes. In order to complete the cadastral data, data about buildings and other structures were used and linked to cadastral parcels data and related information. D ata from C ity of Požega C ommunal Information System ( C IS) ( C roatian: K OM IS) consisted from database export provided in E xcel file (NK N) . E ach row contained information about the real estate, owner, address, billing address, area of property and the amount of utility charges. A ddresses were not formatted accordingly to the spatial units’ address records, which caused
some problems in joining the official data to C ity of Požega address register ( L iker B ožičević and Obad et al, 2015), defining the attributes and their domains, which will be more suitable for automatic data processing. However, the data was formatted using the old address model, which is basically formatted as points with some attribute data. Other parts of the R SU are administrative borders registers: register of regional self-government units - counties, regi ster of settlements, register of cadastral municipalities, and register of postal delivery areas. D igital orthophoto (D OF ) was used as a base map. Majority of the input data – digital cadastral plans, R SU, L M for objects, and D OF datasets were provided by S G U for the study purposes.
2.3 D ata collection
D ata were collected by five teams formed by students from the faculty of geodesy in Z agreb, C roatia, that participated at the summer students practice. Mobile GIS devices T rimble J uno 3B with integrated high sensitive GPS recei ver with R eal-time measurement accuracy 2-5 meters and integrated 5Mpix camera together with pre-installed mobile GIS software E S R I A rcPad were used. C ustomised form for creating and editing the feature attributes was developed using A rcPad Studio ( R usmore, 2002) and attached to the dataset created for observation points within indi vi dual surveying groups ( F igure 3) .
F igure 3. Snapshot of the form for collection and editing the
feature attributes to the observed field measurement
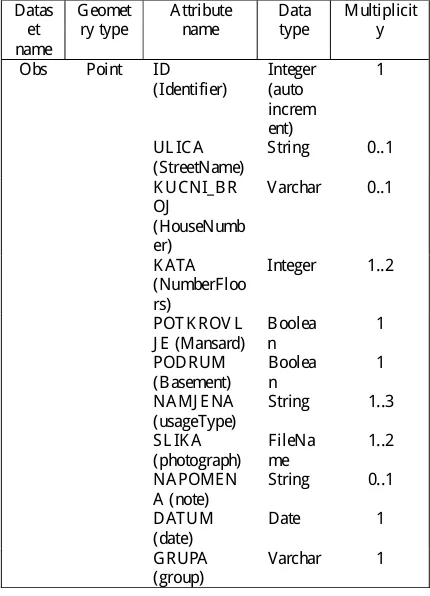
T he data model developed for field measurements (T able 1) comprised of basic object identification information as identifier (id) , the name of the street (Ulica), the house number ( K ucni broj), the number of floors (B roj katova) , whether an object has a mansard ( Potkrovlje) , and whether an object has a basement (Podrum) that are detectable to be in use. T he second group was devoted to identify the actual usage of the object by the predefined list of values origi nating from C IS NK N (e.g. residential, business, etc.). Since one object may have multiple
usages, e.g. residential and business, multiple options were provi ded. T he last step in the work plan was to take pictures of an object, which should represent the exact representation of the status described by the previous information.
T able 1 Data model designed for field observations
F ourteen students were divided into five working groups, each havi ng two T rimble J uno devices to perform data collection within the selected observation zone ( F igure 2). T he reference data as D OF address points dataset from R S U and objects features dataset from L M were preloaded into the working devices and used as background and supporting layers.
2.4 D ata pr ocessing QGIS open source desktop GIS ( F igure. 4).
F igure 4. Integration of field observations with objects’ features
from L M dataset in QGIS
F or easier manipulation and calculations, the input datasets of cadastral parcels, L M updated by field observations and C IS NK N were imported into the PostgreSQL DB MS with PostGIS extension ( T sou and S mith, 2011). T he first essential step was to join the non-spatial dataset of C IS NK N with two and half dimension ( areas + number of levels) spatial dataset from the L M. T he join was performed on the full addresses of objects available in both NK N and L M datasets. Since the address system in C roatia does not provi de any unique identifier of an object within an administrative unit, the full address containing street name, house number and village name had to be used in order to avoid mismatching of the objects from different villages having the same street name and number. In addition, some of the addresses available in C IS NK N did not have proper entries, thus some semi-automatic regular expression based and manual corrections had to be applied. A fter the joining step, the non-spatial data were extended by geometries and further extended by new areas taking into account geometric areas, number of levels, areas coefficients defined for mansards and basements and other inputs. A nother issue with demand for final result is that areas should be net areas (without areas of walls) F or that reason, empiric coefficient was used to reduce area from geometries of object, and coefficients for some areas (basements and mansards) were applied according to C roatian law regulation, and C ity of Požega C ouncil decision on communal tax. T he secondary objects available in the L M dataset and located within the same polygon feature of a cadastral parcel were connected to non-spatial information assigned to the main object observed in the field.
2.5 D ata publication and ver ification
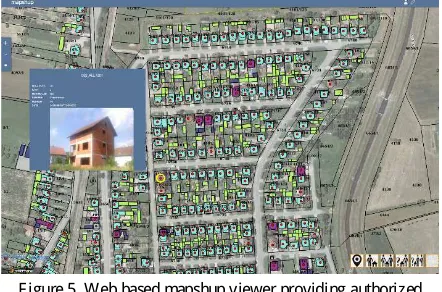
In order to facilitate the data verification process and provide a presentation layer for the local government representatives and citizens, all relevant datasets were first published using standard geospatial web services as W eb Map or V iew Service for data portrayal and W eb F eature or D ownload Service ( K liment et al, 2012) for data manipulation. B oth desktop and W eb based access to final datasets is made available via QGIS desktop GIS and mapshup web client application (Gasperi et al, 2013) ( F igure 5). B oth applications access the data from common database underneath the deployed SD I.
F igure 5. W eb based mapshup viewer providing authorized
portrayal access to field observation data, newly developed
datasets of objects and cadastral parcels
T he citizens, who are at the same time the communal tax payers can facilitate personalized access to the geographic features they own together with the newl y calculated characteristics as areas based on geometric area, number of floors, existence of basement and / or mansard using the web browser. In addition, citizens can also see the data collected during the field campaign including
the photograph of an object. A ccess to the data from both desktop and W eb environment is restricted by username and password which could be generated for each citizen available in the original C IS NK N dataset and identified by OIB ( C roatian: Osobni identifikacijski broj), a personal identification number.
3. R E SUL T S A ND D I S C US SI ON
Overall dataset observed in the field ( object polygon features available in the L M dataset) were represented by 7645 observations collected within a period of fi ve working days ( F igure 6). T his number of objects was used for further processing in order to produce updated C IS NK N datasets restricted to those objects visited in the field.
F igure 6. Geographic distributions of all observations collected
by working groups and example of attributes for selected
observation
T he first step of data processing aimed at joining the geometry data from L M dataset updated by observations with input C IS NK N dataset. T he joining process was based on the object’s full address concatenated from a street name, house number and a town name (e.g. HR V A T S K IH B R A NIT E L J A 14 POŽE G A ) . T he original C IS NK N dataset consisted of total amount of 11077 records, 7700 objects and 9715 owners. T he dataset created after the join based on the full addresses consisted of 8396 records, 6724 objects and 7463 owners. T he reason of decreased number of records was the inconsistency of addresses between R SU and C IS NK N that could not be fixed by automatic procedures and have to be fixed manually. T he matching table (matching addresses between the old system and the new data collected) was created and will be extended and completed by local government employees in order to increase the final number of matched objects.
T he next step was to divide the joined table to one dataset representing objects having single owner and one dataset for objects having multiple owners ( F igure 7) . T he reason of this action was to calculate a coefficient of a share based on area division originating from C IS NK N dataset. T he dataset representing the relation one object and one owner contained 5928 objects and the other one representing the relation one object and multiple owners had resulted in 796 objects. A dditionally, the processing step extended the total number of objects by assigning the owner to the secondary objects located with the same cadastral parcel boundaries as the main objects havi ng the owner previousl y. T his step resulted in other two datasets, one representing newly assigned secondary objects for those main objects having a single owner and one representing secondary objects sharing multiple owners of the main objects ( F igure 7). T he dataset aggregating data of one object having one owner resulted in 8259 objects and dataset of one object having multiple owners in 1089 objects. T he total amount of objects
updated and newl y defined was 16072, which represented 73% of the total amount of objects available in the L M dataset (21991 objects). C omparing to the input C IS NK N dataset, the result provi ded an increase of 45% in total amount of records defining the connection of objects and related owners. Nevertheless, this number will increase after the full address issues will be fixed in the matching table.
F igure 7. Preview of sample data from newl y devel oped
database categorized in four object datasets in QG IS desktop
GIS
In order to avoid rough errors, some key issues needed to be resolved for final deli verable of newl y developed database:
1. Object with area smaller than 5 m2 were erased 2. R ecords from NK N with usage code for unbuilt construction parcel were excluded from joini ng
3. Objects from L M dataset with certain range of usage codes were excluded from calculations due to C ity C ouncil decision on exemption from payment on certain categories ( religion objects, objects in C ity property, schools, etc.)
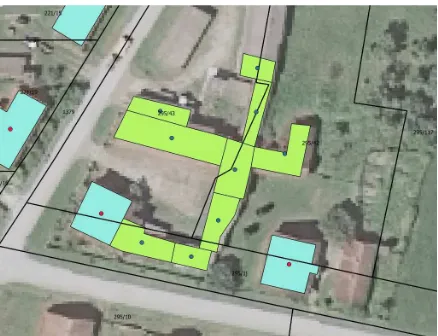
D ue to spatial inconsistency between the parcels ‘ boundaries in the authoritative cadaster dataset and object polygons from L M dataset, the owner assignment for secondary objects applied spatial function determining if L M object centroid geometry is completel y in pol ygon geometry of a cadastral parcel. In addition, some cadastral areas had the shift bigger what caused incorrect assignment. A s example some secondary objects whose centroids have topologically fallen into e.g. a road parcel were not assigned to any owner, or assigned a wrong neighboring owner ( F igure 8) .
F igure 8. E xample of spatial inconsistency of reference L M and
cadastral data resulting in wrong or none owner assignment
T hese objects had to be fixed manually by moving the centroids into an appropriate parcel based on the owner of the main object and triggering the function assigning the ID of the parcel to those objects having their centroids within.
3.1 R esults in cadastr al municipalities with cadastr al maps made after year 2000 with new cadastr al sur vey
W ithin the cadastral municipalities ( C M) K O V idovci and K O D ervišaga the results provided the figures that are summarized in T able 2:
C M Objects in NK N
Objects after the project
Overall area
Overall area after the project
K O V idovci
547 1198 72549 80334
K O D ervišaga
301 749 32086 49320
T able 2 R esults in Požega's cadastral municipalities with
cadastral maps made after year 2000 with new cadastral survey
In these cadastral municipalities there was no cases like described above (spatial inconsistency between the parcels ‘ boundaries in the authoritative cadaster dataset and object polygons from L M dataset) . A dditionally, there was not so many problems in dividi ng areas to owners of properties, which have more than one owner, since information on owners, and ownership ratios are up to date and can be easily found. T herefore, project calculations gave highly reliable results for these cadastral municipalities.
3.2 Per sonalized viewer f or data por tr ayal and ver ification
In order to provide the citizens an easy way to preview and verify the new data about their properties, a personalized web based geospatial viewer was developed and made available via Internet ( F igure 9) . T he main goal was to provide a possibility to check the quality of the data directly by property owners, thus the tax payers.
F igure 9. E xample of spatial inconsistency of reference L M and
cadastral data resulting in wrong or none owner assignment
E ach tax payer can log into the personalized portal, which automatically zooms to the extent based on his / her objects available in the newl y created datasets. Information about each main object contain data about the owner name, full address, usage type ( e.g. residential building) , area from ori ginal C IS NK N dataset, newly calculated area based on geometry from the L M dataset, number of fl oors, mansard and basement information observed in the field, the total area, coefficient and divided area for multiple owner’s objects. Narrower amount of information is
provided for secondary objects as area calculated from geometry, usage type (e.g. ancillary building) , full address assigned, and the total area used for tax calculations. T otal areas represent the final amount of square metres after applying all the reduction coefficients for firstly the net areas (0.85), areas of basements or mansards (0.50) and secondary objects (0.50) . T he coefficients are applied on the area calculated from the objects geometry. A ll this information provided to the citizens can be verified by accepting the content of the information window. E ach accepted feature is flagged in the database as valid and thus can proceed for the new tax calculation based on new total area. On the other hand, those objects identified as having incorrect information are flagged as invalid and further investigation is required. E ither the local government employee is send to the field or the owner is invited to the city office for further explanations and clarifications. T hese objects are in the queue for new tax calculation until the issues are resol ved.
T he main reason of using citizens as V GI to verify the quality of the data was lack of resources available in the local government that could not perform the check of almost 20 thousand objects within an area of 80 km2 in a realistic way.
4. C ONC L U SI ONS
T he time brings changes, and awareness of the need to understand interdependencies of environmental and social phenomena. T oday, just the knowledge of availability of spatial data is not enough, neither for city employees nor for ordinary citizens. T hey want and they need more spatial data needed for sophisticated processing and analysis models that can turn data and information into insight and intelligent action. T his is the way to support and empower local government i mplementing the e-governance processes on the municipality level.
In this paper we presented the methodology to integrate the data collected following participatory approaches with authoritative datasets made available by national bodies responsible for geospatial data into a common platform based on SD I principles. In addition, we proposed to use V GI principles in order to run data validation processed controlled by citizens, the property owners who are obliged to pay the tax. W ith this respect we developed personalized web based access to the newl y developed datasets of object features and related characteristics. T he verification process has been launched recentl y and is expected to end in next two months. T he research project resulted in a database containing valuable information about buildings within the district of city of Požega and surrounding suburbs, which represents a valuable source for the developing local SDI.
A C K NOW L E D G E M E NT S
T his work was supported by C ity of Požega, and C roatian Science F oundation under the project 7714 “D E ML A S” and by NE W L E F PR O project of the Government of the R epublic of C roatia and the Ministry of Science, E ducation and Sport co-financed through the Marie C urie grant agreement no. 291823. Horticulture and L andscape E ngineering F aculty of the S lovak Uni versity of A griculture provided the professional instruments used for the field works.
R E F E R E NC E S
C oleman, D . J ., G eorgiadou, Y ., & L abonte, J . (2009) . V olunteered geographic information: T he nature and motivation of produsers. International J ournal of Spatial D ata Infrastructures Research, 4(1) , 332-358.
E rik de Man, W . H. (2006). Understanding SD I; complexity and institutionalization. International J ournal of Geographical Information Science, 20(3) , 329-343.
Gasperi, J ., Peyrega, C ., D inot, S., B oileau, Q., Manin, A ., & Heurteaux, V . (2013, A pril). W eb Processing Service for assisted land cover classification. In: E GU General Assembly C onference A bstracts ( V ol. 15, p. 6087).
George, E . S. ( 2006). Positioning higher education for the knowledge based economy. Higher E ducation, 52( 4), 589-610.
Goodchild, M. F . ( 2007). C itizens as sensors: the world of volunteered geography. GeoJ ournal, 69(4) , 211-221.
K liment, T ., T uchyňa, M., & K liment, M. ( 2012) . Methodol ogy for conformance testing of spatial data infrastructure components including an example of its i mplementation i n Slovakia. Slovak J ournal of C ivil E ngineering, 20(1) , 10-20.
L iker B ožičević, M., Obad, T . ( 2015) : A dresni registar. In: National Spatial Infrastructure D ays 2015, 15.-16. October 2015, F aculty of Geodesy, Z agreb.
M iranda, T . S., L isboa F ilho, J ., S ouza, W . D ., S ilva, O. C ., & D avis J unior, C . A . (2011, September). V olunteered geographic information in the context of local spatial data infrastructures. In: Urban Data Management Symposium, pp. 123-138.
Narodne novine ( Official Gazette) : L aw on State Survey and the R eal Property C adastre, 16/2007.
Nebert, D . D . (2009) . T he spatial data infrastructure cookbook.
R oić, M. ( 2012) . L and Information Management: C adastre ( Upravljanje zemljišnim informacijama: katastar). Manualia Universitatis studiorum Zagrabiensis, F aculty of Geodesy Uni versity of Z agreb, 2012.
R ožić, N., L emajić, S., & R apaić, M. ( 2003, October) . C roatian-Norwegian geoinformation project. In: Proceedings of the ISPRS WG V I/3 Workshop ( pp. 224-227).
R usmore, M. E ., (2002): T eaching A dvanced F ield Mapping on Hand – Held C omputers. In: 2002 D enver Annual Meeting.
Šiško, D ., V eselić B ruvo, J ., & B atić, S. ( 2012). Z agreb SD I-T ool for Sustainable Spatial Management. In: INSP IRE C onference 2012.
T sou, M. H., SMIT H, J . (2011) F ree and Open S ource software for GIS education. In: Un-published W hite Paper Prepared for the GeoT ech C enter. L ouisville, USA : NGT C E . 18 p