MONITORING GLACIER VARIATIONS IN THE SOUTHERN PATAGONIA ICEFIELD UTILIZING IMAGES LANDSAT 7 ETM+
Luís Felipe Ferreira de Mendonçaa
1
CEPSRM, Universidade Federal do Rio Grande do Sul, Porto Alegre, Brazil. [email protected]
COMMISSION VIII, WG VIII/10 - Cryosphere
KEYWORDS: Cryosphere, Glaciology, Glacier Variation, Landsat 7, Database ABSTRACT:
The monitoring of the variation in glacier areas is increasingly important with the apparent trend of global warming. One of the major ice sheets on the planet, the main glaciers of Southern Patagonia Icefield were mapped using a set of images obtained in 1973, 1976, 1979, 1986, 2005 and 2009 by the ETM + sensor onboard the Landsat 7 satellite. The images were calibrated to planetary radiance and reflectance, where the supervised classification of each image sought to obtain the physical limit of the snow with each glacier. Maps were generated with the terminal position of the glacier tongue for the dates analyzed. The results were compared with previous publications and showed peculiar behavior of each glacier, especially from the images of 1986, where there was a pattern of decrease in surface area of glaciers. And the temporal analysis will show the behavior of glaciers to the present day.
1. INTRODUCTION
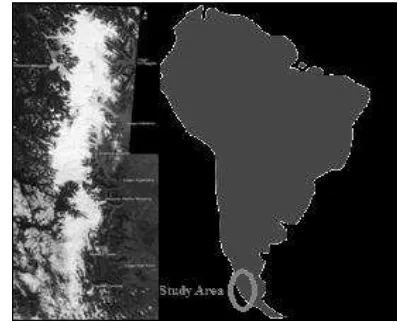
The Patagonian Ice Field is the second largest glacier in the Southern Hemisphere. Located at the southern tip of South America, moves on the border between Argentine and Chilean territories. Composed of two large regions: the Northern Patagonia Icefield (NPI) and the Southern Patagonia Icefield (SPI), with areas of approximately 4.200 km² and 13.000km² respectively. In the light of an apparent trend of global warming in recent years, it is important the monitoring of the variations of several glaciers on a global scale. With emphasis on temperate glaciers, which tend to respond to climate changes in a relatively short period of time.
With the passing of years the studies about global warming, and the behavior of glacier areas, have been intensified all over the world. With the Patagonian ice field wasn’t no
different and several authors have studied its glaciers since 1950.
Figure 1. Study area – Mosaic of two digital photographs of Southern Patagonia Icefield.
RIVERA, 1999), Tyndall (CASASSA, 1992; RAYMOND, 2005) and O’higgins (KRIMMEL 1988).
Estimates indicate that Southern Patagonia Icefield will reduce of 38,7±4,4km³/year between the years 1975-2000, suggesting an acceleration rate of melting quite high. The Intergovernmental Panel on Climate Changes (2007) showed that the losses accumulated since 1960 in Patagonia are approximately 40m ice thickness, calculated over the glacier (LEMKE et al., 2007). This study aims to calculate the surface area of the main glaciers of Southern Patagonia Icefield through the digitalization of Landsat 7 ETM+ images obtained in the years 1973, 1976, 1979, 1986, 2005 and 2009.
2. DATA AND METHODOLOGY
The Southern Patagonia Icefield limited by coordinates to 74º10’-73º30’W and 48º20’- 51º30S is approximately 60km wide, 350km in length and a total area of 13.000km². The glaciers studied were selected based on size, location and the existence of past studies to compare the results. The digitization and classification was done from a database of 24 images of the ETM + sensor aboard the Landsat 7 satellite, with a spatial resolution of 30m and georeferenced in WGS84 datum obtained in the years 1973, 1976, 1986, 2005 and 2009. The images were acquired in the virtual portals of United States Geological Survey (USGS) and National Institute for Space Research (INPE).
The methodology was developed with help of software ENVI 4.5 © 2008 and CartaLinx 1.2 © 1999 where Landsat images were calibrated to radiance and reflectance for a global standardization method. The calibration procedures employed in this study were used according to Chander and Markham (2003).
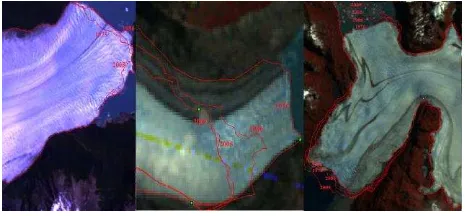
Figure 2. Linhas de variação na posição da língua das Geleiras Upsala, Jorge Montt e Tyndall. Geradas a partir de imagens Landsat 7 ETM+ para os de
1973-1976-1979-1986-2005-2009.
The digitization of each glacier was made in order to obtain the limiting position of the tongue (Figures 2 and 3), where each image was classified individually to avoid overlapping the range of pixels. Areas composed of multiple regions and pixel border between snow and sediment were excluded to avoid overlapping values and false classifications. Been generated lines of advance indicating the ceiling for each glacier for the period analyzed. Researchers such as Warren & Sugden (1993) and Aniya et al. (1992, 1996) showed that the main glaciers of Southern Patagonia Icefield presented until the beginning of the decade 90 a general pattern of decline and reduced its volume, with exception of some glaciers showed a profile of frontal accretion and growth.
Figure 3. Linhas de variação na posição da língua das Geleiras Moreno, O’Higgins e Bruggen. Geradas a partir de imagens Landsat 7 ETM+ para os de
1976-1979-1986-2005-2009.
ending northwest at coordinates 48°18'S and 73º27'W. With an area of 602km² in 1976 lost 63km² of total ice surface in the period 1976 -1986 reaching 555km². The data obtained from the Landsat image of 2005 show a dramatic reduction in the volume of the glacier after a decrease of 10.060m reached a surface area of 198km². Image data from 2009 show that an increase of 8km² ice surface area increased the total area of the glacier to 206km², due primarily to an advance of the tongue of 1,3km.
Brϋggen Glacier: It is the only studied glacier on the west side of the Southern Patagonia Icefield and is among the highest volume glaciers. Located at 49º10'S – 75º53’W has its terminal part forked north toward the lake Greve and south to the Eyre fjord. In recent decades, it has shown a very unusual behavior compared to other glaciers in the Southern Patagonia Icefield, opposed the others it has increased its area with a steady growth of the tongue through the years. With an area of approximately 1.604km² in 1976 was increased its total area to 1.653km² after a breakthrough of 800m in image 1986. The data show that the tongue North increased 21km² in the period 1976-1986 while the tougue area south maintained your area stable. The image of 2005 shows a decrease in the glacier total area of 148km², but the tongue north continued to grow about 550m. The pattern of growth recorded by other authors in the images obtained in 2009 the glacier increased its 130km² in total area compared to 2005. Adding in the period 1986-2009 a total advance of approximately 18km².
O'Higgins Glacier: Located in upper side of the ice field at coordinates 48°54'S and 73º12’W, ends in an arm of Lake O'Higgins, who on the Argentine side is known as Lake St. Martin. This glacier has shown a very large number of recessions between 1945 and 1986, with a
total of 13,4km (327m/year) this value was considered exceptionally large in Patagonia, including the glaciers of the Northern Patagonia Icefield (ANIYA, 1988). With a total area of 440km² in 1976 it had its area decreased to 376,9km² after a decline to 1.460m and a loss of 63,1km² in 1986. With lower indices of decline since the decade of 90 the glacier has reduced its total area to 347km² in 2005, reaching 329,2km² in 2009.
Upsala Glacier: Considered one of the largest glaciers in South America, Upsala is located on the east side of the ice field in the coordinates 49º51'S and 73º16'W.It had retreated constantly until the decade of 60 (ANIYA, 1992), passing at a decline rate of decline of 2.300m (135m/year) during the period from 1969 to 1986, measured near the center of the glacier. Values obtained for the glacier in this study showed a surface area for the year 1979 of 1.596km² and 1.447,4km² in 1986, declining approximately 2.100m and a lost area of 148,6km² area in the period 1979-1986. Between the years 1986 and 2005 the loss was 377km² on the surface, to come in 2009 with a total area of 917,4km², reducing approximately 530km² in the period 1986-2009.
for the total area of glacier were 513km² in 2005 and 507km² in 2009. This type of behavior less intense shows that for understanding the
dynamics of the glacier we need annual data and field studies, in order to know the real evolution of the glacier along time.
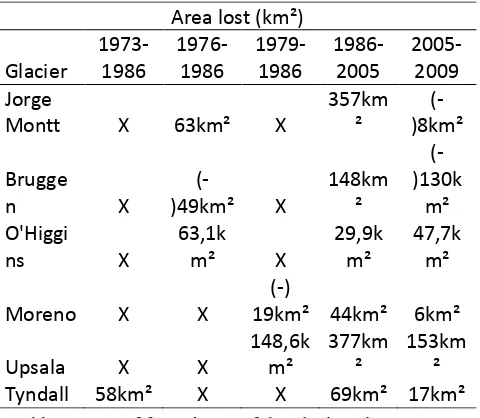
Tyndall Glacier: Is the glacier studied more to the south of the Southern Patagonia Icefield with approximately 40km in length, flows into the lake pro-glacial Geikie originated from it. Located in the coordinates 51º12'S - 73º18'W and is adjacent to the famous mountain of Paine. In 1973 the glacier had a total surface area of 507km² that after a decline of approximately 750m had its area reduced to 449km² in 1986 and since then has suffered intense retreats of the tongue and reduction of the glacier total volume. Data from 2005 show a surface area of 380km² in a decrease of approxi-mately approxiapproxi-mately 1.300m of tongue in relation to 1986. For the year 2009 images important not only for the calculation of area, flow and speed, but in order to gain know-ledge about the behavior of ice masses. The data in Table 1 show a evident tendency of retreated the glaciers from the first images. The exception Bruggen glacier that during the study period showed a growth profile in the region of discharge and body of the glacier. Upsala and Jorge Montt glaciers obtained the greatest loss of mass, with very accelerated process of retraction from the 90's. Jorge Montt is glacier studied with more troubling levels of retraction and volume loss, reaching approximately 50km²/year of ice area lost. The Moreno glacier
showed during the century alternations of frenquent advances and retreats, with a behavior considered stable in your area during the years analyzed.
Table 1. Loss of frontal area of the glaciers due to retreat - 1973-2009.
detailed studies in order to we be able to conclude that these variations in the body of the glaciers are really caused by global warming. However, it appears that the recent rapid recession is a response to the recent world-wide warming trend.
4. ACKNOWLEDGEMENTS
The authors are grateful to United States Geological Survey (USGS) and National Institute for Space Research (INPE) by images.
5. REFERENCES
ANIYA, M., 1988. Glacier inventory for the Northern Patagonia Icefield, Chile, and variations 1944/45 to 1985/86. Arctic and Alpine Research, 20: 179-187.
ANIYA (1), M., and SKVARCA, P., 1992. Characteristics and variations of Upsala and Moreno glaciers, southern Patagonia, Bulletin of Glacier Research, 10:39-53.
ANIYA (2), M., NARUSE, R., SHIZUKUISHI, M., SKVARCA, P. and CASASSA, G., 1992. Monitoring recent glacier variations in the Southern Patagonia Icefield, utilizing remote
sensing data, International Archives of
Photogrammetry and Remote Sensing, 29(B7):87-94.
ANIYA, M., SATO, H., NARUSE, R.,
SKVARCA, P. and CASASSA, G., 1996. The use of satellite and airbone imagery to inventory outlet glaciers of the Southern Patagonia Icefield, South America. Photogrammetric Engineering and Remote Sensing, 62, pag. 1361-1369.
CASASSA, G., 1992. Radio-echo sounding of Tyndall Glacier, southern Patagonia. Bulletin of Glacier Research, 10: 69-74.
CHANDER, G., MARKHAM, B., 2003. Revised
Landsat-5 TM Radiometric Calibration
Procedures and Post calibration Dynamic Ranges, IEEE Transactions on Geoscience and Remote Sensing, Vol. 41, Nº 11.
IWATA, S., 1983. Further advance of Pio XI Glacier. In Glaciological and Meteorological Studies in Patagonia, Chile, by Japanese Research Expeditions in 1967-1982 (Data Center for Glacier Researches, Japanese Society of Snow and Ice), 14- 17.
KRIMMEL, R. M., 1988. Terminus of Glacier O'Higgins, southern Chile. Journal of Glaciology, 34 (116): 142.
LEMKE, P., et al. 2007., Observations: Changes in snow, ice and frozen ground, in Climate Change 2007: The Physical Science Basis. Contribution of Working Group I to the Fourth Assessment Report of the Intergovernmental Panel on Climate Change, edited by S. Solomon et al., pp. 337– 383, Cambridge Univ. Press, New York.
RAYMOND, C., NEUMANN, I., RIGNOT, E., ECHELMEYER, K., RIVERA A. and CASASSA G., 2005. Retreat of Tyndall glacier, Patagonia, over the last half century. Journal of Glaciology.
ROOT, H., STUEFER M., SIEGEL A., SKVARCA P. and ECKSTALLER A, 1998. Mass fluxes and dynamics of Moreno Glacier,
Southern Patagonia Icefield. Geophysical
Research Letters, 25 (9), 1407-1410.
RIVERA, A. and Casassa G., 1999. Volume changes of Pío XI glacier: 1975-1995. Global and Planetary Change, 22(1-4), 233.
SKVARCA, P., SATOW, K., NARUSE, R. and LEIVA, J., 1995. Recent thinning, retreat and flow of Upsala Glacier, Patagonia, Bulletin of Glacier Research, 13:ll-20.
STUEFER, M., 1999.. Investigations on mass balance and dynamics of Moreno Glacier based on field measurements and satellite Imagery. PhD
dissertation, Leopold-Franzens-Univesitat,
Innsbruck, p. 173.