USE OF A LIGHT UAV AND PHOTOGRAMMETRIC TECHNIQUES TO STUDY THE EVOLUTION OF A LANDSLIDE IN JAÉN (SOUTHERN SPAIN)
T. Fernándezac*, J. L. Pérezac, F. J. Cardenalac, A. Lópeza, J. M. Gómeza, C. Colomoa, J. Delgadoa, M. Sánchezbc
a
Dept. Cartographic, Geodetic and Photogrammetric Engineering, University of Jaén - (tfernan, jlperez, jcardena, alarenas, jdelgado)@ujaen.es,(jmgl003, cmcj003)@red.ujaen.es
b
Dept. of Geology, University of Jaén – [email protected] c
Advanced Research Center on Earth Sciences, University of Jaén
Commission IV, WG IV/7
KEY WORDS: UAV, photogrammetric techniques, evolution, landslide, Spain
ABSTRACT:
This paper presents a methodology for slope instability monitoring using photogrammetric techniques with very high resolution images from an unmanned aerial vehicle (UAV). An unstable area located in La Guardia (Jaen, Southern Spain), where an active mud flow has been identified, was surveyed between 2012 and 2014 by means of four UAV flights. These surveys were also compared with those data from a previous conventional aerial photogrammetric and LiDAR survey. The UAV was an octocopter equipped with GPS, inertial units and a mirrorless interchangeable-lens camera. The flight height was 90 m, which allowed covering an area of about 250 x 100 m with a ground pixel size of 2.5 cm. The orientation of the UAV flights were carried out by means of ground control points measured with GPS, but the previous aerial photogrammetric/LiDAR flight was oriented by means of direct georeferencing with in flight positioning and inertial data, although some common ground control points were used to adjust all flights in the same reference system. The DSMs of all surveys were obtained by automatic image correlation and then the differential models were calculated, allowing estimate changes in the surface. At the same time, orthophotos were obtained so horizontal and vertical displacements between relevant points were registered. Significant displacements were observed between some campaigns (some centimeters on the vertical and meters on the horizontal). Finally, we have analyzed the relation of displacements to rainfalls in recent years in the area, finding a significant temporal correlation between the two variables.
1. INTRODUCTION
The use of photogrammetric techniques in the study of landslides, and especially in analyzing its evolution, is becoming increasingly widespread (Walstra et al., 2004; Cardenal et al., 2006; DeWitte et al., 2008; Kasperki et al.,
2010; Prokešová et al., 2010; Fernández et al., 2011, 2012). In these studies, the image block orientation is based on aerial triangulation techniques and bundle adjustment, using a small number of ground control points (GCP) measured with GPS. After image orientation, digital elevation models (DEM) are calculated by automatic matching techniques. Based on different DEMs from successive epochs, some quantitative approaches (such as obtaining differential DEM between campaigns, topographic profiles, volumetric calculations and 3D displacement vectors), but also observations for qualitative characterization of movements, can be addressed.
Meanwhile, unmanned aerial vehicles (UAV) have been expanding their uses in civil matters (Nonami, 2007) such as in precision agriculture (Grenzdorffer et al., 2008), civil defense and fires (Maza et al., 2011), and more recently in engineering, environment and surveying. In the case of landslides, the employment of UAVs ranges from support to other remote sensing techniques (Gong et al., 2010), to other techniques such as landslide inventories by photointerpretation (Lin et al., 2010), the study of the effects of catastrophic events (Yeh et al., 2011) or the assessment of the exposure of buildings or infrastructure to landslides risk (Liu et al., 2011). In other cases, more complex analyses have been developed, obtaining DEM and orthophotographs of several campaigns from which the
evolution of movements can be addressed by measuring –in a more or less automatic way- vertical and horizontal displacements (Niethammer et al., 2012; Fernández et al., 2013, 2014; Turner et al., 2015) or by analyzing the fissures in the mobilized mass (Stumpf et al., 2013).
In this work we have used an UAV to capture high accuracy and resolution field data in a quick and effective way. From the photographs taken at a given height, stereoscopic models are obtained that allow, on one hand, the detailed observation of terrain features; and on the other, the development of DEMs and orthophotos. Comparing data from a different UAV surveys and a previous photogrammetric flight at 2010, the evolution of a mud flow and some data on its activity and diachroneity can be studied (Chacón et al., 2010 ).
2. STUDY ZONE AND LANDSLIDES
The area is located in an agricultural land on the hillslope above the A-44 highway in La Guardia de Jaén (Southern Spain, Figure 1). In this area there are a large number of movements evidences (Fernández et al., 2012 b). Most of them correspond to mud flows (Varnes, 1978) such as the studied movement (Figure 2), although there are also slide-type movements. They are located on the geological Guadalquivir Units, a set of materials with a complex structure and nature, in which predominate the following formations: Triassic evaporites and shales, Cretaceous-Paleogene marls and clays of an affinity with Subbetic Unities, and Miocene loamy-clay sediments belonging to the Guadalquivir basin.
In this area, the units of the Guadalquivir are override by Intermediate Betic Units represented by powerful series of pleated Middle Jurassic limestones (Navarro et al., 2012), which form a prominent relief. This thrust is cut by normal faults oriented NNW-SSE. Both type of tectonic accidents present geomorphological and seismic evidence of activity (Sánchez-Gómez et al, 2008), which may be related to the elevation of the reliefs and the latest instability of slopes. The contact is dotted with small alluvial fans, powerful foot slopes tanks and travertine, associated with sources or springs at the foot of the Jurassic limestones. Most of the travertine areas are involved in old movements, indicating a direct relationship between them and the springs. In the case studied, travertine crusts are observed over the sliding clays and loams, showing a sourcing of water more or less continuously.
Figure 1. Area location and distribution of flights.
Figura 2. Studied landslide.
3. METHODOLOGY
The methodology is based on digital photogrammetry techniques, used in previous works of the research group (Cardenal et al, 2006; Fernández et al, 2011), although with specific variants of the use of UAV (Fernández et al., 2013, 2014). It can be summarized in the following steps:
1. Data capture: planning and execution of the UAV flight. 2. Georeferencing and flights orientation.
3. Obtaining DSM and orthophotos. 4. Comparison of observation campaigns.
3.1 Data capture: planning and execution of the UAV flight For this study, there have been available four UAV flights of high resolution and accuracy between November 2012 and March 2014. Additionally, there has been available a previous photogrammetric flight, with both camera and LiDAR, in May 2010. The characteristics of the flights are shown in Table 1 and their spatial distribution in Figure 1.
Campaign Bands Format GSD LiDAR
Mar-2014 Digital 0,03 m No
Nov-2013 RGB Digital 0,03 m No
Mar-2013 RGB Digital 0,03 m No
Nov-2012 RGB Digital 0,03 m No
May-2010 RGB-NIR Digital 0,20 m Yes
Table 1. Properties of datasets and flights.
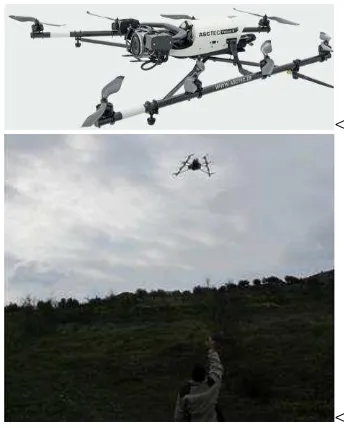
The flights from November 2012 and March 2014 were made with a light UAV, the Falcon 8 ASCTEC model from Ascending Technologies (ASCTEC, 2015), equipped with GPS, inertial system (IMU) and 8 rotors, allowing an adequate stabilization in air (Figure 3). It is controlled remotely with a mobile field station, although the flight can be programmed with an autopilot navigation system. It weighs about 2.2 kg (with full payload including camera, batteries and navigation systems). It uses a mirrorless interchangeable-lens camera (MILC) Sony Nex-5N (14.2 mpx) with a 16 mm wide angle lens. The flight range is up to 20 minutes.
<
< Figure 3. ASCTEC Falcon 8 model.
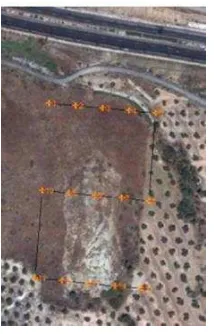
The flight planning was made once recognized the terrain, using the ASCTEC Navigator software. The parameters selected for the flight planning were the flying height above terrain (which determines the ground sample distance, GSD, or pixel size), the camera angle (vertical or oblique photographs), number of strips, number of waypoints per strip which determines the number of photographs, overlaps (both endlap and sidelap) and starting point), etc. The UAV flight planning has been the same for all the flights and it is shown in Figure 4. To cover an area of about 250 m x 100 m with 2.5 cm of GSD, it was necessary to fly about 90 m above the terrain, which means 15 photographs in 3 strips at different flying heights in order to maintain the same average GSD in all strips (Table 1).
Figure 4. Planning of UAV flight.
To compare with previous data, an aerial flight of 2010 has been used. This flight combined an aerial digital metric camera (Z/I DMC) and a LiDAR sensor (Leica ALS50-II) with GPS/IMU systems. The GSD of this flight was 20 cm.
3.2 Georeferencing and flights orientation
For orientation of UAV flights it has been necessary to survey 16 GCP well distributed, all around the unstable area but also some of them inside the area following conventional distribution of GCP networks for aerial triangulation (Kraus, 2007). The GCP were artificial circular shaped targets, easily identifiable in photographs, and they were measured by differential GPS with centimeter accuracy (Figure 5).
Figure 5. Measurement of control points using GPS positioning.
From these GCP and some hundreds of automatically measured tie points on the images, the photogrammetric orientation was made through a process of triangulation and bundle block adjustment (Kraus, 2007) and Structure for Motion (SfM) techniques. Two digital photogrammetric stations, Photoscan software (for initial calculations and DSM generation) and Socet Set DPW (for DSM edition, orthophoto generation and stereo analysis) were used.
On its hand, the 2010 flight was initially processed with the in-flight direct orientation parameters (GPS/INS), but in addition, a set of second order control points extracted from the UAV flights were used. These new control points allowed the refinement in the adjustment of the 2010 flight to a common reference system from the UAV flights. These new points were stable and clearly identifiable features in all flights, so points in unstable regions were avoided.
3.3 Obtaining DSM and orthophotos
The digital surface models (DSM) of all flights (UAV and 2010), were obtained by automatic correlation (matching) from stereoscopic oriented models, using the dense point cloud tools of PhotoScan software (Figure 6). In this case, unlike in previous works (Fernández et al., 2013), we work with DSM and not with DTM, because the area has a high density of vegetation (scrubs and bush has grown intensely in this last year as a result of rainfalls), so that DTM could not be obtained with reliability neither by automatic techniques (filtering) nor by editing the models in the photogrammetric workstations, which otherwise would consume a lot of time not justified. The resolution of the DSM is 0.1 m for UAV flights and 0.5 m for 2010 flight.
Orthophotos, shown in Figure 7, were obtained from models by corresponding software tools mentioned above. Orthophotos from UAV flights were obtained with a resolution of 2.5 cm, while orthophotos from 2010 flight have a resolution of 25 cm.
3.4 Comparison between observation campaigns
The comparison between observation campaigns has been based on the analysis of differences between the DSMs and orthoimages described above. The displacement measurements, based on orthophoto analysis, were made between relevant objects identified on them, corresponding to scrubs, trails or stones (Figure 7). So the orthophotos and DSMs of two consecutive campaigns were loaded and overlayed in Socet Set DPW. Therefore the measurements of the point coordinates and displacements between relevant points were determined in 3D with the stereo viewing tools of Socet Set DPW. With this methodology, the horizontal component of displacement is fairly accurate, while in the vertical component the accuracy is not so assured, despite the measurements were carefully made at the base of the scrub, close to the terrain surface.
The differential models have been obtained only for qualitative observations and not for quantitative estimations as in previous works (Fernández et al., 2012a, 2013), because is not possible to obtain DTM, and reliable comparison between DSM is only valid in areas without scrubs.
4. RESULTS AND DISCUSSION
As preliminary results, we can highlight first some qualitative aspects. From Figures 6 and 7, it can be observed a flow type movement (Varnes, 1978) with a well-developed back-scarp of about 2-3 meters high, in a closed head area, not having flat or counterslope shapes evidencing a rotation mechanism. Neither minor scarp is observed, but there are numerous cracks and hollows where water accumulates. The landslide crown has a semicircular shape, with some evidence of growth to upslope, but without back cracks beyond a few meters. This crown is transformed in two lateral flanks where a rise of the ground surface is observed.
The main body or mass is quite disorganized, with abundant transverse cracks, ending in a foot or accumulation zone well developed and extended downslope over the original ground. The estimated thickness of the mass is quite small (probably not more than 2 meters). So bearing in mind that the length is about 175 m, it means a depth-length ratio of about 1%, characteristic of movements of flow type.
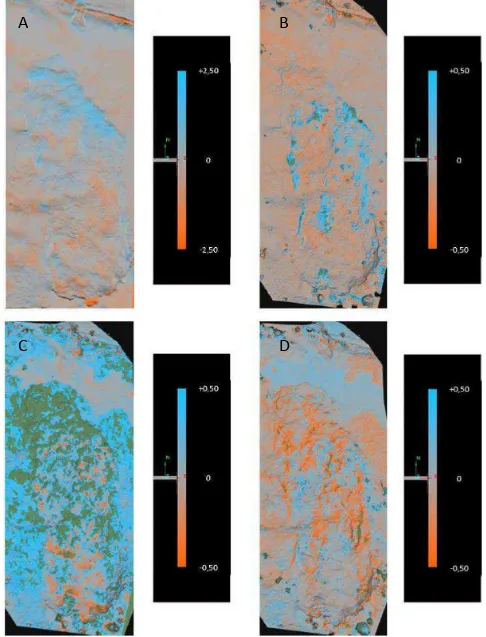
Figure 6. Landslide evolution. In orange: Areas where the DSM descends (depletion); in blue: Areas where the DSM ascends (accumulation or vegetation growth); green: Areas with changes out of range (intense growth of vegetation). A: May 2010-November
2012; B: November 2012- March 2013; C: November 2013- November 2013; D: November 2013-March 2014.
A
B
C
D
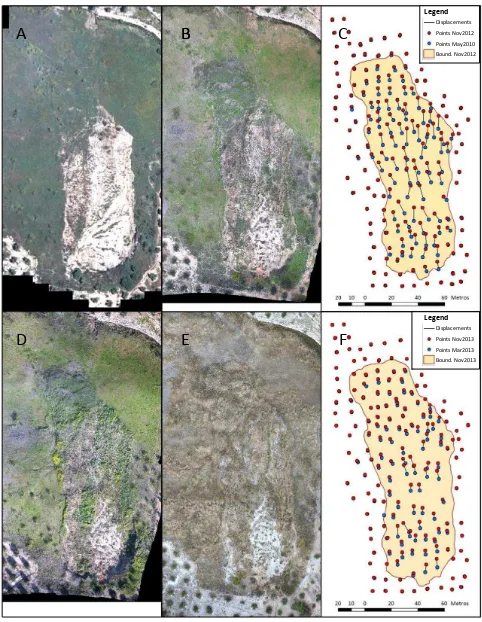
Figure 7. Orthophotos and horizontal displacements. A: Flight on May 2010; B: Flight on November 2012; C: Displacement vectors between flights on May 2010 and November 2012; D: Flight on March 2013; E: Flight on November 2013; F: Displacement vectors
between flights on March 2013 and November 2013.
A
B
D
E
C
F
B
Displacements Points Nov2012 Points May2010 Bound. Nov2012
Legend
Displacements Points Nov2013 Points Mar2013 Bound. Nov2013
Legend
The comparison between DSMs shows a certain evolution between 2010 and March 2014, showing the characteristics of depletion areas at the head and accumulation at the foot, which can be observed despite changes in vegetation between the different campaigns. This evolution is mostly related to some retraction of the slope above the crown producing terrain decreases of metric order. In addition, small decreases of the terrain surface in the order of centimeters are observed at the head, and small lifts in the order of decimeters are also observed at the accumulation zone of the foot (Figure 6).
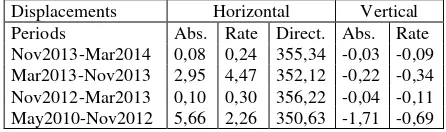
The analysis of the orthophotos (Figure 7) allows to detect horizontal displacements of metric order between 2010 and 2014, measured at relevant points of the mass corresponding to scrubs, paths or stones (Table 2), although the displacement has occurred in a discontinuous pattern, as it will be discussed afterwards. The evolution of the mass follows the general inclination of the hillslope close to the North although at the foot it turns slightly towards the NW. Likewise, it is observed a dispersion of the displacement vectors at the central area which is indicative of a certain characteristic mass spins flowing in a
Table 2. Average displacements of relevant points between observation campaigns.
The largest absolute displacements are observed in the first period considered (the longest on the other part) between May 2010 and November 2012 with 5.66 m on average that results in an average rate of 2,26 m/year. A period of inactivity is observed with virtually null displacements until March 2013, after which a recovery phase starts, with the highest rates of average displacement (4,47 m/year) until November 2013. Finally, a new period of stability between November 2013 and March 2014 is reached.
In addition to the surveys, the weather data from the meteorological station at the University of Jaén (Figure 8), close to the study area, indicates that the hydrological year 2009-2010, previous to the 2010 flight, was quite rainy, with heavy precipitations that caused numerous phenomena of instability slopes in the region (Fernández et al., 2012). From December 2009 to March 2010 rainfalls exceeding 500 mm (230% of the mean value for that period) were recorded. From the date of the reference flight at 2010 until November 2012, there have been two rainy episodes in autumns 2010 and 2012. In the first one, there was a cumulative rainfall of 415 mm between September and December 2010 (190% of the mean value); in the second, there was a cumulative precipitation from September to November 2012 of 283 mm (198% of the mean value). After these intense rainfalls, and after the first UAV flight in November 2012, the months of December and January were less humid, with values below average, although from February to April 2013 were recorded again heavy rainfalls up to 265 mm (279% of the mean value). Finally, the cycle of 2013-14 started fairly dry, although from December to February the rainfalls were slightly above average (120% of the mean value). The rest of the year is within the mean values or even below them.
Figure 8. Rainfalls at the station of the University of Jaén, next to the studied zone
From displacement data and precipitations of the study area, the following preliminary considerations can be drawn:
A well-developed landslide of flow type in a generally unstable zone has been observed, due to a geological context susceptible to these movements: loamy-clay materials, thrusting by a pack of carbonate rocks that provide water to the slope in the rainy season (it is proved by the springs and travertine crusts existing in the area).
The current flow is generated before May 2010, probably in the same hydrologic year because there are orthophotos from previous dates (National Plan of Orthophotographs, PNOA 2009) in which neither the mass nor the current escarpment is observed, although there are some evidences of instability (Fernández et autumn of 2010 related to first period.
Between November 2012 and March 2013 no major changes were observed, although the process was reactivated between March and November 2013, most likely due to rainfalls of March-April of that year, which were higher than in the autumn of 2013 that was quite dry. In fact, although from December began a new period of rainfalls, no activity has been observed between November 2013 and March 2014. Overall, the flow can be considered as active or
suspended, although the observation of previous orthophotos suggests a diachronic evolution (Chacón et al., 2010), which must be clarified with additional data.
5. CONCLUSIONS
The use of unmanned aerial vehicles (UAV) is a useful tool for fast, high resolution and precision surveys in areas of about 100 to 10.000 meters size. Until now, in the civil fields, they have been used in precision agriculture and civil protection, but it is beginning to be applied in engineering and, more specifically, in studies of slope instability including cliffs and road cuts, due to the possibility of making oblique photographs. UAV techniques can fill the gap between conventional aerial and terrestrial techniques with accuracies from 1 to 10 cm.
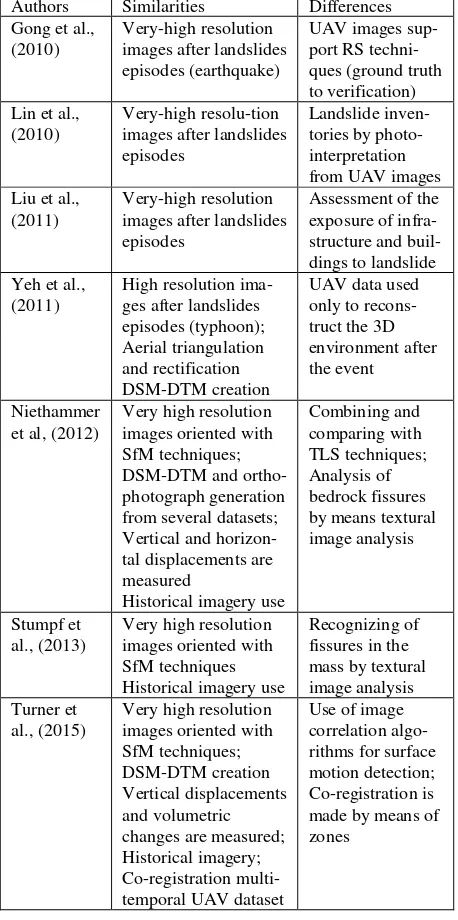
In this sense, light equipment, such as that used in this work, is well suited for updates and landslide monitoring, and so for disaster management as it is summarized in Tables 3 and 4. It allows working with intermediate scales between terrestrial techniques (GPS, classic surveying, terrestrial laser scanner, terrestrial photogrammetry, etc.) and aerial or space surveys (photogrammetry, VHR satellite remote sensing, LiDAR, InSAR). At this scale, detailed morphological features can be still observed, while allowing the cover of relatively large areas. Light UAVs are very agile and easy to operate compared to other heavier equipment. Also field surveys can be done within a few hours of work, including the measurement of ground control points (GCP).
Since these light UAVs can be also equipped with different sensors (infrared cameras, LiDAR, Radar, etc.), its potential will increase. The use of more conventional photogrammetric and Structure for Motion (SfM) techniques allows to orient UAV flights and to obtain DSM-DTM and orthophotographs from which vertical and horizontal displacements and volumetric changes can be calculated. Some works have made advances in co-registration methodologies of multi-temporal images datasets by means points or zones, and in development of algorithms for detecting surface motions (Table 3). However the elimination or reduction of GCP (a time consuming task) is not yet possible unless more accurate position and inertial systems can be used on board of light UAVs, although these new systems will soon be available.
Regarding the results obtained in this study, the UAV has allowed the characterization of the slope movement flow rate and some morphological features (slopes, lateral limits, tension cracks, landslide deposit, foot, etc.) on a hillslope of hectometric dimensions. Also the technique allows the monitoring analysis by measuring vertical displacements in the DSMs and horizontal displacements of relevant points in the orthophotos (Table 3). Both DSMs and orthophotos at different epochs have been obtained from aerial photographs of the UAV surveys and a previous photogrammetric flight at 2010, using a methodology based on conventional photogrammetric and SfM techniques (Tables 3 and 4). On its hand, DTMs are difficult to obtain and compare in a zone with changes in the vegetation state. So, it has been possible to measure vertical and horizontal displacements in the order of centimeters to meters between the different flights. These displacements have been correlated to the rain events that have occurred in the region between the different epochs.
Future work will deal with advances in the methodology, regarding the reduction of ground control points applying methods of direct orientation, and the automatic detection of incorporated both in the spectral domain (i.e. near and thermal infrared sensors) and in the geometric domain (LiDAR and RADAR). Even terrestrial probes (rain, humidity, movement) in wireless networks (WSN) can be used. Other areas of interest include mapping of morphological features, such as cracks or landslide limits, and the measurement of 3D displacement vectors that allow a better understanding of the movement
Table 3. Comparison of this study with similar other ones.
Method strengths Method weakness UAV use is optimal because of the readiness to mission planning and fast of image capture. UAV field work in small size areas is not time consuming. The used approach is fast since DTMs are not extensively edited,
Table 4. Strengths and weakness of the methodology used in this study.
ACKNOWLEDGEMENTS
This work has been supported by the project ISTEGEO RNM-06862 (Andalusian Research Plan), the project RICMI of the Technological Corporation of Andalusia and the PAIDI Research Group TEP-213.
REFERENCES
Cardenal, J., Delgado, J., Mata, E., González, A. and Olague, I., 2006. Use of historical flight for landslide monitoring. Proc. Spatial Accuracy 2006, Lisbonne, Portugal, 129-138.
Chacón, J., Irigaray, C., El Hamdouni, R. and Jiménez, J.D., 2010. Diachroneity of landslides. In: Geologically Active, Williams et al. (ed.), Taylor & Francis, London, UK, 999-1006.
Dewitte, O., Jasselette, J.C., Cornet, Y., Van Den Eeckhaut, M., Collignon, A., Poesen, J. and Demoulin, A., 2008. Tracking landslide displacement by multi-temporal DTMs: a combined aerial stereophotogrammetric and LiDAR approach in Belgium, Eng. Geology, 99, 11-22.
Fernández, T., Pérez, J.L., Delgado, J., Cardenal, J., Irigaray, C. and Chacón, J., 2011. Evolution of a diachronic landslide by comparison between different DEMs obtained from digital photogrammetry techniques in las Alpujarras, GI4DM, Antalya, Turkey. M., Cardenal, F.J., Delgado, J., Pérez, A., 2013. Empleo de una plataforma aérea ligera no tripulada (UAV) y técnicas fotogramétricas para el estudio de una zona inestable en la Guardia de Jaén. En: J. Alonso, J. Corominas y M. Hürlimann (eds.), VIII Simp. Nacional sobre Taludes y Laderas Inestables, Palma de Mallorca, Spain.
Fernández, T., Pérez, J.L., Arenas, A., Gómez, J.M., Cardenal, F.J., Delgado, J., 2014. Monitorización de laderas inestables mediante técnicas fotogramétricas a partir de vuelos UAV e históricos XVI Congreso Nacional de Tecnologías de la Información Geográfica, pp. 202-213, Alicante, Spain.
Gong, J., Wang, D., Li, Y., Zhang, L., Yue, Y., Zhou, J. and Song, Y., 2010. Earthquake-induced geological hazards detection under hierarchical stripping classification framework in the Beichuan area. Landslides, 7, 181–189.
Grenzdörffer, G.J., Engel, A. and Teichert, B., 2008. The photogrammetric potential of low-cost UAVs in forestry and agriculture. The International Archives of ISPRS, vol. XXXVII, Part B1, 1207-1214, XXIth ISPRS Congress, Beijing, China.
Kasperski, J., Delacourt, C., Allemand, P. and Potherat, P., 2010. Evolution of the Sedrun landslide (Graubünden, Switzerland) with ortho-rectified air images. Bull. Engineering Geology and the Environment, 69: 421-430.
Kraus, K., 2007. Photogrammetry: Geometry from Images and Laser Scans. Walter de Gruyter, Berlin, Germany.
Lin, J., Tao, H.P. and Huang, Z., 2010. Practical Application of Unmanned Aerial Vehicles for Mountain Hazards Survey. 18th International Conference on Geoinformatics, Beijing, China.
Liu, C., Li, W., Lei, W., Liu, L. and Wu, H., 2011. Architecture Planning and Geo-Disasters Assessment Mapping of Landslide by Using Airborne LiDAR data and UAV images. Proc. SPIE 8286, International Symposium on Lidar and Radar Mapping 2011: Technologies and Applications, Nanjing, China.
Maza, I., Caballero, F., Capitán, J., Martínez, J.R., Ollero, A., 2010. Experimental results in Multi-UAV coordination for disaster management and civil security applications. Journal of Intelligent and Robotic Systems, 61, 563-583.
Navarro, V., Ruiz-Ortiz, P. A., Molina, J. M., 2012. Birth and demise of a Middle Jurassic isolated shallow-marine carbonate platform on a tilted fault block: Example from the Southern Iberian continental palaeomargin. Sedimentary Geology, 269, 37-57.
Niethammer, U., James, M.R., Rothmund, S., Travelletti, J. and Joswig, M., 2012. UAV-based remote sensing of the Super-Sauze landslide: Evaluation and results. Engineering Geology, 128, 2–11.
Nonami, K., 2007. Prospect and recent research and development for civil use autonomous unmanned aircrafs as UAV and MAV. Journal of System Design and Dynamics, 1, 2, 120-128.
Prokešová, R., Kardoš, M. and Medveďová A., 2010. Landslide dynamics from high-resolution aerial photographs: A case study from W Carpathians, Slovakia. Geomorphology, 115: 90–101.
Sánchez-Gómez, M., Peláez, J.A., García-Tortosa F. J., Torcal, F., Soler, P., Ureña, M.A., 2008. Aproximación geológica, geofísica y geomorfológica a la actividad tectónica en el valle del alto Guadalquivir. En: 6ª Asamblea Hispano Portuguesa de Geodesia y Geofísica, Tomar, Portugal.
Stumpf, A., Malet, J.-P., Kerle, N., Niethammer, U. and Rothmund, S., 2013. Image-based mapping of surface fissures for the investigation of landslide dynamics. Geomorphology, 186, 12-27.
Turner, D., Lucieer, A., de Jong 2, S.M., 2015. Time Series Analysis of Landslide Dynamics using an Unmanned Aerial Vehicle (UAV). Remote Sens. 2015, 7, 1736-1757.
Varnes, D.J., 1978. Slope movement, types and processes. Schuster R.L. & Krizek R.J. (ed.), Landslides: Analysis and Control, Transportation Research Board Special Rep., National Academy of Sciences, Washington D.C., USA, 176: 12-33.
Walstra, J., Chandler, J.H., Dixon, N. and Dijkstra, T.A., 2004. Time for Change - Quantifying Landslide Evolution Using Historical Aerial Photographs and Modern Photogrammetric Methods. The International Archives of Photogrammetry, Remote Sensing and Spatial Information Sc. XXXV: 475-480, XXth ISPRS Congress, Istanbul, Turkey.
Yeh, M.L., Hsiao, Y.C. , Chen, Y.H. and Chung, J.C., 2011. A study on unmanned aerial vehicle applied to acquire terrain information of landslide. 32th Asian Conf. Remote Sensing, 3, 2210-2215, Taipei, Taiwan.