AN EMPIRICAL INVESTIGATION OF THE MARKET RESPONSE TO THE GOOD AND BAD NEWS EARNINGS ANNOUNCEMENTS WITH AND WITHOUT CONFOUNDING EFFECTS
ANDREAS LAKO
Yogyakarta
ABSTRACT
The main limitation of most empirical studies investigating the market response to earnings announcements is not examining the market response to the good news (GN) and bad news (BN) earnings announcements with confounding effects (WCE) and without confounding effects (WOCE), especially from the corporate macro events. Consequently, the conclusions that earnings announcements have information content to stock market are not yet conclusive. This study analytically investigates the market response to the GN and BN earnings announcements WCE and WOCE using market model. The samples are taken from the LQ45 firms from Jakarta Stock Exchange (JSX) that release annual earnings of 1998, 1999 and 2000.
The results show that the market responses positively to the GN and BN earnings announcement WCE and WOCE at the announcements date. The market response to the GN earnings announcements tends to smaller than the response to the BN earnings. Statistically, however, this study finds that there is no significant difference in the market response to the GN and BN earnings announcements WCE and WOCE for all categories of the announcements. The results also indicate that: 1) there is a market anomaly that inconsistent with Efficient Market Hypothesis (EMH), especially respecting the market response to the BN earnings announcements WCE and WOCE. The evidence implies that the JSX is not yet efficient from the informationally and decisionally semi-strong form market efficiency; and 2) the confounding effects from the corporate macro events have significant impacts on the market response to the GN and BN earnings announcements.
Keywords: good and bad news earnings, confounding effects, market efficiency, event study, and market anomaly.
I. INTRODUCTION
This paper extends some research issues from my two previous papers. The first paper (Lako 2002b) investigated the market reaction to earnings announcements with and without confounding effects and documented that the market reacts significantly to earnings announcements around event period of the announcements1. The second paper (Lako 2003a) investigated the investor reaction to good news (GN) and bad news (BN) earnings announcements2. The results also point out that investors react significantly to the GN and BN earnings announcements at the announcements date. Statically, the results recognized that there is no significant difference in the investor reaction to the announcements.
The limitation of two papers is not investigate yet how the market response to the GN and BN earnings announcements with and without confounding effects (hereafter, WCE and WOCE). I argue that the extension of the market reaction to the GN and BN earnings announcements WCE and WOCE can provide an additional evidence to the accounting and finance literature with respect to the information content3 and explanatory power of earnings announcements. In addition, the extension is expected to diversify further the market anomalies of the previous study (Lako 2002b) into GN and BN earnings.
1 The motivation of this research is due to inconclusiveness results of most empirical studies which have posited that
market reacted to earnings announcements around event period of earnings announcements (Ball and Brown 1968, Beaver 1968, Morse 1981, Chamber and Penman 1984, Defeo 1986, Ball and Kothari 1991, Potter 1992, Pattel and Wolfson 1982, and Bamber 1994). Most of the researchers ignore the confounding effects (CE) from the corporate micro-macro events such as dividend and investment announcements as well as political, social and macro-economic events occurred around event periods of earnings announcements. Because of ignoring the CE, I argue that the results of those studies do not conclusive yet. Foster (1981, 1986), Scott (2000), Beaver (1998), and Lev (1989) argue that the variability of abnormal returns and abnormal volumes of securities during the event periods of earnings announcements are not only affected by reported-earnings events but also by economy-wide and market-wide events as well as social and politic disturbance. The arguments are to be one turn out to be one of the aggravations of this paper.
2 The classification of good news (GN) earnings refers to the firm annual positive earnings and the increasing of
Beside the limitations of my prior studies, this paper is also aggravated by three reasons. First, a number of prior empirical evidence (Ball and Brown 1968, Foster 1977, Pattel and Wolfson 1982, Kross and Schroeder 1984, Hayn 1995, Simatupang and Tandelilin 2001) find that investors response positively to the GN earnings (signed by increasing of earnings change) and tend to react negatively to the BN earnings (signed by decreasing of earnings change). On the contrary, Skinner (1994) reported that the market response to the BN earnings is larger than the response to the GN earnings disclosure. Lako (2002b, 2003a) reports that investors tend to react positively and significantly to the negative-earnings announcements, and to the negative-earnings announcements WCE and WOCE. The contradiction of those empirical findings is primary impetus to the works of this research.
Second, the paper is also motivated by the opinion of the Statement of Financial Accounting Concepts (SFAC) No.1 (FASB 1978) that the objectives of financial reporting are not immutable – they are affected by the economic, legal, political, and social environment in which financial reporting take places. Most empirical evidence concerning the market reaction to earnings announcements, which Indonesian researchers regularly referred as the hold evidence, takes place in the United States capital market settings. Due to their economic, legal, political, and social environment settings are different, I assume that we will find the contradiction evidence if the research settings take place in Indonesian capital markets. My early studies (Lako 2002b, 2003a,b) support this supposition.
Third, there is a little empirical study focusing on the investigation of market efficiency from informationally and decisionally semi-strong forms. Lev and Ohlson (1982), Bernard (1989), Beaver (1998, 2002), Ball (2001), Kothari (2001) and Hartono (2002) suggest that the researchers need to explore such forms in the future research. Ball (2001) shows a large body of anomalous evidence that at least appears to contradict with market efficiency. The anomalous include: 1) price overreaction, 2) excess volatility, 3) price underreaction to earnings, 4) the failure of capital asset pricing model (CAPM) to explain returns, 5) the explanatory power of non-CAPM factors, and 6) seasonal patterns. Although the anomalous evidence implicitly reflect the informationally and decisionally market efficiency, the empirical test to the informationally and decisionally semi-strong form market efficiency in Indonesia is still rare.
For that reason, the purpose of this paper is to analytically investigate the market response to the GN and BN earnings announcements WCE and WOCE around event period of earnings announcements by using the LQ45 firms that announced the annual earnings of 1998, 1999 and 2000 as the research samples. There are eleven hypotheses are presented in connection with the research issues.
The results of this paper indicate that the market responses positively and significantly to the GN and BN earnings announcement WCE and WOCE at the announcements date. The market response to the GN earnings announcements tends to smaller than the response to the BN earnings. However, statistical test using paired samples test points out that there is no a significant difference in market reaction to the GN and BN earnings announcements WCE and WOCE for all categories of the announcements. The findings also indicate that there is a market anomaly that inconsistent with Efficient Market Hypothesis (EMH)4.
This paper is organized as follows. Next section describes literatures review and develops the research hypothesis. Section III provides event study methodology, data collection and procedures to test the hypothesis. Section IV presents empirical results with respect to hypothesis testing. The last section presents conclusions, discussions and suggestions for the future research.
II. LITERATURE REVIEW AND HYPOTHESIS DEVELOPMENT A. The Importance of Earnings Announcement
According to SFAC No.1 (FASB 1978), information about enterprise earnings based on accrual accounting generally provides a better indication of an enterprise’s present and continuing ability to generate favorable cash flows than information limited to the financial effects of cash receipts and payments. Investors, creditors, and others may use reported earnings and information about the elements
3 The term of information content means that a statistical dependency exists between the signals of an earnings
information announcement and stock price.
4 The primary hypothesis is that stock prices accurately reflect available information, that is, the stock prices will adjust
of financial statements in various ways to assess the prospects for cash flows. They may wish, for example, to evaluate management’s performance, estimate “earning power”, predict future earnings, assess risk, or to confirm, change, or reject earlier predictions or assessments.
Referring to the SFAC No. 1 (1978), Scott (2000) emphasizes that earnings information can be useful to investors if the information may make investors to change their prior beliefs, and the useful should be measured by how far the changing prices follow the earnings announcements information. Watts and Zimmerman (1986), Dyckman and Morse (1986), and Dontoh and Ronen (1993) explain that earnings announcements have information content to stock markets. The earnings power is reflected in the changing of stock prices and trading volumes during event period of earnings announcements.
Most empirical studies (Ball and Brown 1968, Beaver 1968, Beaver at all. 1979, Morse 1981, Pattel and Wolfson 1982, Kross and Schroeder 1984, Chamber and Penman 1984, Defeo 1986, Lev 1989, Ball and Kothari 1991, Francis et al. 1992, Teets 1992, Kim and Verrecchia 1994, Potter 1992, Bamber 1994, Daley at al. 1995, and Bhattacharya 2001) had also posited that investors reacted to earnings announcements around the announcement dates. The researchers concluded that the earnings announcements are useful to investors in estimating the expected values and the risks of stock returns. The announcements also have information content and explanatory power to the stock markets.
B. Good and Bad News Earnings Announcements WCE and WOCE
In relation to the good and bad news earnings announcement, my investigation finds that there are several empirical studies focusing on the issues (i.e. Ball and Brown 1968, Foster 1977, Pattel and Wolfson 1982, Skinner 1994, Hayn 1995, Simatupang and Tandelilin 2001, Lako 2002a,b; 2003a). However, the conclusions of those studies are still not conclusive yet.
Ball and Brown (1968), Foster (1977), Pattel and Wolfson (1982), Hayn (1995) and Simatupang and Tandelilin (2001) posit that the market responses positively to the GN earnings announcements and responses negatively to the BN earning announcements around event period of the announcements. The cumulative average abnormal returns (CAAR) of GN earnings (positive earnings) is higher than the CAAR of BN earnings (negative earnings). On the contrary, Skinner (1994) and Lako (2002a,c; 2003a) posit that the market responses more positive to the BN earnings announcements than the GN earnings. The CAAR of the GN earnings announcements is fewer than the CAAR of the BN earnings announcements.
The main limitation of the studies examining the association between earnings announcements and the GN and BN earnings announcements and security prices is ignoring CE from the corporate micro-macro events occurred around event period of earnings announcements5. Most researchers do not also differentiate the samples WCE and WOCE in their research design due to avoid the biases of results. Therefore, I assume that the ignorance of the CE may have significant impacts on the biases and inconclusiveness of the research results.
My presumption is based on several reasons. First, Lev (1989) explains that the explanatory power of earnings to stock returns from earnings disclosure tends to be embarrassingly low. In fact, only 2-5 % of the abnormal variability of narrow window security returns around the date of earnings releases can be attributed to earnings itself. According to Lev (1989), most of the variability of security returns seems due to factors other than the change of earnings. Several other studies also posited that there are many factors that significantly affect to the volatility of security returns. Foster (1986), Dyckman and Morse (1986), Scott (2000), and Beaver (1998) explain that the variability of security returns and trading volumes during a period of earnings announcements may be affected by corporate micro-macro events.
Second, a large number of empirical studies such as Baley and Chung (1995) at Mexico Stock Exchange and Aggarwal et al. (1999) in several emerging capital markets6 find that the corporate-macro
5 Daley et al. (1995) explain that, in testing information asymmetries, confounding effects may occur due to expected
increases in price volatility at the time of an earnings release. We define confounding effects (CE) as the whole of corporate micro-macro announcement events, except corporate earnings announcement, may occurred around event period of an earnings announcement and the events may significant effects to stock price volatility at the time of an earnings announcement.
6 The term emerging capital markets (ECM) generally refer to capital markets in countries with less developed and
events such as turbulence of economic, political, social, security and government regulations have significant effects to the volatility of security prices and trading volumes. The evidence imply that researchers need to take into account the corporate macro events when examine stock market reaction to the GN and BN earnings announcements.
Third, my first investigation toward the market reaction to earnings announcements WCE and WOCE posited that earnings announcements WCE (negative CE) have more significant impacts on the sign and magnitude of security abnormal returns at the announcement date or around event period of earnings announcements than earnings announcements WOCE (Lako 2002b). The results indicate that positive or negative confounding effects (CE) have significant impacts on the sign and magnitude of the AAR and CAAR values that release the GN and BN earnings. My second study concerning the market reaction to financial statements announcement WCE and WOCE (Lako 2003b) also posited that the corporate-macro events, such as uncertainty of political, economic and social factors during event periods of financial statements announcements, have significant impacts on market reaction and market efficiency7.
C. Hypothesis Formulation
The most important empirical findings with respect to the market reaction to earnings announcements are that earnings announcements have information content to stock market and have explanatory power to the stock market behavior around event periods of earnings announcements (Ball and Brown 1968, Beaver 1968, Beaver at all. 1979, Morse 1981, Firth 1981, Kross and Schroeder 1984, Chamber and Penman 1984, Defeo 1986, Foster 1981 and 1986, Ball and Kothari 1991, Potter 1992, Pattel and Wolfson 1982, Bamber 1986, Cornell and Landsman 1989, Lev 1989, Daley at al. 1995, Bhattacharya 2001). The empirical studies examining the market reaction to the firms GNEA and BNEA (Ball and Brown 1968, Foster 1977, Pattel and Wolfson 1982, Skinner 1994, Hayn 1995, Simatupang and Tandelilin 2001, Lako 2002a,c; 2003a) also posited that the market responses significantly to the announcements. My investigations concerning the market reaction to both earnings announcements and financial statements announcements WCE and WOCE (Lako 2002b; 2003b) also find that the market responses significantly to the announcements.
In relation to the hold empirical evidence, I assume that the market responses significantly to the GN and BN earnings announcements WCE and WOCE around event periods of the announcements. Therefore, I hypothesize the following association (in alternative form):
H1: The Market responses to the GN and BN earnings announcements WCE and WOCE.
Nevertheless, the results of empirical studies focusing on the market reaction to the firms GN and BN earnings announcements are still mixed. Ball and Brown (1968), Foster (1977), Pattel and Wolfson (1982), Givoly and Palmon (1982), Hayn (1995), and Simatupang and Tandelilin (2001) documented that the market responses positively to the GN earnings announcements and responses negatively to the BN earnings announcements around event period of the announcements. Foster (1986), Dontoh and Ronen (1993), Beaver (1989), and Scott (2000) point out that the positive-earnings announcements tend to become “good news”, whereas the negative-earnings announcements tend to be “bad news”.
On the other hand, Skinner (1994) and Lako (2002a,c; 2003a) recognized that the market response to the BN earnings announcements is larger than the response to the GN earnings low liquidity, limited investment choices, high volatility of returns and a lack of well-developed domestic institutional investors. Political and economic problems are associated with political risk and uncertainty, macro-economic stability and the possibility of unfavorable government regulations affecting capital market investments (Saudagaran 2001, Radebough and Gray 1997, and Evans et al.1994). As one of the ECMs, Indonesia capital markets (Jakarta Stock Exchange and Surabaya Stock Exchange) have the same characteristics.
7
announcements. Skinner (1994) finds that stock market response to BN disclosures is larger than the response to GN disclosure; quarterly earnings announcements that convey large negative earnings surprises are preempted about 25 % of the time by voluntary corporate disclosure while other earnings announcements are preempted less than 10 % of the time. Similar to the Skinner findings, Lako (2002a,c; 2003a) also find that the market response to BN earnings announcements is larger than the response to GN earnings announcements. The early analysis also recognized that the market response to earnings announcements WCE (negative CE) is larger than the response to earnings announcements WOCE (Lako 2002b).
Derived from those mixed conclusions, I formulate several hypotheses as follows (in alternative form)8:
H2a: Market responses positively and significantly to the GN earnings announcements and responses
negatively to the BN earnings announcements.
H2b: The market response to the GN earnings announcements is larger than the response to the BN
earnings announcements.
H3: The market response to the GN earnings announcements WCE is smaller than the response to the
GN earnings announcements WOCE.
H4: The market response to the BN earnings announcements WCE is smaller than the response to
the BN earnings announcements WOCE.
H5: The market response to the GN earnings announcements WCE is larger than the response to the
BN earnings announcements WCE
H6: The market response to the GN earnings announcements WOCE is larger than the response to the
BN earnings announcements WOCE
In order to validate whether the market differentially responses to the GN and BN earnings announcements WCE and WOCE, I suppose that the market differentially responses to the announcements. Therefore, I formulate the alternative hypotheses as follows:
H7: There is a significant difference in the market response to the GN earnings announcements and the
BN earnings announcements.
H8: There is a significant difference in the market response to the GN earnings announcements WCE
and the GN earnings announcements WOCE.
H9: There is a significant difference in the market response to the BN earnings announcements WCE
and the BN earnings announcements WOCE.
H10: There is a significant difference in the market response to the GN earnings announcements WCE
and the BN earnings announcements WCE
H11: There is a significant difference in the market response to the GN earnings announcements WOCE
and the BN earnings announcements WOCE.
III. RESEARCH DESIGN A. Event Study Methodology
In this study, I use event study methodology; especially OLS market model, to test the association between the GN and BN earnings announcements WCE and WOCE and stock returns. According to McWilliams and Siegel (1997), market model is a standard approach in estimating and calculating abnormal returns. Brown and Warner (1980, 1985) find that a simple methodology based on the market model performs well under a wide variety of condition than other event studies methodology (i.e. mean-adjusted returns and market-adjusted returns). While Kothari (2001) asserts that event studies are joint tests of market efficiency and the model of expected rates of return used in estimating abnormal returns. In an event study, one infers whether an event, such as an earnings announcement, convey new information to market participants as reflected in changes in the level or variability of security prices or trading volume over a short time period around the event.
The event study methodology was used by accounting and finance researchers for three decades. Ball and Brown (1968) and Beaver (1968) are the first accounting researchers using event study method to
8 The formulation of statement H
1 and H2a is meant to determine the sign of the market response in the positive or
negative AAR values form, while the formulation of statement H2b, H3, H4, H5, and H6 is intended for measuring the
test the association between earnings announcements and stock prices (trading volume). They provide compelling evidence that there is information content in accounting earnings announcements. The other researchers, such as Foster (1977), Morse (1981), Eston et al. (1992), Francis et al (1992), Hayn (1995), Daley et al (1995), Bhattacharya (2001) and Landsman and Maydew (2002) also used the event study methodology to test the information contents of earnings announcements.
B. Sample Selection
The samples of this study are taken from the LQ45 index firms from Jakarta Stock Exchange (JSX) that release annual earnings of the year 1998, 1999 and 2000. The index consists of 45 stocks chosen after several selection criteria so as the stocks have high liquidity (LiQuid) and big market capitalization of the stocks. According to JSX Research and Development Division (Fact Book 2001), to be eligible for the selection a stock has to fulfill a certain criteria and pass the main selection, as follows: (1) Included in the top 60 ranking from the stock transaction total in the Regular Market (the average transaction value during the last 12 months), (2) the ranking based on the market capitalization (the average market capitalization during the last 12 months), (3) has been listed in the JSX for at least 3 months, and (4) the company’s financial condition and the growth prospect, the frequency and the regular market transaction’s number of trading days.
By excluding the firms do not (1) release earnings of 1998, 1999 and 2000 during periods of February – June of 1999, 2000 and 2001, (2) have completely earnings data, and (3) active in trading for 60 days, the final samples for three years are 129 samples. The details of samples announced the GN and BN earnings WCE and WOCE of the year 1998, 1999 and 2000 are presented in Table 1.
Table 1
Details of samples announced the GN and BN earnings WCE and WOCE of 1998, 1999 and 2000 during announcement period of February – June of 1999, 2000 and 20019
Year samples GNEA BNEA GNEA-WCE GNEA-WOCE BNEA-WCE BNEA-WOCE
1998 43 14 29 10 4 21 8
1999 43 36 7 6 30 0 7
2000 43 20 23 13 7 20 3
Total 129 70 59 29 41 41 18
Table 1 shows that there are 70 firms and 59 firms announced the GN and BN earnings for three years, respectively. In accordance with the GN and BN earnings announcements WCE and WOCE, Table 1 also shows that there is 70 firms released the GN and BN earnings WCE, and 59 firms announced the GN and BN earnings WOCE.
The composition of 70 earnings announcements WCE consists of 1) 64 confounding effects (CE) originate from the corporate macro events, 2) 4 CE come from the corporate micro events; and 3) 2 CE are mixed between micro and macro events. My investigation indicates that the uncertainty of economic policy (economic crisis) and the global/regional economic and capital market crisis for the year 1999 are primary causes of the high CE of the firms earnings announcements WCE; while the political chaotic during the Gus Dur-Megawati governmental since January to July of 2001 is to be primary causes of the quantity of 2000 earnings announcements WCE.
C. Earnings and Stock Returns Data
The dates of the firm earnings announcements are obtained from Biro PKP of Indonesian Securities Supervisory Agency (hereafter, Biro PKP Bapepam). The Bapepam dates are assumed as the first official source of earnings information announcement that known by market. Based on the Bapepam regulation in 1996, prior to release the financial statements to the public and the other institutes the go public firms have to report their financial statements to Biro PKP Bapepam at the first time. The results of
9 My identification shows that most CE around event periods of earnings announcements during February to July in
my investigation confirm the stipulations. The data of the annual earnings is taken from Indonesian Capital Market Directory (ICMD) 1999, 2000 and 200110.
The data of daily stock returns and market returns (LQ45 composite index) are obtained from the Center of Capital Market Database, Gadjah Mada University. For the data concerning the corporate micro-macro events around event period of earnings announcements from each firm (beside earnings announcements events), I attained from Bisnis Indonesia daily and the Weekly Data and Analysis of Indonesian Capital Market from Bureau of Research and Investment Management, Bapepam.
D. Method of hypothesis testing
The method to test whether market reacts positively and differentially to the GN and BN earnings announcements WCEs and WOCEs (test the statements of H1 – H6) comprised of several steps as follows: First, categorize the LQ45 firms’ earnings announcements into the GN and BN earnings announcements. The classification of the GN earnings refers to the increasing of firm current annual earnings from last year earnings; while the classification the BN earnings refers to the decreasing of current annual earnings from last year earnings.
Second, identify and classify the corporate micro events such as earnings forecast and dividend, financing, investment, marketing-production-sales, and management- board of director announcements, and the corporate macro events such as political and social fluctuations, national security chaotic, the changes of the government economy policy, and so forth into the GN and BN earnings announcements WCE and WOCE. An earnings announcement is classified into an announcement WCE if the announcement is released in conformity with an announcement or other event from the other corporate micro-macro events. While an earnings announcement is classified into an announcement WOCE if there is no other announcement or event from the corporate micro-macro events that occurred when the announcement was released to the Biro PKP Bapepam. The detailed amount of the firms announced the GN and BN earnings announcements WCE and WOCE of year 1998, 1999 and 2000 are presented in Table 1.
Third, establish the time range of event periods (5 days, i.e. t-2, t=0, t+2) and 100 days estimation periods of earnings announcements. The determination of event periods is assumed that there is much information absorbed by market, and the incoming of information is very fast. Investors were assumed to still consider earnings announcements information in their investment decision-making during the five days of event periods.
Fourth, compute alpha (i ) and beta (i ) coefficient using ordinary least square (OLS) market model. Individual stock returns of daily transactions and daily composite index of the LQ45 firms before earnings announcements date were used as input to estimate i and I. Fifth, compute actual market returns around earnings announcements date using LQ45 Index. Sixth, compute expected returns using single index model – SIM (Jones 2000):
E(Rj) = i + i . E(RM) (1)
where:
E(R,j ) = expected return of stock i at j
10 This study uses earnings as a proxy of annual financial statements information. The term of earnings will
i = intercept
i = regression coefficient
E(RM)= expected value of market index at j
Seventh, calculate abnormal returns (AR) using the following equation:
ARi,t = Ri,t - E(Rj)
(2)
where:
ARi,t = abnormal returns of stock i at day t
E(R,j ) = expected returns of stock i at estimation period j
Ri,t = stock return i at day t, where t = (-2, 0, +2)
Eighth, calculate cumulative abnormal returns (CAR) and average abnormal returns (AAR). CAR were obtained by summing up AR of all samples observed on day t, while AARs were calculated by dividing CAR of all samples on day t by n observed samples. Ninth, compute the standard error of estimate (SEE), standardized AR, and the significance of AAR. T-test was used to test the significance of AAR during event periods of earnings announcements. The significance of AAR means that it is statistically not equal to zero (positive if the news is ‘good news’ and negative if the news is ‘bad news’ (Hartono 2000)11. Tenth, analyze the difference in market response to the GN and BN earnings announcements WCE and WOCE (test the statements of H6 – H11) using paired sample test with significance level 5 %.
IV. RESULTS
To test whether the market responses positively and differentially to the GN and BN earnings announcements WCE and WOCE, I compute the AR of earnings announcements from each firms, and the CAR and AAR of earnings announcements from overall firms for the earnings announcements of 1988, 1999 and 2000. The final results of the AAR and CAAR values computation are presented in Table 2 (Panel A, B and C).
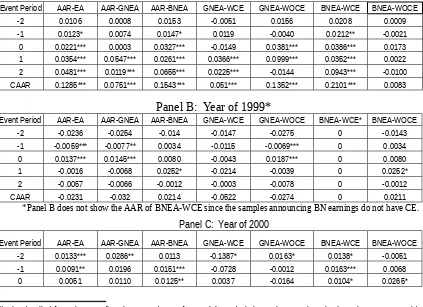
Table 2
AAR of Samples Announced the GN and BN Earnings Announcements WCE and WOCE Panel A: Year of 1998.
Event Period AAR-EA AAR-GNEA AAR-BNEA GNEA-WCE GNEA-WOCE BNEA-WCE BNEA-WOCE
-2 0.0106 0.0008 0.0153 -0.0051 0.0156 0.0208 0.0009
-1 0.0123* 0.0074 0.0147* 0.0119 -0.0040 0.0212** -0.0021
0 0.0221*** 0.0003 0.0327*** -0.0149 0.0381*** 0.0386*** 0.0173
1 0.0354*** 0.0547*** 0.0261*** 0.0366*** 0.0999*** 0.0352*** 0.0022
2 0.0481*** 0.0119*** 0.0655*** 0.0225*** -0.0144 0.0943*** -0.0100
CAAR 0.1285*** 0.0751*** 0.1543*** 0.051*** 0.1352*** 0.2101*** 0.0083
Panel B: Year of 1999*
Event Period AAR-EA AAR-GNEA AAR-BNEA GNEA-WCE GNEA-WOCE BNEA-WCE* BNEA-WOCE
-2 -0.0236 -0.0254 -0.014 -0.0147 -0.0275 0 -0.0143
-1 -0.0059*** -0.0077** 0.0034 -0.0115 -0.0069*** 0 0.0034
0 0.0137*** 0.0145*** 0.0080 -0.0043 0.0187*** 0 0.0080
1 -0.0016 -0.0068 0.0252* -0.0214 -0.0039 0 0.0252*
2 -0.0057 -0.0066 -0.0012 -0.0003 -0.0078 0 -0.0012
CAAR -0.0231 -0.032 0.0214 -0.0522 -0.0274 0 0.0211
*Panel B does not show the AAR of BNEA-WCE since the samples announcing BN earnings do not have CE.
Panel C: Year of 2000
Event Period AAR-EA AAR-GNEA AAR-BNEA GNEA-WCE GNEA-WOCE BNEA-WCE BNEA-WOCE
-2 0.0133*** 0.0286** 0.0113 -0.1387* 0.0163* 0.0138* -0.0051
-1 0.0091** 0.0196 0.0151*** -0.0728 -0.0012 0.0163*** 0.0068
0 0.0051 0.0110 0.0125** 0.0037 -0.0164 0.0104* 0.0265*
1 0.0013 0.0027* -0.0074 0.0893** 0.0091 -0.0072 -0.0085
2 -0.0069 -0.0149 -0.0066 0.1573* -0.0274 -0.0083 0.0051
CAAR 0.0219*** 0.047*** 0.0249*** 0.0388*** -0.0196 0.025*** 0.0248*
Panel C: Year of 1998 – 2000 (pooled)
Event Period AAR-EA AAR-GNEA AAR-BNEA GNEA-WCE GNEA-WOCE BNEA-WCE BNEA-WOCE
-2 0.0001 0.0013 0.0041 -0.0528 0.0015 0.0115 -0.0062
-1 0.0052 0.0064* 0.0111* -0.0241 -0.0040 0.0125* 0.0027
0 0.0136** 0.0086 0.0177** -0.0051 0.0134* 0.0163* 0.0173
1 0.0117** 0.0169* 0.0146** 0.0348 0.0350* 0.0093** 0.0063
2 0.0118** -0.0032 0.0192* 0.0598** -0.0165 0.0286** -0.0021
CAAR 0.0424*** 0.03 0.0667*** 0.0126 0.0294 0.0782*** 0.018
Notes:
AAR-EA : Average abnormal returns – earning announcements
GNEA : Good news earnings announcements
BNEA : Bad news earnings announcements
GNEA-WCE : Good news earnings announcements with confounding effects GNEA-WOCE : Good news earnings announcements without confounding effects BNEA-WCE : Bad news earnings announcements with confounding effects BNEA-WOCE : Bad news earnings announcements without confounding effects
* : Statistical significance at the 10 % level for two-tailed test where (t>1.289 t-tab)
** : Statistical significance at the 5 % level for two-tailed test where (t>1.645 t-tab)
*** : Statistical significance at the 1 % level for two-tailed test where (t>2.326 t-tab)
A. Testing the Statements of H1-H6
Table 2 (Panel A, B, and C) provides the sign and magnitude of the AAR values of overall samples during event periods of earnings announcements of the year 1998, 1999 and 2000. Panel D reports totally the sign and magnitude of the AAR values of overall samples for three years (1998-2000) during event periods of earnings announcements.
In general, Panel A, B, and C report that the signs of the AAR values during event periods of earnings announcements of the year 1998, 1999 and 2000 are positive/negative for all categories of the announcements. The magnitudes of the AAR values for all categories of the earnings announcements are also higher/smaller than zero. The results mean that the market responses positively or negatively to the GN and BN earnings announcements WCE and WOCE of 1998, 1999, and 2000 during event period of earnings announcement. Panel D confirms this conclusion. Figure 1, 2, 3, and 4 also demonstrate that market responses to overall categories of earnings announcements at the announcement date. This response is reflected in the increasing/decreasing of the AAR value graphic of the earnings announcements at t.0. Therefore, the statement of H1can be supported.
Panel A, B and C in Table 2 also report that the signs of the AAR values of the GN earnings announcements (GNEA) and the BN earnings announcements (BNEA) are positive and their magnitude values are higher than zero at the announcement date (t = 0). The market responses significantly at significance level 1 % to GNEA of the year 1998 and 1999, and at significance level 1% and 5% to the BNEA of the year 1998 and 2000. Panel D repots that market, generally, responses positively and significantly to the GNEA and BNEA at the significance level 10% and 5% at the announcement date. These results mean that the market responses positively and significantly to the GN and BN earnings announcements at the announcement date. Consequently, the statement of H2a cannot be supported (rejected).
Except for Panel B, Panel A, C, and D also provide the evidence that the magnitude of the AAR values of GNEA is smaller than the magnitude of the AAR values of BNEA at the announcements date. Panel D and Figure 4 also confirm that the CAAR value of the BNEA is larger than the CAAR value of the GNEA. Consequently, the statement of H2bcannot be supported (rejected).
With respect to the market response to the BN earnings announcements WCE and WOCE, except for the 1999 earnings announcements (Panel B), Panel A reports that the AAR value of the BNEA-WCE of the year 1998 is larger than the AAR value of BNEA-WOCE at the announcement date; while Panel C reports that the AAR value of the WCE of the year 2000 is smaller than the AAR value of BNEA-WOCE. Generally, Panel D reports that market responses significantly to the BNEA-WCE than to the BNEA-WOCE at announcement date, and the CAAR value of the BNEA-WCE is larger than the CAAR value of BNEA-WOCE. Thus, the statement of H4cannot be supported.
For the market response to the GN earnings announcements WCE and the BN earnings announcements WCE, except for the 1999 earnings announcements (Panel B), Panel A, C, and D report that the AAR value of the GNEA-WCE is smaller than the AAR value of BNEA-WCE at the announcement date. From CAAR values perspective, Panel A, C, and D also provide the evidence that the CAAR value of the GNEA-WCE is smaller than the CAAR value of BNEA-WCE. Consequently, the statement of H5cannot be supported.
In relation to the market response to the GNEA-WOCE and the BNEA-WOCE, Panel A and B present that the AAR value of the GNEA-WOCE is larger than the AAR value of BNEA-WOCE at the announcement date; while Panel C presents the contrary evidence. In general, Panel D presents that the CAAR value of the GNEA-WOCE is larger than the CAAR value of the BNEA-WOCE. Therefore, the statement of H6can be supported.
In relation to Figure 1, 2, 3, and 4, the possible explanations are as follows: First, earnings announcements of 1998. Figure 1 shows that the market responses positively to the BNEA, GNEA-WOCE, BN-WCE and BNEA-WOCE at announcement date (t=0); while responses negatively to the GNEA and GNEA-WCE. At the day (t.+1), it seems that the market tends to revise their decision mistakes at the event date of earnings announcement by responding positively to the GNEA and responding negatively to the BNEA.
Second, earnings announcements of 1999. Figure 2 shows that the market responses positively to all categories of earnings announcements at the announcement date (t=0). The positive response appears since t.-1 until t.0. Nevertheless, the positive response is not show that the JSX market is efficient in semi-strong form because the market, decisionally, is not precise in responding the BN earnings.
Third, earnings announcements of 2000. Figure 3 shows that, except for the GNEA-WCE, the market response to the GN and BN earnings announcements WCE and WOCE is not appearing a significant different. The market response to the GNEA-WCE is still questionable and the response is not reflecting the market efficiency. The high negative CE from macro events during February to July of 2001 may cause these phenomena. In general, Figure 4 describes that market responses positively to the GN and BN earnings announcements WCE and WOCE at announcement date (t=0).
B. Testing the Statements of H7-H11
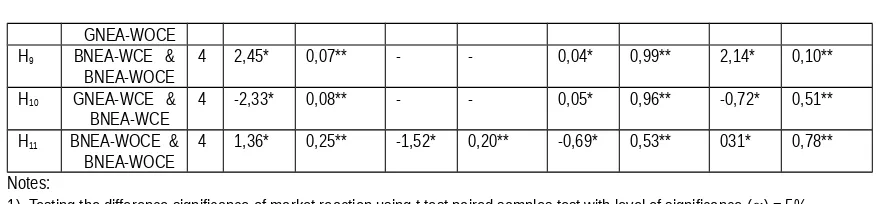
To validate whether the market responses differentially to the categories of the GN and BN earnings announcements WCE and WOCE (testing to H7-H11), I used paired samples test with the significance level () = 5%. The results are summarized and presented in Table 3.
Table 3
Testing to the difference significance of the market response to the GN and BN earnings
announcements WCE and WOCE.
Hypo-thesis Prescription df t-testAAR of 1998Sig.(2-tailed t-testAAR of 1999Sig.(2-tailed t-testAAR of 2000Sig.(2-tailed t-testAAR of 1998-2000Sig.(2-tailed
H7 GNEA & BNEA 4 -1,157* 0,31** -1,70* 0,16** 0,99* 0,38** -1,75* 0.15**
GNEA-WOCE
BNEA-WOCE 4 1,36* 0,25** -1,52* 0,20** -0,69* 0,53** 031* 0,78**
Notes:
1). Testing the difference significance of market reaction using t-test paired samples test with level of significance () = 5%
2). T-table value for the AAR of 1998, 1999, 2000 and 1998-2000 (pooled) is 2,776 (df =4)
* T-test value < t-table value; as a result the statements of H7 , H8, H9, H10, and H11 cannot be supported.
** Sig.(2-tailed) value > 0.05, as a result the statements of H7 , H8, H9, H10, and H11 cannot be supported
Table 3 reports the results of paired samples test toward the AAR values of GNEA and BNEA, GNEA-WCE and GNEA-WOCE, BNEA-WCE and BNEA-WOCE, GNEA-WCE and BNEA-WCE, and GNEA-WOCE and BNEA-WOCE for the year 1998, 1999 and 2000 as well as 1998-2000 (pooled). The results of paired samples test using t-test show that the t-test values of each category of the announcements are lower than t-table value (2,776). The results of paired samples test using Sig.(2-tailed) test also show that the Sig. (2-tailed) values of each category of the announcements are higher than () = 5%. Therefore, all of the statements of H7, H8, H9, H10, and H11 cannot be supported.
V. CONCLUSION, DISCUSSION AND FUTURE RESEARCH
This study investigates whether the market responses differentially to the GN and BN earnings announcements WCE and WOCE of the 1998, 1999 and 2000 earnings announcements by using the samples from LQ45 firms. There are eleven hypotheses are presented with respect to the research issues.
The results indicate that: First, market responses positively/negatively to the GN and BN earnings announcements WCE and WOCE during event periods of earnings announcements. Second, market responses positively and significantly both to the GNEA and to the BNEA at the announcement date. The market response to the BN earnings announcements is larger than the response to the GNEA. This finding is inconsistent with prior evidence from Ball and Brown (1968), Foster (1977), Pattel and Wolfson (1982), Dontoh and Ronen (1993), and Hayn (1995) that the market response to the GNEA is higher than the response to the BNEA. But this finding is consistent with Skinner (1994) and Lako (2002b and 2003a).
Third, the market response to the GNEA-WCE is lower than the response to the GNEA- WOCE. However, statistically, this study does not find a significant difference between the GNEA-WCE and the GNEA-WOCE. Fourth, the market response to the WCE is higher than the response to the BNEA-WOCE. But, statistically, there is no a significant difference in the market response to the GNEA-WCE and to the GNEA-WOCE. Fifth, the market response to the GNEA-WCE is lower than the response to the BNEA announcements WCE. However, the result of statistical test using paired samples test shows that there is no a significant difference in market response to the announcements. Sixth, the market response to the GNEA-WOCE is higher than the response to the BNEA-WOCE. Statistical test using paired samples test also shows that there is no a significant difference in market response to the announcements
Generally, this study indicates that the JSX is not efficient yet from the informationally and decisionally semi-strong form market efficiency. The indications, for example, appear from the positive responses of the market to the BN earnings announcements WCE and WOCE, and the continuous response of the market to all categories of the announcements during event period of earnings announcements. The result of this study also points out that the confounding effects from the corporate macro events have significant impacts on the investment decision making of the market to react the GN and BN earnings announcements WCE and WOCE, especially the response to the 1998 and 2000 earnings announcements having many confounding effects. Besides, as far as I know, most accounting researchers often ignored such confounding effects in their research design.
flows per share, are not considered yet. For that reason, the extension of those issues is to be an important agenda for the future researches.
REFERENCES
Aggarwal, R., C. Inclan and R. Leal. 1999. Volatility in Emerging Stock Markets. Journal of Financial Analysis. (March, Vol.34). 33-55
Bailey, W. and Y. P. Chung. 1995. Exchange Rate Fluctuations, Political Risk, and Stock Returns: Some Evidence from an Emerging Market. Journal of Financial and Quantitative Analysis. Vol. 30. No. 4. (December). 541-561
Ball, R. 1994. The Earnings-Price Anomaly. In Financial Statement Analysis (eds. Ray Ball and S.P. Kothari). McGraw-Hill, Inc.
_______. 2001. The Theory of Stock Market Efficiency: Accomplishments and Limitation. in The New Corporate Finance: Where Theory Meets Practice. ( Eds. Donald H. Chew, Jr). Third Edition. McGraw-Hill /Irwin. 20-33
_______ and P. Brown, 1968. An Empirical Evaluation of Accounting Income Numbers. Journal of Accounting Research. Vol. 6. 159-178
______.and S.P. Kothari. 1991. Security Returns Around Earning Announcement. The Accounting Review. Vol. 9. No.1. 3-18.
Bamber, L.S. 1986. The Information Content of Annual Earnings Releases: A Trading Volume Approach.
Journal of Accounting Research. Vol.24. (Spring). 41-56
Beaver, W.H. 1968. The Information Content of Annual Earning Announcements. Journal of Accounting Research. Vol. 6. No.2. 67-100
______.1998. Financial Reporting: An Accounting Revolution. Third Edition. Prentice Hall International, Inc. New Jersey
______.2002. Perspectives on Recent Capital Market Research. The Accounting Review. Vol. 77 (April), No.2. 453-474
_______, R. Clarke and W. Wright. 1979. The Association Between Unsystematic Security Returns and the Magnitude of Earnings Forecast. Journal of Accounting Research. (Autumn). 316-340
Bernard, V. 1989. Capital Market Research in Accounting during the 1980’s: A Critical Review. In The State of Accounting Research as We Enter the 1990’s. (Eds. Thomas J. Frecka). University of Illinois at Urbana Champaign. 72-122
Bhattacharya, N. 2001. Investor’s Trade Size and Trading Responses around Earnings Announcements: An Empirical Investigation. The Accounting Review. Vol. 76 (April), 221-244
Brown, S.J. and J.B. Warner. 1980. Measuring Security Price Performance. Journal of Financial Economics. Vol.8. 205-258.
________., 1985. Using Daily Stock Returns: The Case of Event Studies. Journal of Financial Economics.
Vol.14. 3-31.
Chambers, A.E. and S.H. Penman. 1984. Timeliness of Reporting and Stock Price Reaction to Earning Announcements. Journal of Accounting Research. Vol. 22. No. 1. 21-47
Cornell, B. and W.R. Landsman. 1989. Security Price Response to Quarterly Earnings Announcements and Analysts’ Forecast Revisions. The Accounting Review. (October, Vol. LXIV). 681-692.
Daley, L.A, J.S. Hughes and J.D. Rayburn. 1995. The Impact of Earnings Announcements on the Permanent Price Effects of the Block Trades. Journal of Accounting Research. (Autumn, Vol.32). 317-334
Defeo, V.J. 1986. An Empirical Investigation of the Speed of the Market Reaction to Earning Announcements. Journal of Accounting Research. Vol.24.(Autumn). 349-363
Dontoh, A. and J. Ronen. 1993. Information Content of Accounting Announcements. The Accounting Review. Vol. 58. (October). 857-873
Dyckman, T.R. and D. Morse. 1986. Efficient Capital Market and Accounting: a Critical Analysis. Second Edition. Prentice Hall. New Jersey.
Evans, T.G., M.E. Taylor and O. Holzman. 1994. International Accounting & Reporting. 2nd Edition. International Thomson Publishing, Ohio.
Financial Accounting Standards Board (FASB). 1978. Statement of Financial Accounting Concepts No.1.
Financial Accounting Standards Board.
Firth, M. 1981. The Relative Information Content of the Release of Financial Data by Firms. Journal of Accounting Research. Vol. 19. (Autumn,). 521-529
Foster, G. 1977. Accounting Earnings and Stock Prices of Insurances Companies. The Accounting Review. (October). 686-698
________1981. Intra-Industry Information Transfers Associated with Earnings Released. Journal of Accounting & Economics. (December). 201-232
_______.G., 1986. Financial Statement Analysis. 2nd Edition. Prentice-Hall. Englewood Cliffs.
Francis, J., D. Pagach and J. Stephan. 1992. The Stock Market Response to Earnings Announcements Released during Trading versus Nontrading Periods. Journal of Accounting Research. Vol. 30, No.2. 165 – 184
Hayn, C. 1995. The Information Content of Losses. Journal of Accounting & Economics. Vol. 20. 125-153 Jakarta Stock Exchange. 2001. Fact Book 2001. JSX’ Research &Development Division.
Hartono, J. 2000. Teori Portofolio dan Analisis Investasi. Edisi Kedua. BPFE. Yogyakarta
________. 2002. Arah dan Topik-topik Riset Akuntnasi Keuangan san Pasar Modal (RAKPM) Jangka Pendek dan Jangka Panjang. Working Paper. Gadjah Mada University.
Jones, C.P. 2000. Investments: Analysis and Management. 7th Edition. John Wiley & Sons, Inc. New York. Kim, O. and R.E. Verrecchia. 1994. Market Liquidity and Volume around Earnings Announcements. Journal
of Accounting and Economics. Vol. 17. 41-67
Kothari, S.P., 2001. Capital Markets Research in Accounting. Journal of Accounting & Economics. Vol. 31. 105 -231
Kross, W. and D.A. Schroeder. 1984. An Empirical Investigation of the Effect of Quarterly Earnings Announcement Timing on Stock Returns. Journal of Accounting Research. Vol. 22. No.1. 153-176 Lako, A. 2002a. Reaksi Pasar terhadap Publikasi Laba Emiten. Bank & Manajemen. No.64.
(January-February). 45 – 54
_______. 2002b. Market Reaction to Earnings Announcements with and Without Conforunding effects: An Empirical Evidence from Jakarta Stock Exchange. The 5th Indonesian Conference on Accounting. Semarang, 5-6 2002. (edited by A. Chairi and M. Syafruddin). The Indonesian Institute of Accountants of Accountant Educators Compartment. 96-109.
________. 2002c. Publikasi Laporan Keuangan Bank dan Reaksi Investor Bank & Manajemen. No. 69. (November - December). 21-29.
_______. 2003a. Anomali Reaksi Investor terhadap Pengumuman Laba Good News dan Laba Bad News: Bukti Empiris dari Bursa Efek Jakarta. Manajemen Usahawan Indonesia. (February). No.2. 1-12. ________. 2003b. Market Reaction to Financial Statement Announcements with and without Confounding
Effects: An Empirical Evidence from Jakarta Stock Exchange. The Journal of Accounting, Management, and Economics Research. Vol. 3. No. 1 (February). 19 –33
Landsman, W.R. and E.L. Maydew. 2002. Has the Information Content of Quarterly Earnings Announcements Declined in the Past Three Decades?. Journal of Accounting Research. Vol. 40. No. 3 (June). 797 - 808
Lev, B. 1989. On the Usefulness of Earnings and Earnings Research: Lessons and Directions from Two Decade of Empirical Research. Journal of Accounting Research. (Vol. 27. Supplement). 153-201. _______, and J.A. Ohlson. 1982. Market Based Empirical Research in Accounting: A Review, Interpertation
and Extensions. Journal Accounting Research. Vol. 27. 249-322
McWilliams, A. and D. Siegel. 1997. Event Studies Management Research: Theoritical and Empirical Issues. Academy of Management Journal. Vol. 40. No.3. hlm 625-657
Morse, D. 1981. Price and Trading Volume Reaction Around Earnings Announcements: A Closes Examination. Journal of Accounting Research. (Autumn, Vol. 19). 374-383.
Porter, G. 1992. Accounting Earnings Announcement, Institutional Investors Concentration and Common Stock Returns. Journal of Accounting Research. Vol. 30. No. 1. 146-155.
Radebaugh, L.H. and S. J. Gray. 1997. International Accounting and Multinational Enterprises. Fourth Edition. John Wiley & Sons
Saudagaran, S.M. 2001. International Accounting : A User Perspective. South-Western College Publishing . Schroeder, R..G. and Clark M. 1995. Accounting Theory. 5th ed. John Wiley & Sons..
Scott, W.R. 2000. Financial Accounting Theory. 2nd Edition. Prentice – Hall International, Inc.
Simatupang, D.S. and E. Tandelilin. 2001. The Negative Earnings Effects Hypothesis as a Derivation of the Market Overreaction. Gadjah Mada International Journal of Business. Vol. 3. No. 3. (September). 349-366.
Skinner, D. 1994. Why Firms Voluntarily Disclose Bad News? Journal of Accounting Research. Vol. 32. 38 - 60
Strong, N. and M. Walker. 1993. The Explanatory Power of Earnings for Stock Returns. The Accounting Review. (April, Vol. 68). 385-399
Teets, W. 1992. The Association between Stock Market Responses to Earnings Announcements and Regulation of Electric Utilities. Journal of Accounting Research. Vol. 30. 274-284.
Fi gur e-1 : T he AAR Val ues of Good News and Bad News E ar ni ngs Announcements WCE and WOCE of year 1 998
-0.04000 -0.02000 0.00000 0.02000 0.04000 0.06000 0.08000 0.1 0000 0.1 2000
-2 -1 0 1 2
E v e nt P e r i o d o f E a r ni ngs A nno unc e me nt s
A A R-E A 98 A A R-GNE A A A R-B NE A A A R-GNE A -WC E A A R-GNE A -WOCE A A R-B NE A -WC E A A R-B NE A -WOCE
Figure-2: AAR Values of Good New s and bad New s Earnings Announcem ents WCE and WOCE of year 1999
-0.04 -0.03 -0.02 -0.01 0 0.01 0.02 0.03
-2 -1 0 1 2
Event P eriod of Earnings Announc ements
Figure-3: The AAR Values of Good New s and Bad New s Earnings Announcem ents WCEs and WOCEs of year 2000
-0.20000 -0.15000 -0.10000 -0.05000 0.00000 0.05000 0.10000 0.15000 0.20000
-2 -1 0 1 2
Event P eriod of Earnings Announc ement
AAR-EA2000 AAR-GNEA AAR-BNEA AAR-GNEA-WCE AAR-GNEA-WOCE AAR-BNEA-WCE AAR-BNEA-WOCE
Figure-4: The AAR Values of Good New s and Bad New s of Earnings Announcements WCE and WOCE of year 1998-2000
-0.06000 -0.04000 -0.02000 0.00000 0.02000 0.04000 0.06000 0.08000
-2 -1 0 1 2
Event P eriod of Earnings Announc ement