INCOME SMOOTHING PRACTICES
IN NON MANUFACTURING COMPANIES
Yusepaldo Pasharibu
Paskah Ika Nugroho
Lila SeptiaAdiKusuma
Faculty of Economics & Business, SatyaWacana Christian University, Indonesia
Abstract
The aim of this research is to analyze income smoothing practices in non manufacturing companies listed in Indonesian Stock Exchange (BEI/IDX) using time period 2007 until 2011. Data were collected from www.idx.co.id and Indonesian Capital Market Directory (ICMD) and 73 samples were used. Eckel index was used to compute income smoothing. The result of this research show that 22 companies
co duct i co e s oothi g practices a d 51 co pa ies did ’t. Co structio co panies have highest percentage (66.66%) in income smoothing practices.
Keyword: Income Smoothing
INTRODUCTION
Financial report is one of the accounting information sources for stakeholders to make a decision. An example, for investor, this financial report will give them information a out the fi ’s o ditio . Furthermore, financial report has made by the fi ’s a age e t to sho thei espo si ilit of usi g the fi ’s o e to the fi a ial epo t’s use . There are two main users that need the financial report, which a e i te al use fi ’s a age e t , a d e te al use such as investors, stockholders, creditors, government, employee, and even the society). Internal fi a ial epo t’s users know for sure about the financial detail or the things that the firm facing in, on the other hands, external fi a ial epo t’s user is in uncertainty condition, espe iall a out the fi ’s o ditio itself.
Ashari et al., (1994) found that there were some indications of the income smoothing and operating income as the goal that is used to perform an income smoothing. There were some researches and observations about income smoothing in manufacturing companies. Those researches and observations showed that approximately 50% industries that used as research sample did an income smoothing practices, such as Yusuf and Soraya (2004) research, which found that 14 out of 30 companies doincome smoothing, Juniarti and Corolina (2005) research proved that 25 out of 54 companies do income smoothing,25 out of 52 companies (Dewi& Carina, 2008), and 83 out of 165 companies (Herni&Susanto, 2008) do income smoothing.
Based on those researches and observations, we can determine thatthere was a lot of researches observed manufacture companies that conduct income smoothing. On the other hands, Mila and Supatmi (2012) research found that 72% from 212non-manufacturing companiesdid an income smoothing practices, and only 46.66% companies from 300 of manufacture companies did an income smoothing. That means the percentages of income smoothing that conducted by non-manufacturing companies were higher than the income smoothing that conducted by manufacturing companies. Based on those explanations, this research wants to determine further practices of income smoothing, especially in non-manufacturingcompanies, which recorded on IDX (Indonesian Stock Exchange/Bursa Efek Indonesia) within period 2007-2011.
LITERATURE REVIEW
Earnings Management
Earnings management define as when managers use judgment in financial reporting and instructuring transactions to modify financial reports to either mislead some stakeholders about the underlying economic performance of the company or to influence contractual outcomes that depend on reported accounting numbers (Healy &Wahlen, 1999 cited in Asien, 2012). The definition shows that earnings management is a factor that can reduce the credibility of the financial report, since it will make a bias and might mislead the fi a ial epo t’s use s that thi k this fi a ial epo t is t ue a d did ’t k o that the epo t al ead odified the fi ’s a age e t ho provide that financial report (HernidanSusanto, 2008). Beneish (1999, cited in Asien, 2012)stated that ea i gs a ipulatio a age e t as do e if fi ’s a age s iolate ge e all a epted a ou ti g p i iples GAAP to ep ese t fi ’s fi a ial performance. The most popular and common form of earnings management is income smoothing (Scott, cited in Mila &Supatmi, 2012).
Income Smoothing
managersdo an income smoothing, which are efficiency (to increase investor trust about the firm performance) and opportunity (to gain profit from the firm itself) (Utomo&Siregar, 2008).
Income smoothing concept actually matches with earnings management, which using agency theory. This statement supported by Attia (2012), which stated that since, the forecasts on earnings aregenerally based on the previous firm income, earnings management practices lead to income smoothing.Moreover about income smoothing, Utomo and Siregar (2008) stated that there are two forms of income smoothing, which are naturally income smoothing (naturally happened without alte atio a d i te tio all i o e s oothi g eated fi ’s a age e t, eithe real income smoothing or artificial income smoothing). Then, if an income smoothing was described from the techniques perspectives (Ronen &Sadan, 1981, cited in Ronen &Simeha, 1975), it can be done through a moment that managers considered as the best period to report influctuation profit report, through allocated some income and e pe ditu e i so e epo t’s pe iod, a d th ough lassified a u e of profit as ordinary or extraordinary item.
The easo s of doi g a i o e s oothi g su h as to edu e the fi ’s p ofit a d i ease fi ’s e pe se, so the fi a edu e thei go e e t ta atio , it also a i ease the i esto ’s t ust, si e it ill show the stability of income and dividen that investor want, will keep relationshipbetween managers and employee, since it ill a oid the i easi g sala ’s e uested e plo ee, a d also it ill gi e a psychology effect to economics (Hepwort, 1953). The income smoothing that done by the fi ’s a age e t also ill increase the company image, due to that good company performance which has a low risk investment (Foster, 1986, cited in Suwito&Herawati, 2005).
METHODOLOGY
Population and Sample
This resea h’s populatio s e e o -manufacturing companies which recorded in Indonesian Stock Exchange (ICX/BEI) in period 2007-2011. Then from those numbers of populations that researchers retrieved from Indonesian Capital Market Directory (ICMD) and Indonesian Stock Exchange (www.idx.co.id) in 2007-2011, then the total amount of sample that the researchers observed was 73 companies (Table 1).
Table 1 Research Sample
Companies that listed in Indonesian Stock Exchange in 2007-2011 381
Companies that were not published their financial report in 2007-2011 -68
Companies that experienced loss in 2007-2011 -138
Companies that experienced merger or acquisition in 2007-2011 -102
Total o pa ies that hose as esea h’ sa ple 73
Research Variables and Measurements
Research variable that used in this study was income smoothing. Then, this income smoothing practice was measured using Eckel index (Utomo&Siregar, 2008).
Eckel index was used to measure whether the company does an income smoothing practices or not. Given the formula of income smoothing index:
Income Smoothing Index = �∆� �∆�
Where :
I : The differencein profit for a period S : The differencein salesfor a period CV : Coefficient of variation
If CV I ≥ CV S or Income Smoothing Index 1, then the company will be decided as the company that conduct income smoothing. On the other hands, if CV I < CV S or Income Smoothing Index< 1, then the company will be included in the o pa that did ot s ooth thei i o e’s epo t.While gi e CV I orCV S functions as Variation coefficient of Profit differentiation =� � �� �� �
� ��� ;
where: CV ∆I a d CV ∆“ = Δ�−Δ� 2 −1 ∶∆�
Description:
x : Changes in Profit (I) or Sales (S)
X :Average of changes in Profit (I) or Sales (S) n : Observed Year
Finally, companies that did income smoothing were measured with dummy variable (score 1), and score 0 to show that those companies did not do income smoothing.
DATA ANALYSIS AND RESULTS
Descriptive Statistic
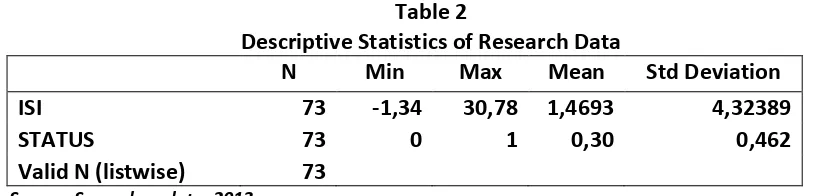
Table 2
Descriptive Statistics of Research Data
N Min Max Mean Std Deviation
ISI 73 -1,34 30,78 1,4693 4,32389
STATUS 73 0 1 0,30 0,462
Valid N (listwise) 73
Source: Secondary data, 2013
Analysis Based on Industry Categories
Based on the findings that can be seen on Table 3.1, almost all sample on agriculture, forestry and fishing industry did not do an income smoothing practice. This statement was made based on the score of profit and sales coefficient, which was lower than 1. From all the samples on agriculture, foresty, and fishing industry, only 1 out of 5 companies (20%) that did an income smoothing.
Table 3.1
Companies Status on Agriculture, Forestry and Fishing Industry
Agriculture, Forestry and Fishing Status
Astra Agro Lestari Tbk AALI 0
Bakrie Sumatra Plantations Tbk UNSP 0
BISI INTERNATIONAL Tbk BISI 0
PP London Sumatra Indonesia Tbk LSIP 1
Sampoerna Agro Tbk SGRO 0
Source: Secondary data that has been calculate, 2013
PP London Sumatra Indonesia (LSIP) is an agriculture company with rubber as the commodity of the company. Within 2007- , LI“P’s i o e o l de eased i 2009, which was 220.068 (billion rupiahs), and also its sales decreased 646.467 (billion rupiahs). Then, the Income Smoothing Index (ISI) of this company was 1.19533.
Table 3.2
Companies Status on Animal Feed and Husbandry Industry
Animal Feed and Husbandry Status
Charoen Pokphand Indonesia Tbk CPIN 0
MalindoFeedmilTbk MAIN 0
Multibreeder adiramaindonesiaTbk MBAI 1
Source: Secondary data that has been calculate, 2013
Within 2007-2011, the income of this company tends to decrease, and it only increased in 2009, which was 164.855 (billion rupiahs). Eventhough the income decreased, but on the other hand, the sales in these periods is tends to increase, and only decreased in 2010, which were 787.085 (billion rupiahs). The Income Smoothing Index (ISI) of this company was quiet big, which was 21,37878.
Table 3.3
Companies Status onMining and Mining Services Industry
Mining and Mining Services Status
Aneka Tambang (Persero) Tbk ANTM 0
Medco EnergiInternasionalTbk MEDC 0
Perusahaan Gas Negara (Persero) Tbk PGAS 1
Source: Secondary data that has been calculate, 2013
Then, based on Table 3.3, nearly all samples on mining and mining services industry also did not do an income smoothing. This statement was made based on the score of profit and sales coefficient, which was lower than 1. From all the samples on mining and mining services industry, only 1 out of 3 companies (33.33%) that did an income smoothing. That means only Perusahaan Gas Negara (Persero) Tbk that did an income smoothing and was being the research sample. This companywas held in 1859 and originally named as Firma L. J. N. Eindhoven & Co. Gravenhage, and then this
company’s name became PT Perusahaan Gas Negara, due to Government Regulation
(PeraturanPemerintah No. 37, Tahun 1994) and based on Certificate of Incorporation No. 486 in 30 May 1996. The company’s income was increased in 2009 and 2010, and
it’s decreased in another three years periods. Within 2007-2011, this company sales
was decreased in two years periods, which were in 2009 and 2011. Then, the Income Smoothing Index (ISI) of this company was 1,01948.
Next analysis was based on construction industry that can be seen on Table 3.4. Almost all companies on this industry (66.66%) did an income smoothing, with the score of profit and sales coefficient, which was 1.Generally, this industry has the biggest percentage in doing an income smoothing.
Table 3.4
Companies Status on Constructions Industry
Constructions Status
AdhiKarya (Persero) Tbk ADHI 1
PetroseaTbk PTRO 1
Total BangunPersadaTbk TOTL 0
Source: Secondary data that has been calculate, 2013
decreased, which was2.039.634 (billion rupiahs). The Income Smoothing Index (ISI) of this company was1,28098.
Next observed company on construction industry was PetroseaTbk, which held in 1972 as the company that has main scope on coal, oil, and gas in Indonesia that has Income Smoothing Index (ISI) was 1.14577. Within 2007-2011, the income of this company decreased in 2008 and 2009. The sales in 2009 of this company also decreased, which was 638.280 (billion rupiahs).
Table 3.5
Companies Status on Transportation Services Industry
Transportation Services Status
Panorama TransportasiTbk WEHA 0
Source: Secondary data that has been calculate, 2013
Based on Table 3.5, the company on transportation services industry did not do an income smoothing. This statement was made based on the score of profit and sales coefficient, which was lower than 1.
Table 3.6
Companies Status on Telecommunication Industry
Telecommunication Status
Telekomunikasi Indonesia (Persero) Tbk TLKM 0
Source: Secondary data that has been calculate, 2013
Table 3.6 showed that the company on telecommunication industry also did not do an income smoothing. This statement was made based on the score of profit and sales coefficient, which was lower than 1.
Table 3.7
Companies Status on Wholesale and Retail Trade Industry
Wholesale and Retail Trade Status
Akbar IndomakmurStimecTbk AIMS 0
Enseval Putra MegatradingTbk EPMT 0
Hero Supermarket Tbk HERO 0
Matahari Putra Prima Tbk MPPA 0
Multi IndocitraTbk MICE 0
Ramayana Lestari SentosaTbk RALS 1
TigaraksaSatriaTbk TGKA 0
Source: Secondary data that has been calculate, 2013
income smoothing, that company was Ramayana Lestari SentosaTbk with Income Smoothing Index was 1.20846. Ra a a a Lesta i “e tosaT k’s i o e de eased i 2009, which was 94.984 (billion rupiahs), but its sales between research periods were typically constant. This company that was held since 1978 is one of the popular department store that exist in Indonesia.
Table 3.8
Companies Status on Banking Industry
Banking Status
Bank BukopinTbk BBKP 0
Bank BumiArtaTbk BNBA 0
Bank Central Asia Tbk BBCA 0
Bank DanamonTbk BDMN 0
Bank HimpunanSaudara 1906 Tbk SDRA 0
Bank Mandiri (Persero) Tbk BMRI 1
Bank MayapadaInternasionalTbk MAYA 0
Bank Mega Tbk MEGA 0
Bank Negara Indonesia Tbk BBNI 0
Bank Nusantara ParahyanganTbk BBNP 1
Bank Rakyat Indonesia (Persero) Tbk BBRI 0
Bank Victoria International Tbk BVIC 0
Source: Secondary data that has been calculate, 2013
Based on the data that can be seen on Table 3.8, there were two banks did an income smoothing, which were Bank Mandiri and Bank Nusantara Parahyangan. Based on that finding, we can conclude that procentage in banking industry which were did an income smoothing was only 16.66%.
Table 3.9
Companies Status on Credit Agencies Other than Bank Industry
Credit Agencies Other than Bank Status
AdiraDinamika Multi Finance Tbk ADMF 1
Clipan Finance Indonesia Tbk CFIN 0
Mandala MultifinanceTbk MFIN 0
Sinar Mas MultiarthaTbk SMMA 0
Trust Finance Indonesia Tbk TRUS 1
Source: Secondary data that has been calculate, 2013
Table 3.10
Companies Status on Securities Industry
Securities Status
Bhakti Capital Indonesia Tbk BCAP 0
KresnaGrahaSekurindoTbk KREN 1
Panca Global Securities Tbk PEGE 1
Reliance Securities Tbk RELI 0
Trimegah Securities Tbk TRIM 1
Source: Secondary data that has been calculate, 2013
Status companies on securities industry can be seen on Table 3.10. Based on the findings that can be seen on that table, 60% companies in this industry did an income smoothing. This statement was made based on the score of profit and sales coefficients on Table 3.10, which were lower than 1. Those companies wereKresna Graha Sekurindo, Panca Global Securities, and Tri Megah Securities.
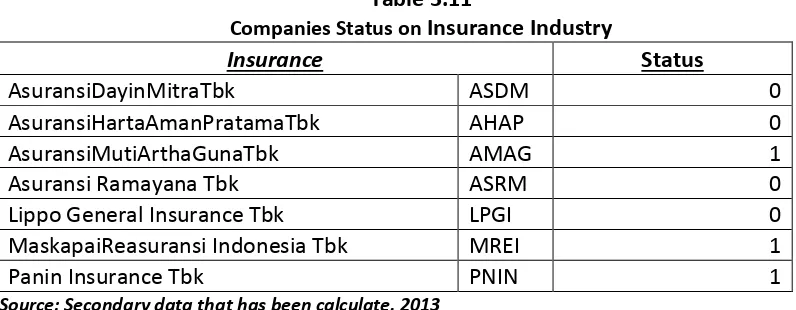
Table 3.11
Companies Status on Insurance Industry
Insurance Status
AsuransiDayinMitraTbk ASDM 0
AsuransiHartaAmanPratamaTbk AHAP 0
AsuransiMutiArthaGunaTbk AMAG 1
Asuransi Ramayana Tbk ASRM 0
Lippo General Insurance Tbk LPGI 0
MaskapaiReasuransi Indonesia Tbk MREI 1
Panin Insurance Tbk PNIN 1
Source: Secondary data that has been calculate, 2013
Then, based on Table 3.11, there were 3 out of 7 companies (42.85%) on insurance industry that did an income smoothing. Those companies were Asuransi Multi Artha Guna, Maskapai Reasuransi Indonesia, and Panin Insurance.
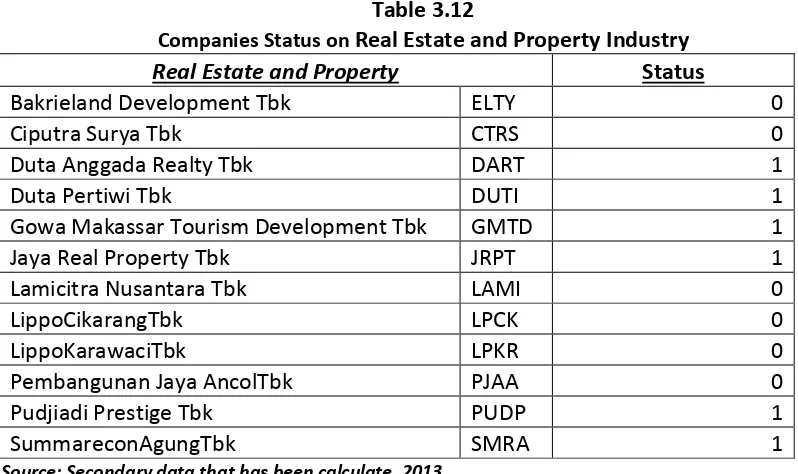
Status companies on real estate and property industry (Table 3.12) showed that there were 6 companies that did an income smoothing, which were Duta Anggada Realty, Duta Pertiwi, Gowa Makassar Tourism Development, Jaya Real Property, Pudjiadi Prestige, andSummereconAgun. On the other word, 50% companies of this industry did an income smoothing.
Table 3.12
Companies Status on Real Estate and Property Industry
Real Estate and Property Status
Bakrieland Development Tbk ELTY 0
Ciputra Surya Tbk CTRS 0
Duta Anggada Realty Tbk DART 1
Duta Pertiwi Tbk DUTI 1
Gowa Makassar Tourism Development Tbk GMTD 1
Jaya Real Property Tbk JRPT 1
Lamicitra Nusantara Tbk LAMI 0
LippoCikarangTbk LPCK 0
LippoKarawaciTbk LPKR 0
Pembangunan Jaya AncolTbk PJAA 0
Pudjiadi Prestige Tbk PUDP 1
SummareconAgungTbk SMRA 1
Source: Secondary data that has been calculate, 2013
The third company was PT Jaya Real Property, Tbk, which engaged in property as its business mainstream, since 1979. This o pa ’s i o e a d sales were relatively stable and never decreased, with income smoothing index was 1.06168. Next company on this industry that did an income smoothing was Pudjiadi Prestige Tbk,which was held in 1983. This o pa ’s i o e s oothi g i de as 1.67102. This o pa ’s i o e a d sales were only decreased in 2007, with respectively 2.849, and 16.686 (billion rupiahs).The last company on this industry that did an income smoothing was SummareconAgungTbk, which has negative changing value in its first three years (2007-2009), but on the other side, its sales amount decreased only in 2009 as big as69.343 (billion rupiahs).
Table 3.13
Companies Status on Hotel and Travel Services Industry
Hotel and Travel Services Status
BayuBuanaTbk BAYU 0
Hotel Sahid Jaya InternasionalTbk SHID 0
Panorama SentrawisataTbk PANR 0
SonaTopas Tourism Industry Tbk SONA 0
Source: Secondary data that has been calculate, 2013
Table 3.14
Companies Status on Holding and Other Investment Industry
Holding and Other Invesment Companies Status
AlakasaIndustrindoTbk ALKA 0
Source: Secondary data that has been calculate, 2013
Companies on holding and other investment industry also did not do an income smoothing. This statement made based on the data that can be seen on Table 3.14.
Table 3.15
Companies Status on Others Industry
Others Status
JasuindoTiga Perkasa Tbk JTPE 0
Media Nusantara Citra Tbk MNCN 0
Radiant UtamaInterinscoTbk RUIS 0
Surya Citra Media Tbk SCMA 1
Source: Secondary data that has been calculate, 2013
Based on the findings that can be seen on Table 3.15, almost all sample on other industry did not do an income smoothing, except 1 out of 4 companies (25%) that did an income smoothing, which was Surya Citra Media Tbk. PT Surya Citra Media Tbk (Perseroan) was held in 2000 with multimedia service, entertainment, and communication, especially in the field of television broadcasting as its main scope of
usi ess. This o pa ’s i o e as o sta t i this esea h pe iods.
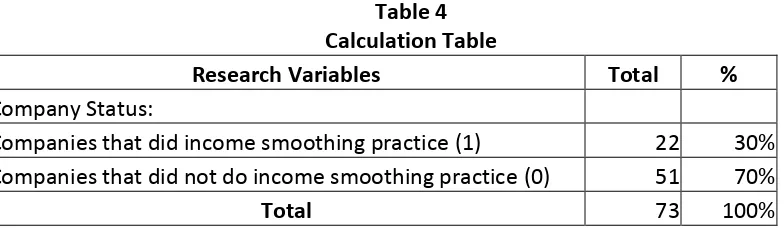
From all Table 3 above, there were 22 companies that did an income smoothing practice, and 51 companies that did not do income-smoothing practice. On the other word, this study found that 30% companies observed have been doing an income smoothing and the rest 70% companies did not do income smoothing practices (Table 4).
Table 4 Calculation Table
Research Variables Total %
Company Status:
Companies that did income smoothing practice (1) 22 30%
Companies that did not do income smoothing practice (0) 51 70%
Total 73 100%
Source: Secondary data that has been calculate, 2013
CONCLUSION
Then, from the analysis that had been done, this study found that the highest number of companies that did an income smoothing practices is fromconstructions industry, which was 66.66% (2 out of 3 observed companies).Eventhough, the highest number that did an income smoothing practices is from constructions industry, but real estate and property industry had the highest income smoothing index, which is 30.7752, due to the high value of DUTI Co pa ’s i o e.
MANAGERIAL IMPLICATION
Based o the esea h fi di gs, the to lea o e aluate a out the o pa ’s pe fo a e, o st u tio i dust ’s i esto s should gi e o e atte tio a out thei financial report, including the investors that also want to invest in real estate and property industry.
LIMITATION AND FUTURE RESEARCH
This study only focus in analyzing companies which did an income smoothing practices based on each industry, but on the other side, researchers were not identify the motivation factors that influencing the companies did an income smoothing. Future research should be more specific or only take sample from one or couple industry to develop the accuracy measurement of income smoothing.
REFERENCES
Almeida, J. E. F., Neto, A. S., Bastianello, R. F. & Moneque, E. Z. (2012). Effects of Income Smoothing Practices on the Conservatism of Public Companies Listed on the BM & FBOVESPA, Revista Contabilidade & Finanças - USP, Vol. 23 Issue 58, pp. 65-75.
Asie , E. N. . It Is Not ea i gs Ma age e t If It Is Not Ea i gs Ma age e t: An Epistemological Dialectic. Journal of Theoretical Accounting Research, 8(1), 73–89.
Ashari, N., Koh H. C., Tan S.L., & Wong W.H. (1994). Factors Affecting Income Smoothing among Listed Companies in Singapore, Journal of Accounting and
Business Research Autumn, 291-304.
Assih, P. &Gundono, M. (1999, 24-25 September). Hubungan Tindakan Perataan laba dengan Reaksi Pasaratas Pengumuman Informasi Laba Perusahaan yang terdaftar di Bursa Efek Jakarta, Simposium Nasional Akuntansi III IAI-Kapd Universitas Brawijaya.
Attia, M.B.R. (2012), Accounting Income Smoothing, Hedgingand Corporate Governance , Global Business and Management Research, Vol.4 No.2, pp. 149-163.
Dewi, S.P., dan Carina. (2008). Faktor-Faktor yang Mempengaruhi Perataan Laba pada Perusahaan Manufaktur dan Lembaga Keuangan Lainnya yang Terdaftar di Bursa Efek Jakarta, Jurnal Akuntansi Tahun XII, No. 02, Mei : 117-131.
Herni&Susanto,Y. K. (2008). Pengaruh Struktur Kepemilikan Publik, Praktik Pengelolaan Perusahaan, Jenis Industri, Ukuran Perusahaan, Profitabilitas, dan Risiko KeuanganTerhadap Tindakan Perataan Laba. Jurnal Ekonomi dan Bisnis
Indonesia 23,3:302-314.
Juniarti&Corolina. (2005). Analisa Faktor-faktor yang Berpengaruh Terhadap Perataan Laba (income smoothing) pada Perusahaan-perusahaan Go Public, Jurnal
Akuntansi dan Keuangan 7, 2:148-162
Michelson, S. E., Jordan-Wagner, J.&Wootto , C. W. 5 , A Ma ket Based A al sis of I o e “ oothi g ,Journal of Business Finance and Accounting, Vol.22 No. 8, pp. 1179-1193.
Mila, E. L & Supatmi. (2012). Analisis Perataan Laba dan Faktor-Faktor yang Mempengaruhinya, Prosiding Seminar Nasional dan Call for Papers. : 3-17. Rivard, Ricard J., Eugene B & Gay B.H. Morris. (2003). Income Smoothing Behaviour of
V.S Banks Under Revised International.
Ronen, J., &Simeha, S. (1975). Classificatory Smoothing : Alternative Income Models,
Journal of Accounting Research Spring:113-377.
Suwito, E., &Herawaty, A. (2005, 15-16 September). Analisis Pengaruh Karakteristik Perusahaan Terhadap Tindakan Perataan Laba yang Dilakukanoleh Perusahaan yang Terdaftar di Bursa Efek Jakarta, Seminar Nasional Akuntansi VIII.
Utomo, S. & Siregar, B. (2008). Pengaruh Ukuran Perusahaan, Profitabilitas, dan Kontrol Kepemilikan Terhadap Perataan Laba pada Perusahaan Manufaktur yang terdapat di Bursa Efek Indonesia, Jurnal Akuntansi Manajemen 19:113-114. Yusuf, M. & Soraya. (2004, 8 Juni). Faktor-faktor yang Mempengaruhi Praktik Perataan
Laba pada Perusahaan Asing dan Non Asing di Indonesia, Jurnal Akuntansi dan