Preparation, Characterization, and Activation of
Co-Mo/Y Zeolite Catalyst for Coal Tar Conversion
to Liquid Fuel
Didi Dwi Anggoro*, Luqman Buchori, Giveni Christina Silaen, Resti Nur Utami
Chemical Engineering Department, Diponegoro University, Jl. Prof. Soedarto, Tembalang, Semarang, Indonesia
Bulletin of Chemical Reaction Engineering & Catalysis, 12 (2), 2017, 219-226
Abstract
One of many efforts to convert coal tar into alternative liquid fuel is by hydrocracking. This research aims to determine the impregnation of Co-Mo/Y zeolite, its characteristics, the effect of impregnation temperature and time, and also the best Co-Mo/Y zeolite impregnation condition for the conversion of coal tar. This research was conducted in several steps, impregnating Co from Co(NO3)2.6H2O and Mo
from (NH4)6Mo7O24.4H2O into Zeolite Y in liquid media, drying at 100 °C for 24 hours, and calcination
at 550 °C for 3 hours. Coal tar was then reacted with hydrogen gas (as a reactant), and Co-Mo/Zeolite Y (as a catalyst) was conducted at 350 °C. Characteristic analysis showed that Co and Mo had impreg-nated into the Y zeolite, as well as it made no change of catalyst’s structure and increased the total acidity. The higher of impregnation temperature was increased the catalyst crystallinity, total acidity, and yield of gasoline. The longer impregnation time was reduced crystallinity value, but total acidity and yield were increased. GC analysis showed that products included into the gasoline product (C8, C9,
and C10).Copyright © 2017 BCREC Group. All rights reserved
Keywords: Catalyst Activation; Catalyst Characterization; Coal tar; Co-Mo/Y zeolite; Catalyst Prepa-ration
How to Cite: Anggoro, D.D., Buchori, L., Silaen, G.C., Utami, R.N. (2017). Preparation, Characteriza-tion, and Activation of Co-Mo/Y Zeolite Catalyst for Coal Tar Conversion to Liquid Fuel. Bulletin of Chemical Reaction Engineering & Catalysis, 12 (2): 219-226 (doi:10.9767/bcrec.12.2.768.219-226)
Permalink/DOI: http://dx.doi.org/10.9767/bcrec.12.2.768.219-226
Available online at BCREC Website: http://bcrec.undip.ac.id
Research Article
1. Introduction
The use of petroleum as a fuel in Indonesia is increasing every year, while the oil produc-tion constantly decreased. To overcome this matter, the government officially issued Regu-lation No. 5 Year 2006 on National Energy Policy where in it is mentioned to reduce petro-leum consumption and increase the consump-tion of other energies such as coal [1].
Coal should not be directly burned, but would be more meaningful and efficient if
con-verted into synthetic fuel or other high value petrochemical materials. One method is by a gasification process. Coal gasification is a process to convert solid coal into flammable coal gas. This process produces by-products such as quite large coal tar. Coal tar has black or dark brown color and categorized as a high viscosity liquid. Coal tar has very complex chemical ponents, includes monocyclic aromatic com-pounds, polycyclic aromatic, and heterocyclic so it has potential to be processed into synthetic fuel. Coal tar is mostly composed of C, H, and O, and also lower concentration of S and N [2]. The aromatics and heteroatoms (S and N) contained in coal tar must be changed and the molecular
* Corresponding Author.
E-mail: [email protected] (Anggoro, D.D.) Telp.: +6224-7460058; Fax.: +6224-76480675
Bulletin of Chemical Reaction Engineering & Catalysis, 12 (2), 2017, 220
weight and viscosity should be lowered. To lower the molecular weight, viscosity, and aro-matics content, the coal tar must be processed by hydrogenation and cracking or hydrocrack-ing. The cracking process requires a catalyst catalytic cracking and hydrocracking is zeolite [4-10].
Wang et al. [11] has done a research using zeolite catalyst, that reaction initially took place at high temperature (without a catalyst), but when using a catalyst, the reaction could take place at lower temperature. Research by Emelik [12] and Tsitsishvili [13] about the effect of Ni and Mo metals showed that catalyst with Ni and Mo required higher specific surface area to produce greater distribution of Mo. Anggoro et al. [14] and Zeno [15] studied the effect of Co and Mo metals addition on Y zeolite and found that at higher concentration of the metal, the catalyst acidity was higher if sup-ported by equitable distribution. Therefore, in this research, the Co and Mo impregnated into Y zeolite was applied to convert coal tar into liquid fuels.
The effect of impregnation temperature and time need to be considered to determine the best preparation of Co-Mo/Y zeolite condition which can be used as a hydrocracking catalyst of coal tar. This has encouraged research to de-termine the effect of impregnation condition of Co and Mo into Y zeolite in coal tar hydrocrack-ing into liquid fuel. Therefore, the objectives of this research are to determine the effect of tem-perature and length time of impregnation on the preparation of the Co-Mo/Y zeolite catalyst, to characterize the Co-Mo/Y zeolite catalyst, and to test the catalyst on the conversion of coal tar to liquid fuel.
2. Materials and Method 2.1. Materials
The materials used were a coal tar from PT. Sango Ceramic Indonesia, Y-zeolite (99.9 %) and ZSM-5 (99.9 %) from Zeolyst International, Co(NO3)2.6H2O (99.0 %) from Merck,
(NH4)6Mo7O24.4H2O (99.3 %) from Merck,
ammonia from Merck, and hydrogen gas (99.99 %) from PT. Aneka Gas.
2.2. Instrumentation
The functional group detection of the cata-lysts was analyzed by Fourier Transform Infra Red (FTIR) Shimadzu IR Prestige-21. The crys-tallinity of catalyst and its structure were done by X-Ray Diffraction (XRD) Shimadzu XRD-7000, and the total acidity determination was conducted using method of ammonia adsorption gravimetrically. The liquid fuel product was analyzed using Gas Chromatogra-phy.
2.3. Preparation and characterization of catalyst
The Co-Mo/Y zeolite catalyst was prepared using impregnation method. Five grams of Y zeolite, cobalt metal obtained from Co(NO3)2.6H2O 0.985 grams, and molybdenum
metal from (NH4)6Mo7O24.4H2O 4.34 grams
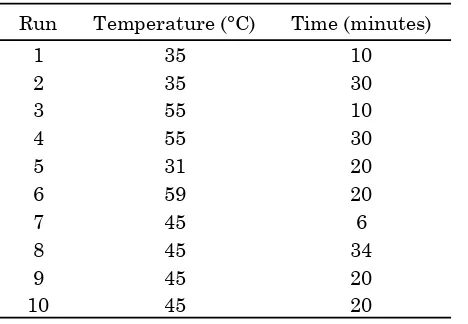
were dissolved in 50 mL of distilled water. The solution was then heated to temperature as stated in independent variables and stirred for the length time as stated in the variables (Table 1). Thus, the samples were filtered us-ing a vacuum pump until no more water was dripping. Further, the samples were dried in an oven at temperature of 100 °C for 24 hours. The dried samples were then calcined at tem-perature of 550 °C for 3 hours. The functional group of the catalysts was analyzed by FT-IR method. The stability of catalyst structure was analyzed by X-Ray Diffraction. The total acid-ity of catalysts was determined using the am-monia gravimetrically method [16].
2.4. Catalyst testing and analysis of prod-uct
Hydrocracking process was performed in a 1000 mL three-neck flask size as a place of coal tar (100 mL), evaporated using a hot plate (300
Run Temperature (°C) Time (minutes)
1 35 10
Bulletin of Chemical Reaction Engineering & Catalysis, 12 (2), 2017, 221
oC, and completed with a magnetic stirrer.
Hy-drogen gas used as the reactant gas of the hy-so the temperature reaction was maintained at 350 °C. Seven grams of catalyst, consisted of 5 grams catalyst which had been prepared (Co-Mo/Y zeolite) and 2 grams ZSM-5 catalyst, was put in the reactor tube. The cooling system of the reactor used a condenser and ethylene gly-col (as coolant). Length time of the hydrocrack-ing reaction was 1 hour.
3. Results and Discussion
3.1. Catalyst characterization using FTIR Catalyst characterization was intended to determine whether Co and Mo had impreg-nated successfully or not into the Y zeolite. Fig-ure 2 explained FTIR spectra to show the char-acteristic of the Y zeolite and the Co-Mo/Y zeo-lite. From the Figure 2, it is indicated that im-pregnation of Co and Mo at temperature and length time as independent variables did not cause changes structure of the catalyst. Prepa-ration of catalyst using impregnation method aims to elicits metal which can expand the sur-face active site catalyst. shift is caused by a reduction of Al atoms in the framework to become Al non-framework due to dealumination during catalyst calcination [17].
At temperature of 200 °C, protons in zeolite have high mobility, while at 550 °C are sepa-rated as water to form the Lewis site as de-scribed in Figure 3.
The presence of water vapor constantly strengthens the structure stability of Lewis site structure, and the result is called "actual Lewis sites" which can be seen in Figure 4. The peak in the standard spectrum of Y zeolite at 1400.62 cm-1 is present, but not detected in ten
samples. According to Coates [17], the peak in-dicates –OH. There is also a peak at 829.49 cm-1 on spectrum of Y zeolite standard which
indicates C–H [17]. Meanwhile, the spectrums of Co-Mo/Y zeolite have a shift at that wave numbers thought caused by impregnation of the Co and Mo. Also, there was appearance of two peaks near wave numbers of 902 cm-1 and
945 cm-1, while there was not detected in
spec-tra standard of Y zeolite before. The peak area indicates asymmetrical strain O–Si–O and O–Al–O [17]. The appearance peak strengthens the presumption of Co and Mo had impregnated into catalyst accordance impreg-nation temperature and time variables. 3.2. Effect of impregnation temperature and time to the Co-Mo/Y zeolite crystallin-ity
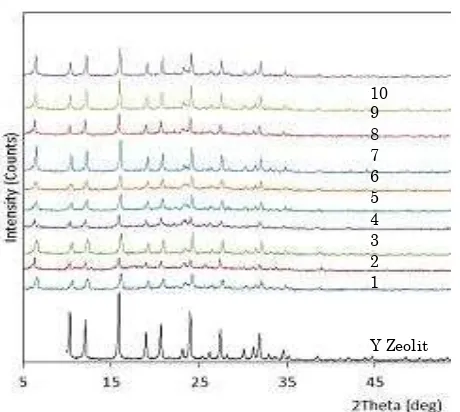
It can be observed in Figure 5 that the in-tensity of the ten Co-Mo/Y zeolite catalysts dif-fractogram tend to decrease. The catalyst crys-tallinity is calculated by comparing the inten-sity of the eight strongest peaks of Co-Mo/Y zeolite with that of Y zeolite (Table 2). The catalyst crystallinity decreased when Co and Mo were impregnated on the zeolite. This is probably due to the presence of Co and Mo into Y zeolite. However, the ten catalysts have simi-lar pattern with the Y zeolite, so it can be said
Figure 2. FTIR spectra of Y zeolite and Co-Mo/Y zeolite
Bulletin of Chemical Reaction Engineering & Catalysis, 12 (2), 2017, 222
that the crystallinity of Y zeolite was not dam-aged after impregnating Co and Mo [14-15]. This is consistent with the results of FTIR analysis where the graph shows that the struc-ture does not change after impregnating Co and Mo.
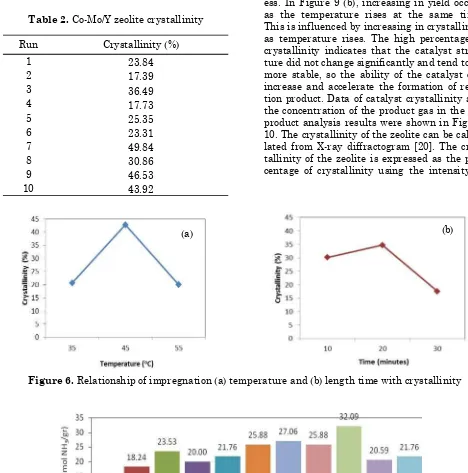
Based on Figure 6 (a), at the same impreg-nation time, it can be seen that higher the tem-perature, higher the degree of catalyst crystal-linity. According to Krichko [18], the increasing of impregnation temperature may increase the mobility of the chains bond in the catalyst, which may occur in the area of the crystal structure. The high mobility leds to the compo-sition of the chain becomes tights and thus ex-pand the areas of crystal structure. However, there are deviations in the chart, which is a de-crease of crystallinity as the temperature rises at impregnation time of 20 minutes and tem-perature of 60 °C.
Figure 6 (b) indicates that at the same im-pregnation temperature, there is an increasing of crystallinity due to the longer impregnation time. The decline trend occurred may be caused by the metal deposits on the catalyst samples that cover the surface of the pores which in turn changes the characteristics of the zeolite crystal and causes a decrease in the intensity of the curve [19]. The longer impregnation time causes the high amount of Co and Mo are im-pregnated, and the catalyst crystallinity has decreased.
3.3. Effect of impregnation temperature and time to total acidity
According to Figure 7, it can be seen that in-creasing of total acidity occurs after impregna-ting Co and Mo into Y zeolite. The measured
acidity of catalyst is calculated as the sum of total Brönsted acid and Lewis acid. In the cata-lysts impregnated with metal, the metals do-nate the amount of the acidic Lewis site. This is consistent with the analysis results of in-creasing trend in the acidity of the catalyst with the addition of Co and Mo into Y zeolite [14,15].
At the same impregnation time, it can be seen in Figure 8 (a) that the raising impregna-tion temperature increases the total acidity at 10 minutes and decreases at 30 minutes. Meanwhile, at 20 minutes impregnation length time decreases followed increases. To find out the cause of this phenomenon is expected for further Co-Mo/Y zeolite catalyst characteriza-tion.
Figure 4. The process of structural stability from Lewis site into actual Lewis site Figure 3. The process of release of a proton from Brönsted site into Lewis site
Lewis Site Actual Lewis Site
Brönsted Site
Lewis Site
10 9 8 7 6 5 4 3 2 1
Y Zeolit
Bulletin of Chemical Reaction Engineering & Catalysis, 12 (2), 2017, 223
Based on Figure 8 (b), at same impregnation temperature, it can be seen that at the longer impregnation time, the total acidity of the cata-lyst is increased. This is likely due to that at the longer time, the more ammonia is absorbed by the Co-Mo/Y zeolite catalyst. However, a de-viation occurs at 45 °C and 20 minutes caused by incompletely distribution of ammonia ad-sorption.
3.4. Effect impregnation temperature and time to liquid fuel product
According to Figure 9 (a), at the same im-pregnation temperature, increasing in time causes increasing in product yield. This may be due to roles of acidity and crystallinity of the catalyst. This is consistent with the previous discussion in which the increase in impregna-tion length time leads to increased acidity. Therefore, the high acidity of catalyst enhances the catalyst performance during cracking proc-ess. In Figure 9 (b), increasing in yield occurs as the temperature rises at the same time. This is influenced by increasing in crystallinity as temperature rises. The high percentage of crystallinity indicates that the catalyst struc-ture did not change significantly and tend to be more stable, so the ability of the catalyst can increase and accelerate the formation of reac-tion product. Data of catalyst crystallinity and the concentration of the product gas in the GC product analysis results were shown in Figure 10. The crystallinity of the zeolite can be calcu-lated from X-ray diffractogram [20]. The crys-tallinity of the zeolite is expressed as the per-centage of crystallinity using the intensity of
Figure 7. Value of total acidity of Y zeolite and Co-Mo/Y zeolite
Figure 6. Relationship of impregnation (a) temperature and (b) length time with crystallinity (a)
Run Crystallinity (%)
1 23.84
2 17.39
3 36.49
4 17.73
5 25.35
6 23.31
7 49.84
8 30.86
9 46.53
10 43.92
Table 2. Co-Mo/Y zeolite crystallinity
Bulletin of Chemical Reaction Engineering & Catalysis, 12 (2), 2017, 224
the main peak at 2 = 22.5-24.4o in the XRD
pattern.
From Figure 10, it is obtained the relation-ship between the Co-Mo/Y zeolite crystallinity at impregnation temperature and impregnation length time with the concentration of the gas contained in coal tar products of the hydro-cracking process. The figure indicated that the impregnation temperature and the impregna-tion length time caused the differences of crys-tallinity. However, the concentration of gaso-line (%) increases with increasing both vari-ables. According to Figure 10, it can be seen that at higher percentage of the Co-Mo/Y zeo-lite crystallinity, the greater the concentration of the fuel produced, except for crystallinity at 17.73 and 23.31 %. The crystallinity is a very important factor that influencing the nature of the catalyst. The high crystallinity indicates that the catalysts, which are free from impuri-ties and physical properimpuri-ties (catalytic proper-ties of high, stable at high temperatures, and extensive porosity), are not disturbed [21-23].
As a result, performance can be run optimally, so that produce more product.
3.5. Analysis of liquid fuel
GC-MS analysis showed peak gasoline in the range of 1.3-19.9 minutes explaining ten different products. The gasoline concentration on the ten products can be determined by cal-culating the concentration of GC peak results which are in the range of gasoline. As compari-son, a commercial gasoline sample is obtained from gas station where GC-MS analysis indi-cates that the components contained in the produced gasoline have a number of chains of carbon atoms ranging from C2-C10.
Consideration of the suitability using hydro-carbons for gasoline is based on the volatility and octane number. In general, the gasoline has a component of C5-C8, but some products
are up to C9 or more [19]. In the range of C5-C8,
it contained aromatic isomers with branched-chain or cyclic good in the use of gasoline as a motor fuel. This is consistent with the results
Figure 9. Relationship of impregnation (a) time and (b) temperature with yield
(a) (b)
Figure 8. Relationship of impregnation (a) temperature and (b) time with acidity
Bulletin of Chemical Reaction Engineering & Catalysis, 12 (2), 2017, 225
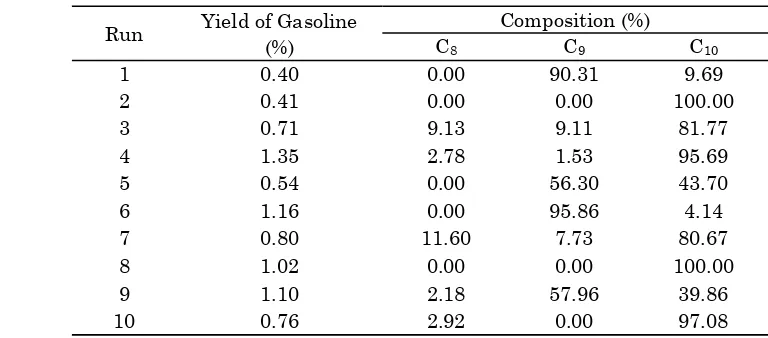
of GC analysis of the ten products in Table 3 that most of products contains C8, C9, and C10.
Table 3 shows that the best impregnation con-dition to get the best yield is by impregnation method at temperature of 55 °C and 30 min-utes. Results of Table 3 and Figure 7 showed that the yield of gasoline depends on the acidity of catalyst. The yield of gasoline increases with increasing of the catalyst acidity.
4. Conclusions
In conclusion, the catalyst performance of Zeolite Y and Co-Mo/Zeolite Y was significantly affected by physicochemical properties of the catalyst. Impregnation of Co and Mo on the zeolite at temperature and length time of im-pregnation did not affect structure of the zeo-lite Y catalyst, and even increased the total acidity of the zeolite Y. Increasing the impreg-nation temperature led to improved catalyst crystallinity and acidity as well as the yield of gasoline. Meanwhile, the longer the
impregna-tion length time, the more reduced the catalyst crystallinity, but total acidity the catalyst and yield increased. From GC analysis showed that the liquid fuel products in the range of gasoline
comprising C8, C9, and C10. Crystallinity of
the Co-Mo/zeolite Y catalyst was the highest when impregnated at a temperature range of 40-50 oC and length time of 5-20 minutes. In
order to get the highest liquid fuel yield, the catalyst should be impregnated at temperature of 55 °C and length time of 30 minutes. Acknowledgement
The authors gratefully acknowledge the fi-nancial support from Diponegoro University DIPA Number 214-05/UN7.5.1/PG/2015 and support from PT. Sango Ceramic Indonesia for Feedstock Coal Tar.
References
[1] Government Regulation (PP) Republic of
In-donesian, Number 5 year 2006.
[2] Rokhati, N. (1999). Pirolisis Tir Batu Bara
Secara Sinambung, Master Thesis.
Univer-sitas Gajah Mada (in Indonesian)
[3] Fanani, Z. (2010). Hidrocrakcing Tir
Ba-tubara Menggunakan Katalis Ni-Mo-S/ZAA untuk Menghasilkan Fraksi Bensin dan
Fraksi Kerosen, Jurnal Penelitian Sains,
1006(08): 22-33 (in Indonesian)
[4] Sayan, S., Paul, J. (2002). Hydrogenation of Naphthalene and Methylnaphthalene: Model-ing and Spectroscopy. J. Molec. Catal. A: Chem., 185: 211-222.
[5] Ramirez, J., Rayo, P., GutiRrez-Alejandre, A.,
Ancheyta, J., Rana, M.S. (2005). Analysis of the Hydrotreatment of Maya Heavy Crude with Ni Mo Catalysts Supported on TiO2
-Al2O3 Binary Oxides: Effect of the
Incorpora-tion Method of Ti. Catal. Today, 109: 54-60.
Figure 10. Relationship between crystallinity and concentration of gasoline
Table 3. Yield and composition of C8, C9, and C10 in gasoline
Run Yield of Gasoline Composition (%)
(%) C8 C9 C10
1 0.40 0.00 90.31 9.69
2 0.41 0.00 0.00 100.00
3 0.71 9.13 9.11 81.77
4 1.35 2.78 1.53 95.69
5 0.54 0.00 56.30 43.70
6 1.16 0.00 95.86 4.14
7 0.80 11.60 7.73 80.67
8 1.02 0.00 0.00 100.00
9 1.10 2.18 57.96 39.86
Bulletin of Chemical Reaction Engineering & Catalysis, 12 (2), 2017, 226
[6] Arribas, M.A., Martınez, A. (2002). The Influ-ence of Zeolite Acidity for the Coupled
Hydro-Genation and Ring Opening of
1-Methylnaphthalene on Pt/USY Catalysts. Appl. Catal. A: Gen., 230: 203-217.
[7] Leite, L., Benazzi, E., Marchal-George, N.
(2001). Hydrocracking of Phenanthrene over Bifunctional Pt Catalysts. Catal. Today, 65: 241-247.
[8] Gallezot, P. (1979). The State and Catalytic Properties of Platinum and Palladium in Fau-jasite-Type Zeolites. Catal. Rev. Sci. Eng. 20:
Presence of Benzothiophene. Fuel Process.
Technol., 89: 467-474.
[10] Yasuda, H., Sato, T., Yoshimura, Y. (1999). Influence of the Acidity of USY Zeolite on the Sulfur Tolerance of Pd-Pt Catalysts for Aro-matic Hydrogenation. Catal. Today, 50: 63-71.
[11] Wang, L., Shen, B., Fang, F., Wang, F., Tian,
R., Zhang, Z., Cui, L. (2010). Upgrading of Light Cycle Oil via Coupled Hydrogenation
and Ring-Opening over NiW/Al2O3-USY
Cata-lysts. Catal. Today, 158: 343-347
[12] Emelik, B., (1980). Catalysis by Zeolite, Pro-ceeding of an International Symposium, El-sevier Scientific, Publishing Co, New York.
[13] Tsitsishvili, G.V. (1992). Natural Zeolites, Ellis Horwood. New York.
[14] Anggoro, D.D., Hidayati, N., Buchori, L.,
Mundriyastutik, Y. (2016). Effect of Co and Mo Loading by Impregnation and Ion Ex-change Methods on Morphological Properties of Zeolite Y Catalyst, Bulletin of Chemical Re-action Engineering & Catalysis, 11 (1): 75-83.
[15] Zeno, R.R., Tria, F. (2015). Effect of Co and Mo Metal Addition in Co-Mo/Zeolite Y Cata-lyst for Coal Tar Conversion To Liquid Fuel, Undergraduate Thesis, Department of Chemi-cal Engineering, Diponegoro University.
[16] Trisunaryanti, W. (2002). Optimation of Time
and Catalyst/Feed Ratio in Catalytic Crack-ing of Waste Plastics Fraction to Gasoline Fraction Using Cr/Natural Zeolite Catalyst, Indonesian Journal of Chemistry, 2: 30-40.
[17] Coates, J. (2000). Interpretation of Infrared Spectra, A Practical Approach, in R.A. Meyers (Ed.) Encyclopedia of Analytical Chemistry, John Wiley & Sons Ltd, Chiches-ter.
[18] Krichko, A.A., Maloletnev, A.S., Mazneva, O.,
Gagarin, S.G. (1996). Catalytic Properties of High-Silica Zeolite in Hydrotreatment of Coal Liquefaction Product, Fuel, 76: 683-685.
[19] Anggoro, D.D, Amin, N.A.S. (2006). Methane to Liquid Hydrocarbons over Tungsten-ZSM-5 and Tungsten Loaded Cu/ZSM-5 Catalysts, Journal of Natural Gas Chemistry, 15: 340-347.
[20] Amin, N.A.S, Anggoro, D.D. (2002).
Dealumi-nated ZSM-5 Zeolite Catalyst for Ethylene O-ligomerization to Liquid Fuels, Journal of Natural Gas Chemistry, 11: 79-86.
[21] Hassan, A., Ahmed, S., Ali, M.A., Hamid, H.,
Inui, T. (2001). A Comparison between [Beta]- and USY-Zeolite-Based Hydrocrack-ing Catalysts. Appl. Catal. A: Gen., 220: 59-68.
[22] Li, L., Quan, K., Xu, J., Liu, F., Liu, S., Yu, S., Xie, C., Zhang, B., Ge, X. (2014). Liquid Hydro-Carbon Fuels from Catalytic Cracking of Rubber Seed Oil using USY as Catalyst, Fuel, 123: 189-193.
[23] Trisunaryanti, W., Purwono, S., Putra, A.
(2008). Catalytic Hydrocracking of Waste Lu-bricant Oil Into Liquid Fuel Fraction Using ZnO, Nb2O5, Activated Natural Zeolite Their
Modification, Indonesian Journal of Chemis-try. 8: 342-347.
Selected and Revised Papers from The 2nd International Seminar on Chemistry (ISoC 2016) (Surabaya, 26-27 July 2016) (http://chem.its.ac.id/isoc-2016/) after Peer-reviewed by Scientific Committee of ISoC 2016 and