www.elsevier.com / locate / livprodsci
Estimation of genetic parameters for daily milk yield of
primiparous Ayrshire cows by random regression test-day
models
*
¨
¨ ¨
Anne Kettunen, Esa A. Mantysaari , Jukka Poso
Animal Production Research, Agricultural Research Centre of Finland-MTT, FIN-31600 Jokioinen, Finland
Received 19 March 1999; received in revised form 13 January 2000; accepted 26 January 2000
Abstract
Test-day data comprising of 63,331 test-day milk records of 6310 primiparous Finnish Ayrshire cows were used to estimate genetic parameters for daily milk production. Two alternative random regression (RR) sub-models were used to describe breeding values for the shape of lactation curves of individual cows: a five parameter logarithmic polynomial (ASM) or a normalised third order orthogonal polynomial. Permanent environment (PE) of a cow was described by either a common PE effect (ASM and OPMPE1) or a normalised third order orthogonal polynomial (OPMPE4). Variance components were estimated with an animal model using EM-REML. A multitrait (MT) approach together with continuous covariance function (CF) was used to derive reference for RR estimates. Heritability estimates obtained by ASM (0.41–0.60) and OPMPE1(0.28–0.53) were higher than those derived from CF analysis (0.20–0.28). Fitting the RR sub-model for PE effects strongly influenced the magnitude of heritability estimates (0.23–0.36). Estimates of heritability were found to be highest during early and late lactation when estimated by ASM and OPMPE1models, while the converse was true for those derived by CF. Estimates obtained by the OPMPE4model were highest at the beginning of lactation and between 183 and 256 days in milk. Genetic correlations were high between consecutive test days, but decreased when intervals between test days increased. Where models ASM and OPMPE1 indicated a negative correlation between distant test days, OPMPE4 estimates were consistent with those of CF. Due to the statistical complexity of RR test-day models use of MT is a more feasible approach for the estimation of (co)variance components for CF coefficients. 2000 Elsevier Science B.V. All rights reserved.
Keywords: Dairy cattle; Test-day model; Random regression; Heritability; Genetic correlation
1. Introduction of milk, protein and fat yield, and milk protein and
fat content. Within the national milk recording In Finland estimates of dairy cattle breeding scheme, daily milk yields are measured monthly, values (BV) are based on 305-day lactation records while milk protein and fat content are assessed bimonthly. These recordings are subsequently aggre-gated into a measure of lactation yield. Since in-*Corresponding author. Tel.: 1358-3-41-881; fax: 1
358-3-dividual test-day (TD) records are weighted by the 4188-3618.
¨
E-mail address: [email protected] (E. Mantysaari) duration of testing periods to give 305-day milk
¨
yield, it approximates mean TD milk production to differ from 1.0 (Kettunen and Mantysaari, 1996). throughout lactation. This finding supported the hypothesis that inclusion Attempts to improve the accuracy of BV estima- of RR function in BV estimation of dairy cattle from tion and a need to provide more comprehensive TD data is necessary. A random regression TD management information to farmers has stimulated approach has been recently used for both estimation an increased interest in the use of original TD of genetic parameters and genetic evaluation of measurements instead of aggregated lactation re- production traits (Jamrozik and Schaeffer, 1997; cords. Use of the TD approach allows a more Kettunen et al., 1997; Jamrozik et al., 1997a). detailed statistical model to be developed, which can Use of RR test-day models in variance component account for genetic and environmental variation estimation has, however, turned out to be somewhat specific to individual TD yields. For the Finnish problematic. Firstly, very high estimates of heritabili-dairy cattle BV estimation the greatest advantage ty for daily milk yield have been reported (Jamrozik afforded would be a more precise definition of the and Schaeffer, 1997; Kettunen et al., 1997), and the contemporary group (CG). The current animal model pattern of estimates is contradictory to that estimated uses herd-calving year (HY) to describe CG. Further with multitrait models (Meyer et al. 1989; Pander et partitioning of HY according to calving season is not al., 1992). Secondly, RR analysis has resulted in possible due to small herd sizes. Year of calving antagonistic relationships between early and late leads into an illogical grouping of records, since a lactation daily yields of protein (Jamrozik and situation can arise, where cows produce for the Schaeffer, 1997) and milk (Kettunen et al., 1997). majority of their lactation under the same environ- This is due to deficiencies in the definition of cow ment but are assigned to different classes according permanent environmental effects. Inclusion of RR to HY. Furthermore, HY characterises long-term function to describe PE effects can potentially im-effects of a particular calving year in a herd rather prove the properties of the statistical model. Thirdly, than short-term variation due to management effects when a logarithmic polynomial function was used, at the time of production. Since season of production RR coefficients were found to be highly correlated: accounts for more environmental variation than herd- additive term and second order polynomial (20.97),
calving year-calving season (HYS) (Swalve, 1995; and first and second order logarithms (20.98), in
¨ ¨
Poso et al., 1996), the use of the TD approach, where particular (Kettunen et al., 1997). An orthogonal CG is defined as herd-test month (HTM), improves polynomial function as RR sub-model could be used the properties of the statistical model. Furthermore, to overcome problems of dependency between vari-solutions of HTM effects can be utilised to improve ables.
herd management. The objective of this study was to estimate genetic The genetic shape of the lactation curve can be parameters for first lactation TD milk yield of modelled by fitting regression coefficients within an Finnish Ayrshire cows. Two RR models with tradi-animal, commonly referred to as random regression tional consideration of PE effects were used: loga-(RR) coefficients (Schaeffer and Dekkers, 1994). rithmic polynomial and normalised third order ortho-Additive genetic solutions are simply a set of BV gonal polynomial functions. In addition, the effect of estimates for the RR coefficients (Jamrozik et al., modelling PE (co)variance structure with RR func-1997a). The product of these estimates and the days tion on genetic parameters was assessed. Finally, in milk (DIM) dependent covariates give a BV of an results from RR analysis were evaluated by com-animal for each TD yield. This allows the genetic parison with estimates derived from a multitrait ranking of animals to vary at different stages of model (MT) by continuous covariance function. lactation. In addition, differences between actual and
expected production can be calculated to monitor the
management of individual herds and of individual 2. Material and methods cows within a herd.
Within a primiparous Finnish Ayrshire cow popu- 2.1. Data lation genetic interrelationships between TD milk
Table 1 For MT analysis, lactations were divided accord-Summary statistics of test-day data ing to DIM at test to give 16 traits (Table 2). Traits
Herds 78 indicate TD milk production at a certain stage of
Herd years 707 lactation and are therefore referred to as interval milk
Herd-test months 8038
production (IMP). Short intervals were used to
Cows 8351
distinguish critical changes of daily yields during the
Cows with records 6310
beginning of lactation (4–30 DIM) i.e. IMPs 1–3.
Test-day observations 63,331
Sires 1900 Intervals of 20 days described IMPs 4–6 (31–90
Sires with daughters with records 1380 DIM) and 13–16 (271–350 DIM), whereas mid-Mean of test day milk yield (kg) 20.3
lactation was divided into 30 day intervals to give IMPs 7–12 (91–270 DIM).
Centre originated from the national milk recording
database and comprised all TD measurements col- 2.2. Statistical model and methods lected since 1988. Incomplete data at the beginning
of the database and of short lactations were excluded 2.2.1. Multitrait model
to maximise the number of observations per animal. To estimate heritability for 16 IMPs and genetic Consequently, TD milk yields produced from 4 to correlations between them, 37 trivariate REML runs 350 DIM of cows calving between April 1988 and were conducted. The same multitrait linear model March 1996 were used. To attain an informative and was assumed for each IMP record to estimate representative CG size, data from 78 herds with (co)variance components. For IMP in the tth interval between 7 and 14 heifers calving each HY was used. the following model was used:
As a result, 63,331 TD milk records of 6310
y 5age 1DCC 1YS 1herd
thijkmno th ti tj tk
primiparous Finnish Ayrshire cows were obtained
*
1b DIM 1HY 1a 1e
(Table 1). Pedigree information for animals without t thijkmno tm tn thijkmno
records was traced back two generations. Cows with (1) records were daughters of 1380 sires, while after
removing the non-informative animals from the where ythijklmno is the IMP record; ageth is the fixed pedigree the total number of male and female effect of calving age; DCCti is the fixed effect of animals in the data was 1900 and 8351, respectively. days carried calf; YS is the fixed effect of calvingtj
year-season class; herd is the fixed effect of herd; btk t
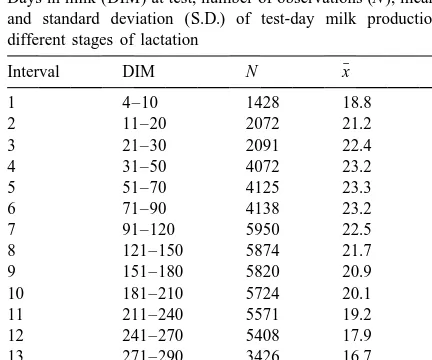
is the regression coefficient of IMP on days in milk; Table 2
¯
Days in milk (DIM) at test, number of observations (N ), mean (x ) DIMthijkmno is the covariate of days in milk at test; and standard deviation (S.D.) of test-day milk production at HY is the effect of herd-calving year, a is the
tm tn
different stages of lactation
additive genetic effect of an animal n and ethijkmno is ¯
Interval DIM N x S.D. the residual associated with y . Calving age
thijkmno
divided into 7 groups indicated the age of the cow at
1 4–10 1428 18.8 4.1
2 11–20 2072 21.2 4.1 first calving. Five classes of DCC effect described 3 21–30 2091 22.4 4.0 the number of days from the last insemination to test.
4 31–50 4072 23.2 4.3
Pregnancy during the first 120 days was assumed to
5 51–70 4125 23.3 4.3
have no effect on milk production, and therefore
6 71–90 4138 23.2 4.4
DCC effect was excluded from models for 1–7
7 91–120 5950 22.5 4.5
8 121–150 5874 21.7 4.4 IMPs. Combining 9 calving years and 3 month
9 151–180 5820 20.9 4.4 classes within each year (March–June,
July–Sep-10 181–210 5724 20.1 4.3
tember, October–February) gave 26 calving
year-11 211–240 5571 19.2 4.4
season classes. Effects of HY, animal and residual
12 241–270 5408 17.9 4.4
were assumed to be random with zero means and
13 271–290 3426 16.7 4.5
H , G and R are 3 by 3 (co)variance matrices of calving month classes k (X 51, X 5DIM /c,
for the three IMPs in question, and ^ denotes the DIM )) , c5305); HTM is the effect of test month
p m
direct product operator. The (co)variance components of production within herd, and ehijklmnop is the were estimated with restricted maximum likelihood residual associated with yhijklmnop. Classifications for (REML) method and the average information (AI) calving age and DCC effects were identical to those algorithm. The AI matrix is the average of Fisher’s in (1). Herd-test month was used as CG to account information and Newton–Raphson second derivative for short-term environmental variation associated matrices (Johnson and Thompson, 1995). with the time of production in a particular herd.
Estimates from separate REML-runs were com- Two different RR sub-models were used to de-piled to form G and R of order 16 by 16. This was scribe the BVs for the shape of lactation curves of done by using the method of expanded part matrices individual cows (RRSM). Initially, a logarithmic
¨
(Mantysaari, 1999), which guarantees that the result polynomial function was tested in (2), where uq(o)
remains positive definite. To allow comparisons were regression coefficients of TD milk on DIM between estimates of variance components from MT functions describing the shape of a lactation curve and RR analyses, a fourth order continuous co- within an individual cow o, and covariates Xqp
variance function (CF) was fitted on G while for R a identical to those used to estimate average lactation fourth order CF with measurement error was used curves (Ali and Schaeffer, 1987). This model will (Kirkpatrick et al., 1994). Mean DIM was selected to subsequently be referred to as ASM. An alternative represent DIM values of each interval. Then, co- RR sub-model was fitted in models (3) and (4), variance functions were used to predict variance where rq(o)were regression coefficients within a cow, components for individual test days. In our study, and covariates Zqp DIM dependent terms of normal-variance components and genetic parameters derived ised third order orthogonal polynomial function in this manner were used as standard for RR models. (Snedecor and Cochran, 1980). Models (3) and (4) will subsequently be referred to as OPMPE1 and OPM .
2.2.2. Random regression models PE4
Similarly, two methods of accounting for the (Co)variance components for TD milk yield were
permanent environmental (PE) effect of an indi-estimated assuming the following linear RR models:
vidual cow were analysed. Models ASM and 5
OPM assumed a simple structure for within-cow
yhijkmnop5ageh1DCCi1herdj1
O
bq(k )Xq PE1 pq51 covariances, and thus pe described one common
n(o)
PE effect associated with all TD yields of cow o.
1HTM
m
Model OPMPE4 described a more complicated 5
(co)variance structure for PE effect; pq(o) were
1
O
u X 1pe 1e (2)q(o) qp n(o) hijkmnop
within-cow regression coefficients and covariates Z
q51
qp
terms of normalised third orthogonal polynomial or
function. This model separated non-genetic within-4
cow variation into a PE function and a residual term.
1
O
r Z 1pe 1e (3)q(o) qp n(o) hijkmnop A total of 18, 13 and 22 (co)variance components q51
were obtained by ASM, OPMPE1 and OPMPE4, or respectively. Effects of HTM, RRSM, PE and
re-4 4 sidual were assumed random with zero means and 2
where for all models yhijklmnop is TD milk yield; age ,h PE PE1
I^PE for OPM , where I is an identity matrix, A
DCC and herd are as described above; bi j q(k ) are PE4
is the matrix of additive genetic relationships among regression coefficients of TD milk on DIM functions
the animals, and ^ denotes the direct product
Table 3 operator. For ASM matrix G is a 5 by 5, and for
Estimates of variance components and heritability for daily milk OPMPE1 and OPMPE4 4 by 4 (co)variance matrix of yields on selected test days derived by covariance function the RR coefficients for animal effects. In addition,
2 2 2 2 a 2 b
DIM s s s s h
g HY e P
PE denotes the 4 by 4 (co)variance matrix of the RR
coefficients for p. Covariances between HTM, 5 2.68 0.62 10.54 13.84 0.20
25 2.68 0.68 8.73 12.08 0.23
RRSM, pe (or p), and e were assumed zero. The
45 2.81 0.76 8.47 12.04 0.25
(co)variance components were estimated with
re-85 3.19 0.86 9.23 13.28 0.26
stricted maximum likelihood (REML) method and 125 3.45 0.89 9.50 12.85 0.27 the expectation–maximisation (EM) algorithm. 165 3.54 0.95 9.21 13.70 0.28
205 3.49 1.04 9.03 13.56 0.28
265 3.39 0.95 9.36 13.70 0.27
285 3.39 0.80 9.59 13.79 0.26
3. Results and discussion
305 3.45 0.59 10.06 14.11 0.26
a 2 2 2
Phenotypic variance, i.e. sum ofs ,s ands .
g HY e
3.1. Covariance function estimates bs2 2 2
/(s 1 s ).
g g e
3.1.1. Estimates of heritability
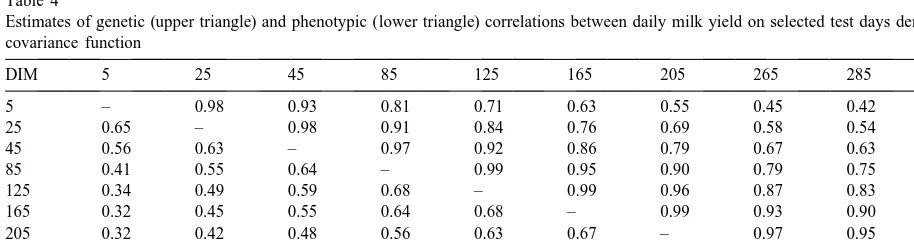
Estimates of heritability for daily milk yield with high and decreased when the interval between TDs CF derived from original MT estimates varied increased (Table 4). Excluding very early lactation, between 0.20 and 0.28 (Table 3). Heritability esti- TD milk yields were found to be more closely mates were highest for mid-lactation and lowest correlated throughout lactation than reported by during early and late lactation. A similar pattern of Meyer et al. (1989). Especially, genetic interrelation-estimates of heritability for individual TD milk ships between late lactation TDs and other TD yields yields within 10 equidistant (30 day) intervals was were found to be much stronger.
reported by Meyer et al. (1989), although the general Phenotypic interrelationships between TD milk level of estimates was somewhat lower (0.17–0.27). yields were weaker, but followed similar patterns as Pander et al. (1992) obtained higher estimates of corresponding genetic correlations (Table 4). Again, heritability throughout lactation (0.27–0.43). In con- excluding very early lactation, phenotypic correla-trast, Reents et al. (1994) obtained low estimates for tions between milk yields at different intervals of the first 3 TDs (0.10–0.21), but those for TDs 4–9 lactation reported by Meyer et al. (1989) were lower were quite consistent with those estimated in this than what was found between TD yields in our data. study. Significantly higher estimates of genetic correlations between TD yields throughout lactation have been 3.1.2. Genetic and phenotypic correlations reported by Pander et al. (1992). However, it has to Genetic correlations between adjacent TDs were be noticed that estimates from literature were true
Table 4
Estimates of genetic (upper triangle) and phenotypic (lower triangle) correlations between daily milk yield on selected test days derived by covariance function
DIM 5 25 45 85 125 165 205 265 285 305
5 – 0.98 0.93 0.81 0.71 0.63 0.55 0.45 0.42 0.38
25 0.65 – 0.98 0.91 0.84 0.76 0.69 0.58 0.54 0.50
45 0.56 0.63 – 0.97 0.92 0.86 0.79 0.67 0.63 0.59
85 0.41 0.55 0.64 – 0.99 0.95 0.90 0.79 0.75 0.71
125 0.34 0.49 0.59 0.68 – 0.99 0.96 0.87 0.83 0.79
165 0.32 0.45 0.55 0.64 0.68 – 0.99 0.93 0.90 0.86
205 0.32 0.42 0.48 0.56 0.63 0.67 – 0.97 0.95 0.92
265 0.31 0.35 0.38 0.42 0.49 0.57 0.65 – 1.00 0.98
285 0.29 0.32 0.34 0.38 0.45 0.53 0.61 0.69 – 1.00
2 ˆ
ˆ 9
MT estimates of TDs within equidistant intervals s 5z G z ,
gc c ASM c
(Meyer et al., 1989) or TDs as recorded (Pander et
where al., 1990), whereas our estimates were derived for
305 individual days by fitting a continuous covariance
z 5
O
z .function on original MT estimates. c i
i51
The genetic variance of TD milk is not estimated 3.2. Random regression model estimates
per se, but is an outcome of simple multiplication. PE variation of a particular TD is estimated in an 3.2.1. Estimation of (co)variances
identical manner, when the RR-function for PE is The values of log-likelihood on convergence were
used. Heritability was estimated by dividing
calcu-2203 991.67, 2199 188.70, and 2197 056.03 for
lated genetic variance by the sum of genetic, PE and models ASM, OPMPE1 and OPMPE4, respectively.
residual components. Estimates of heritability yield-However, the model ASM is not hierarchical with
ed by this approach can be considered as within-herd the other models, and thus the statistical testing
heritability and are comparable with values reported based on likelihood is inappropriate. The likelihood
in the literature, where CG is generally assumed to ratio test of OPMPE4 over OPMPE1 gives a test
be a fixed effect. statistics 2132.67 and 9 degrees of freedom. Based
on this the OPMPE4 model fits clearly better to the
3.2.2. Correlations between random regression data than the simpler model of OPMPE1.
coefficients
Estimation of variance components with the RR
Estimates for (co)variance and correlation struc-model predicts variance–covariance structure of RR
ture of the RR coefficients for BVs and PE effect are coefficients. Genetic variance of a particular TD is a
presented in Appendix A. Random regression co-function of this (co)variance matrix and the vector of
ˆ
efficients estimated by ASM (GASM) were highly covariates describing individual lactation curves.
correlated. A strong negative correlation was found Therefore, using the ASM model as an example,
between the additive term and second order polyno-genetic variance of TD milk on day i can be
mial (20.96) and between the first and second order
estimated as:
logarithms (20.97). These results were identical to
2 ˆ
ˆ 9
s 5z G z , those estimated in an earlier study from a smaller
gi i ASM i
data-set (Kettunen et al., 1997). With OPMPE1, where correlations between RR coefficients were
signifi-ˆ
cantly lower (G ). The additive term was
9
zi OPMPE1
correlated with first (0.25), second (20.44) and third
2 2
5
f
1 i / 305 si / 305d ln 305 /is d f sln 305 /id gg
,order (20.82) polynomials. Other interrelationships
were close to zero. Fitting the RR sub-model for PE ˆ
and GASM is 5 by 5 variance–covariance matrix of
effect weakened dependencies between the additive RR coefficients (Jamrozik and Schaeffer, 1997). The
term and both first and second order polynomials of corresponding covariance between TD yields on days
ˆ
BV coefficients (GOPM ). However, the correlation
i and j can be estimated as: PE4
between the additive term and third order polyno-ˆ
ˆ 9
s 5z G z , mial, and between the first and third order
polyno-gij i ASM j
mial strengthened slightly. The strongest correlation between RR coefficients of PE effect (20.55) was
Genetic variances for any period of lactation can
observed between the second and third order polyno-be estimated from the sum of all covariate vectors
ˆ
mials (C ). within an interval, and pre- and post-multiplying OPMPE4
ˆ
matrix GASM by this vector (Jamrozik and Schaeffer,
1997). An estimate of genetic variance for con- 3.2.3. Estimates of heritability
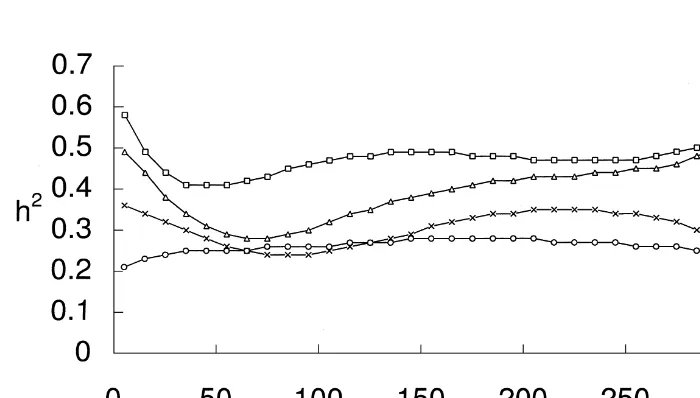
Table 5 0.60) than those from OPM (0.28–0.53), par-PE1
Estimates of variance components and heritability for daily milk ticularly between days 35 and 200 (Fig. 1). Jamrozik yields on selected test days with logarithmic polynomial (ASM)
and Schaeffer (1997) reported somewhat lower and orthogonal polynomial random regression models with one
estimates of heritability with a similar ASM model. common permanent environmental effect (OPMPE1)
However, the pattern of estimates from ASM
analy-ASM OPMPE1
sis was identical to that of Jamrozik and Schaeffer
2 2 2 2 2 2
DIM sg sPa h sg sPa h (1997). Minor differences between estimates may be 5 10.37 19.04 0.58 8.32 18.01 0.49 due to differences in assumed residual variance 25 5.78 14.45 0.44 5.30 14.99 0.38 structures. In our analysis constant residual variance 45 5.11 13.78 0.41 3.81 13.49 0.31
was fitted for all TD yields, whereas Jamrozik and 85 6.07 14.74 0.45 3.49 13.17 0.29
Schaeffer (1997) assumed residual variance to be 125 6.99 15.66 0.48 4.63 14.31 0.35
dependent on DIM. Variance components for HTM 165 7.11 15.78 0.49 5.78 15.46 0.40
205 6.71 15.38 0.47 6.40 16.08 0.43 and residual effects estimated by ASM and OPMPE1 265 6.84 15.50 0.48 7.07 16.76 0.45 were not different (Table 5). In contrast, clear 285 7.60 16.27 0.50 7.86 17.55 0.48
differences in PE and additive genetic variances were 305 8.99 17.65 0.55 9.44 19.13 0.53
observed. These findings indicate that OPMPE1might
2 2 be more successful in differentiating variation due to
Effect s s
additive genetic and non-genetic cow factors. With
HTM 1.18 1.16
ASM a larger proportion of permanent
environmen-PE 4.62 5.67
e 2.87 2.85 tal variation seems to enter the additive genetic
a 2 2 2 2 component.
Phenotypic variance, i.e. sum ofs ,s ,s ands .
g HTM PE e
Distinctly lower estimates of heritability (0.24– 0.36) for daily milk yield were obtained by the animal effects in an identical manner with one OPMPE4 model than with ASM or OPMPE1 (Table common PE-effect. Both models yielded very high 6). Jamrozik et al. (1997b) also reported that esti-estimates of heritability for TD milk production mates of heritability decreased when RR function for (Table 5). Values from ASM were higher (0.41– PE effects was included into the model, although
Table 6 result in an overestimation of heritability. When PE Estimates of variance components and heritability for daily milk effects are modeled by an RR function, covariances yields on selected test days with orthogonal polynomial random
are allowed to vary, providing a more accurate regression model with third order orthogonal polynomial for
estimate of the genetic component. permanent environmental effect (OPMPE4)
From RR models, ASM and OPM gave an
2 2 2 a 2 PE1
DIM s s s h
g PE P
identical pattern of estimates of heritability for TD 5 5.41 7.18 15.16 0.36 milk yield. Heritability was estimated to be highest
25 4.00 5.86 12.43 0.32
at the beginning and end of lactation (Fig. 1). In
45 3.29 6.04 11.89 0.28
contrast, the CF approach estimated lowest
85 3.09 7.23 12.89 0.24
125 3.66 7.42 13.65 0.27 heritabilities for early and late lactation milk yields. 165 4.36 6.80 13.73 0.32 Estimates of heritabilities by OPM followed a
PE4
205 4.76 6.29 13.62 0.35 pattern comparable to other RR models between 1
265 4.39 6.45 13.41 0.33
and 100 DIM, whereas the estimates were similar to
285 4.13 6.87 13.56 0.30
those from the CF approach from 100 to 305 DIM.
305 4.03 7.78 14.37 0.28
Both RR models with a common PE effect gave high
2
Effect s estimates of heritability compared to those from CF
approach, whereas OPM estimates were lower
HTM 1.06 PE4
e 2.57 than CF estimates between days 55 and 135 (Fig. 1).
a 2 2 2 2 The function chosen to describe breeding values
Phenotypic variance, i.e. sum ofsg,sHTM,sPEandse.
appears to determine the pattern of estimated values of heritability. Properties of the functions used may estimates were markedly higher than those from be responsible for high genetic variances during OPMPE4 analysis. Since we used normalised ortho- early lactation and overestimation of heritability at gonal polynomial functions, direct comparisons with the extreme ends of the defined lactation curve estimates reported by Jamrozik et al. (1997b), which trajectory.
defined RR coefficients according to Wilmink Estimates of heritability for the constructed 305-(1987), are not entirely valid. day yield (1–305 DIM) were 0.36, 0.27 and 0.30
Covariance structure between TDs arise from with ASM, OPMPE1 and OPMPE4, respectively. dependencies originating from both genetic and PE
effects. Models assuming a common PE effect for all 3.2.4. Genetic and phenotypic correlations
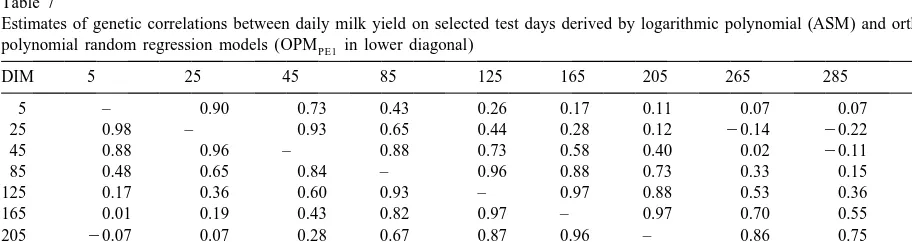
TDs of an individual cow estimate a constant Estimates of genetic correlations obtained by ASM environmental covariance between TDs. Ignoring and OPMPE1 models consistently decreased with changes in the magnitude of covariance appears to increasing intervals between TDs. Negative estimates
Table 7
Estimates of genetic correlations between daily milk yield on selected test days derived by logarithmic polynomial (ASM) and orthogonal polynomial random regression models (OPMPE1 in lower diagonal)
DIM 5 25 45 85 125 165 205 265 285 305
5 – 0.90 0.73 0.43 0.26 0.17 0.11 0.07 0.07 0.06
25 0.98 – 0.93 0.65 0.44 0.28 0.12 20.14 20.22 20.28
45 0.88 0.96 – 0.88 0.73 0.58 0.40 0.02 20.11 20.24
85 0.48 0.65 0.84 – 0.96 0.88 0.73 0.33 0.15 20.02
125 0.17 0.36 0.60 0.93 – 0.97 0.88 0.53 0.36 0.18
165 0.01 0.19 0.43 0.82 0.97 – 0.97 0.70 0.55 0.38
205 20.07 0.07 0.28 0.67 0.87 0.96 – 0.86 0.75 0.61
265 20.16 20.13 20.04 0.24 0.48 0.67 0.85 – 0.98 0.93
285 20.19 20.21 20.18 0.03 0.27 0.49 0.70 0.97 – 0.98
Table 9 were derived for both approaches between yields
Estimates of genetic correlations between constructed 305-day during early and late lactation (Table 7). The general
lactation yield (1–305 DIM) and selected test days derived by level of estimates with these models was lower than logarithmic polynomial (ASM) and orthogonal polynomial ran-that derived by CF. Negative genetic correlations dom regression models (OPMPE1 and OPMPE4)
between the most extreme TD yields may be due to
DIM ASM OPMPE1 OPMPE4
fitting a common permanent environmental effect,
5 0.40 0.26 0.73
which may overestimate true covariance between
25 0.43 0.40 0.80
distant TDs and as a result lead to a severe underesti- 45 0.66 0.57 0.87 mation of genetic correlations between TD yields 85 0.88 0.82 0.94 further than 200 days apart. A similar pattern of 125 0.94 0.91 0.97
165 0.96 0.94 0.98
genetic correlations for daily fat and protein yields
205 0.95 0.94 0.98
has been reported using a comparable RR model
265 0.74 0.75 0.89
(Jamrozik and Schaeffer, 1997). Genetic correlations 285 0.61 0.60 0.79 obtained using the OPMPE4 model were consistent 305 0.46 0.40 0.62 with the CF approach. However, genetic
interrela-tionships between TD milk production at the end of lactation and other TD yields were found to be
weaker than those derived by CF (Table 8). 4. Conclusions Both phenotypic (Table 8) and permanent
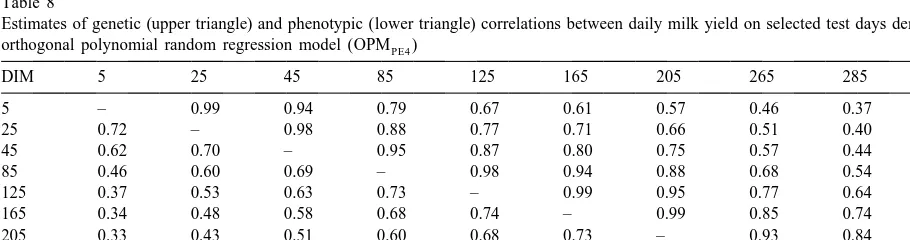
en-vironmental correlations between TD milk yields It seems justified to use RR coefficients to model were lower than genetic correlations. The correla- daily breeding values when original TD measure-tions between permanent environmental effects for ments are utilised for animal evaluation. Use of TDs close by were higher than corresponding genetic models containing RR coefficients to describe breed-interrelationships, but they decreased much faster ing values only resulted in an overestimate of while TDs became more apart. The general level of heritabilities and yielded negative genetic correla-estimates of phenotypic correlations was comparable tions between distant TDs. Consideration of to that of CF estimates. (co)variance structure of PE effects improves the Genetic correlations between constructed lactation properties of the statistical model, due to more yield and TDs in mid-lactation were similar with all precise definition of genetic and non-genetic effects. RR-models (Table 9). However, genetic correlations The form of RR functions seems to have a marked between 305-day yield and TDs during early and late effect on the (co)variance structures projected. In our lactation were estimated to be much higher with analysis, orthogonal polynomials gave better results OPMPE4 than with ASM or OPMPE1, in particular. than logarithmic polynomials. Other forms for RR
Table 8
Estimates of genetic (upper triangle) and phenotypic (lower triangle) correlations between daily milk yield on selected test days derived by orthogonal polynomial random regression model (OPMPE4)
DIM 5 25 45 85 125 165 205 265 285 305
5 – 0.99 0.94 0.79 0.67 0.61 0.57 0.46 0.37 0.23
25 0.72 – 0.98 0.88 0.77 0.71 0.66 0.51 0.40 0.23
45 0.62 0.70 – 0.95 0.87 0.80 0.75 0.57 0.44 0.25
85 0.46 0.60 0.69 – 0.98 0.94 0.88 0.68 0.54 0.33
125 0.37 0.53 0.63 0.73 – 0.99 0.95 0.77 0.64 0.43
165 0.34 0.48 0.58 0.68 0.74 – 0.99 0.85 0.74 0.55
205 0.33 0.43 0.51 0.60 0.68 0.73 – 0.93 0.84 0.68
265 0.29 0.34 0.38 0.45 0.53 0.62 0.70 – 0.98 0.90
285 0.25 0.30 0.34 0.40 0.47 0.56 0.64 0.74 – 0.97
ˆ sub-model, such as the Wilmink-function, could GOPMPE4
further improve the fit. A more flexible (co)variance
1008.71 43.35 284.41 279.48
structure could be assumed for residual terms as
0.10 165.66 21.98 3.65
well, but this again results in a large amount of 5
20.35 20.02 57.40 0.56
3
4
variance parameters, which can cause serious dif- 2
0.86 0.10 0.03 8.44
ficulties in projecting actual (co)variances between TD yields. Such problems become more severe when
ˆ C multi-trait and multi-lactation models are considered. OPMPE4
Consequently, the RR approach to estimate variance
1579.78 43.25 2173.35 73.80
components may be unrealistic. In contrast, use of a
0.06 282.84 23.25 229.90
comparable MT approach as was used in the current 5
20.37 20.02 137.66 243.88
3
4
study could be adopted. Based on MT results a
0.27 20.26 20.55 45.63
computationally feasible parameter structure for RR functions could be selected. A function and its parameters that sufficiently project (co)variances between TDs within and between traits could be
derived. Estimates of (co)variance components for References covariance function coefficients could then be
uti-lised for breeding value estimation. Ali, T.E., Schaeffer, L.R., 1987. Accounting for covariances among test day milk yields in dairy cows. Can. J. An. Sci. 67, 637–644.
Jamrozik, J., Schaeffer, L.R., 1997. Estimates of genetic parame-Acknowledgements ters for a test day model with random regressions for yield traits of first lactation Holsteins. J. Dairy Sci. 80, 762–770. The authors wish to express their appreciation to Jamrozik, J., Schaeffer, L.R., Dekkers, J.C.M., 1997a. Genetic
evaluation of dairy cattle using test day yields and a random the Agricultural Data Processing Centre for provision
regression model. J. Dairy Sci. 80, 1217–1226. of data. The current study is part of a larger project
Jamrozik, J., Schaeffer, L.R., Liu, Z., Jansen, G., 1997b. Multiple assessing the utilisation of test-day records funded by trait random regression test day model for production traits. In: Finnish Animal Breeding Association, Agricultural Proc. of the 1997 INTERBULL meeting, Vienna, Austria, Data Processing Centre, Valio Co., Association of August 28–29, 1997, Vol. Bulletin no. 16, pp. 43–47.
Johnson, D.L., Thompson, R., 1995. Restricted maximum likeli-Rural Advisory Centres and Ministry of Agriculture
hood estimation of variance components for univariate animal and Forestry.
models using sparse matrix techniques and average infor-mation. J. Dairy Sci. 78, 449–456.
¨
Kettunen, A., Mantysaari, E.A., 1996. Estimation of genetic Appendix A parameters for test-day milk production at different stages of lactation of Finnish Ayrshire heifers. Agricultural and Food Science in Finland 5, 185–192.
Estimates for (co)variance (diagonal and above)
¨ ´ ¨ ¨
Kettunen, A., Mantysaari, E.A., Stranden, I., Poso, J., 1997. and correlation (below diagonal) structure for ran- Genetic parameters for test day milk yields of Finnish Ayr-dom regression coefficients of breeding values and shires with random regression model. J. Dairy Sci. 80 (Suppl. permanent environment. 1), 197.
Kirkpatrick, M., Hill, W.G., Thompson, R., 1994. Estimating the 58.08 220.29 236.01 231.32 4.12
covariance structure of traits during growth and ageing,
illus-20.81 10.70 14.41 8.61 20.95
trated with lactation in dairy cattle. Genet. Res. 64, 57–69. ˆ
G 5 20.96 0.90 23.98 18.90 22.31
ASM
Meyer, K., Graser, H.-U., Hammond, K., 1989. Estimates of
3
20.94 0.60 0.88 19.06 22.554
genetic parameters for first lactation test day production of
20.90 20.49 20.79 20.97 0.36
Australian black and white cows. Livest. Prod. Sci. 21, 177–
ˆ 199.
GOPMPE1
¨
Mantysaari, E.A., 1999. Derivation of multiple trait reduced rank 967.72 182.76 2196.82 270.72 random regression (RR) model for the first lactation test day
0.25 552.45 223.62 1.33 records of milk, protein and fat. Paper presented in the 50th 5
Annual Meeting of the European Association for Animal
20.44 20.07 210.32 23.51
Pander, B.L., Hill, W.G., Thompson, R., 1992. Genetic parameters Schaeffer, L.R., Dekkers, J.C.M., 1994. Random regressions in of test day records of British Holstein–Friesian heifers. An. animal models for test-day production in dairy cattle. In: Proc. Prod. 55, 11–21. of the 5th WCGALP Guelph, Canada, Vol. 18, pp. 443–446.
¨ ¨ ¨
Poso, J., Mantysaari, E.A., Kettunen, A., 1996. Estimation of Snedecor, G.W., Cochran, W.G., 1980. In: Statistical Methods, 7th genetic parameters of test day production in Finnish Ayrshire Edition, Iowa State University Press, Ames, pp. 404–407. cows. In: Proc. of the 1996 INTERBULL meeting, Veldhoven, Swalve, H.H., 1995. Test day models in the analysis of dairy The Netherlands, June 23–24, 1996, Vol. Bulletin no. 14, pp. production data – a review. Arch. Tierz. 38, 591–612.
45–48. Wilmink, J.B.M., 1987. Adjustment of test-day milk, fat and
Reents, R., Dekkers, J.C.M., Schaeffer, L.R., 1994. Genetic protein yield for age, season and stage of lactation. Livest. parameters of test day somatic cell counts and production traits. Prod. Sci. 16, 335–348.