Ž .
ISPRS Journal of Photogrammetry & Remote Sensing 55 2000 94–104
www.elsevier.nlrlocaterisprsjprs
Design and implementation of a computational processing system
for off-line digital close-range photogrammetry
Clive S. Fraser
), Kenneth L. Edmundson
Department of Geomatics, UniÕersity of Melbourne, ParkÕille, 3052, Melbourne, Vic., Australia
Abstract
Through the adoption of recent innovations in automation in vision metrology, it can be demonstrated that rigorous, yet user-friendly digital photogrammetric processes of calibration and orientationrtriangulation can be incorporated into a computational scheme which is on the one hand capable of meeting the demands of high metric quality, while on the other offering the facilities necessary to support wider application by non-specialist users. The software system Australis, developed for image mensuration and restitution of off-line close-range photogrammetric networks, is featured to illustrate these processes and procedures. By describing the structure and components of Australis, the authors aim to demonstrate that many processes which have on occasion been viewed to be the exclusive province of automated, high-precision vision metrology are indeed suited to more general application across a broad range of fields which involve 3D object recording via close-range imagery.q2000 Elsevier Science B.V. All rights reserved.
Keywords: measurement automation; vision metrology; close-range photogrammetry; software systems; calibration; orientation
1. Introduction
It could well be argued that over the past half decade, broader adoption by non-specialist users of the technology of digital close-range
photogramme-Ž
try has concentrated in two application domains e.g.,
.
Fraser, 1998 . The first is the use of highly auto-mated off-line and on-line vision metrology systems for industrial measurement, whereas the second is in areas employing low-accuracy, low-cost systems which provide the capability of 3D model building. In the case of industrial vision metrology systems
Že.g., Beyer, 1995; Brown and Dold, 1995; Ganci .
and Handley, 1998 , successful commercial
exploita-)Corresponding author.
Ž .
E-mail address: [email protected] C.S. Fraser .
tion has come about through the development of specialised hardware components such as intelligent cameras, coded targets, measurement probes and
ex-Ž .
terior orientation EO devices. Also, the develop-ment of highly robust and automated photogrammet-ric orientation and calibration processes has con-tributed significantly. Systems designed more for general-purpose 3D modelling, such as
Photomod-Ž .
eler Eos Systems, 2000 and ShapeCapture
ŽShapeQuest, 2000 , are often built on the same.
photogrammetric foundations, though they may, in certain instances, sacrifice the rigor of algorithms and procedures — and therefore accuracy poten-tial — in order to exhibit a high degree of flexibility and ease-of-use. An example might be compromises in image mensuration precision where feature points are recorded by ‘point-and-click’ to the nearest pixel, rather than to the 0.02–0.04 pixel precision achieved
0924-2716r00r$ - see front matterq2000 Elsevier Science B.V. All rights reserved. Ž .
in the measurement of special-purpose targets in vision metrology. Developments in digital close-range photogrammetry have by no means been re-stricted to these two general system categories, though it is true that the most significant commercial exploitation has occurred in automated industrial measurement and 3D model building using imagery from general-purpose digital frame cameras.
Commercial success generally provides an impe-tus to further development, and it is not too surpris-ing therefore that many in the photogrammetric com-munity are focussing upon further innovations in high-precision sensors and the associated sensor cali-bration and orientationrtriangulation procedures. As
Ž .
has been pointed out by Foerstner and Guelch 1999 , however, the priorities of other users, such as the computer vision community, are focused more upon both automation and a comprehensive exploitation of scene knowledge. Regrettably, accompanying a recognition of these divergent priorities is often the view that the two endeavours are to an extent incom-patible. Thus, there is a school of thought that dis-counts advances in vision metrology in regard to their usefulness for more general-purpose automated sensor calibration and orientation. For example, the provision of targeting of any form might be regarded as an unacceptable operational constraint, even though the necessary target field might comprise just half a dozen points in the form of a simple EO device. We also hear the lament that sensor self-calibration is too specialised for broader, low accu-racy applications of digital photogrammetry, and in-deed constitutes an art. Yet, a better focus of atten-tion might be to ascertain whether a comprehensive sensor calibration is even necessary for the applica-tion being considered. Is there really a need to unnecessarily complicate an automatic sensor orien-tation of only modest metric quality given that for such a level of accuracy a reduced calibration model, which is often very stable over time, might suffice? The necessary calibration, for which there are estab-lished fully automatic procedures, could be carried out as a separate operation using some of the very aids that are seen to be a hindrance to
general-pur-Ž
pose 3D scene reconstruction e.g., the use of targets,
.
or EO devices .
The comments above set the scene for the present paper, the basic aim of which is to demonstrate that
rigorous, yet user-friendly digital photogrammetric processes of calibration and orientationr triangula-tion can be incorporated into a computatriangula-tional pro-cess, which is on the one hand capable of meeting the demands of high metric quality, while on the other offering the facilities necessary to support a broader field of applications by non-specialist users of digital photogrammetry. In order to illustrate these processes and procedures, the software package
Aus-tralis is featured. This system for off-line close-range
digital photogrammetry has been developed primar-ily as both an educational tool, and as a computa-tional platform to support applied research. It also serves, however, as a very practical tool for routine semi-automated sensor calibration and orientationr
triangulation. By describing the salient features of
Australis, the authors aim at illustrating that many
processes — which have, on occasion, been viewed to be the exclusive province of high-precision vision metrology — are indeed suited to more general application.
2. Process structure
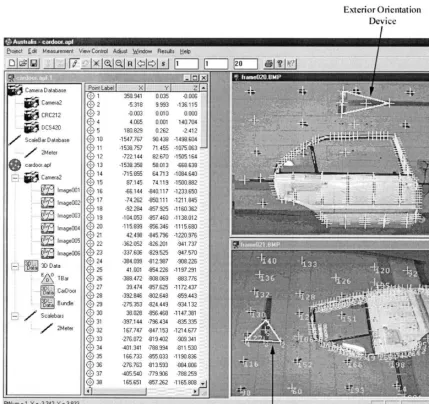
The various components of the computation pro-cesses to be discussed are, perhaps, best illustrated through reference to the basic user-interface structure of Australis, which comprises three main elements: a Project View, an Image View and a Graphics View, as indicated in Figs. 1–3.
2.1. The projectÕiew
The Project View embodies project management aspects as well as the essential elements of the photogrammetric measurement process, namely the
Ž .
camera s employed, the imagery to be measured, and the optional provision of supporting data such as object space information comprising scale con-straints, and object point coordinates for datum as-signment or network orientation.
( ) C.S. Fraser, K.L. EdmundsonrISPRS Journal of Photogrammetry & Remote Sensing 55 2000 94–104
96
Fig. 1. The Project View.
available. Associated with each camera is a
calibra-Ž .
tion file panel B in Fig. 1 , which provides essential data regarding sensor and pixel size, along with values for the standard 10-term, ‘physical’ calibra-tion model comprising interior orientacalibra-tion elements
Žx , y , c , lens distortion coefficients K , K , K ,0 0 . Ž 1 2 3 .
P1 and P2 and terms for differential scaling and
Ž
non-orthogonality between the x- and y-axes b ,1
. Ž .
b2 e.g., Fraser, 1997 . The selection of the parame-ters to be employed in a sensor calibration can be made by the user, or an appropriate default set can be readily adopted. At the outset, it is generally necessary only to have a coarse estimate of the principal distance, c.
To aid in an evaluation of the lens distortion, the radial and decentering distortion profiles can be
dis-played, as indicated by panel C in Fig. 1. An impor-tant feature here is the vertical line beyond which the profile is dashed. This indicates the maximum radial distance used in any of the images forming the network for camera self-calibration. Thus, the dashed line represents the portion of the two profiles which
Ž
is extrapolated since the maximum possible radial distance can be larger than the maximum radial
.
distance actually used in self-calibration , and which might well be avoided in subsequent triangulation using the estimated lens distortion parameters.
To initiate a photogrammetric network formation,
Ž .
a camera or cameras must be assigned to the project, which is effected simply by dragging and
Ž .
dropping the appropriate camera icon s into the
Ž .
Fig. 2. The Image View.
selected for association with the appropriate camera. There is no set limit to the number of cameras or images and several hundred images can be accom-modated. The practical limit to image file size is currently about 25 MB. The reason that many sen-sors can be handled is to support multi-ray triangula-tion from networks of multiple cameras with fixed EO, as encountered in photogrammetric systems for 3D motion analysis applications such as human movement studies, or in cases involving multi-sensor, multi-epoch measurement of dynamic events or structural deformation.
With only the sensor information and associated images at hand, one has the means to perform the 3D object reconstruction at an arbitrary orientation and scale, and possibly also the means to undertake a sensor calibration. However, without supplementary object space information, full automation of the resti-tution process is precluded. There is thus a need to associate object space coordinate information with the project. This may be in the form of preliminary
XYZ coordinates for object points to support
( ) C.S. Fraser, K.L. EdmundsonrISPRS Journal of Photogrammetry & Remote Sensing 55 2000 94–104
98
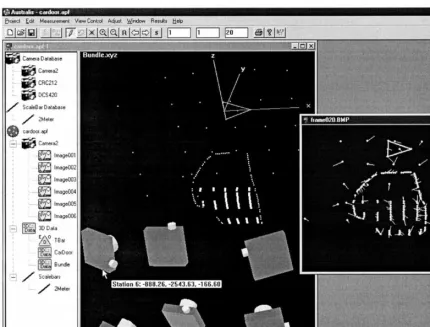
Fig. 3. The Graphics View.
of the camera for either all or a subset of the camera stations in order to support initial fully automated EO. An EO device is simply an automatically recog-nisable cluster of targets, usually 4–6, which have known XYZ coordinates in a local reference system. The targets are in a geometric arrangement, which is conducive to automatic recognition and also to closed-form determination of spatial resection. A robust closed-form resection, providing sufficiently accurate initial sensor EO values, can be achieved even with a relatively small EO device, so long as the target coordinates of the device are reasonably precise. For example, an EO device with a maximum target separation of 20 cm can give a sufficiently accurate initial resection for distances of up to 10 m for a large-area CCD camera with 20-mm lens. An
Ž
example EO device can be seen in Fig. 2 see
.
arrow . Control point information for datum assign-ment can also be input, as can scale information in the form of point-to-point distances. One feature of
Australis is the ability to use scale data, either
rigorously in the bundle adjustment as an observed distance of known a priori precision, as is needed to support self-calibration in multi-camera networks
Ž .
through the use of ‘wands’ e.g., Maas, 1998 , or as a means to simply scale the final object space coor-dinates after the network adjustment.
2.2. The imageÕiew
A prerequisite to fully automated image mensura-tion is an approximate knowledge of sensor EO. Irrespective of whether image coordinate measure-ment is via feature-based matching of interest points, least-squares template matching or centroiding of elliptical targets, the effectiveness of necessary solu-tions of both the image point correspondence prob-lem and the process of resection driveback are influ-enced by the quality of the initial EO. In recognition of this, EO devices have recently become popular and they can prove very beneficial and practical for a wide range of applications, irrespective of whether the 3D scene to be reconstructed is targeted or otherwise.
Within the Australis image mensuration stage, most of the automated processes are contingent upon a preliminary EO, whether it be via an EO device or a more traditional resection approach based on mea-sured ‘control’ points. Prior to EO, however, there is one process that can be carried out to support auto-matic measurement of well-defined image points such as retro-reflective targets. This is an operation which could be termed ‘whole-image scanning’, whereby a preliminary search is made for all valid targets within an image. Following recognition, extraction and vali-dation, special geometric arrangement of targets forming either number codes or an EO device can be
Ž .
identified. Fraser and Shao 1997 have reported on a computational strategy for whole-image scanning, which is suitable to object scenes comprising target arrays and this constitutes a first automated image measurement step in Australis.
As an example, the upper image window shown in Fig. 2 displays the labels of an EO device, along with unlabelled centroids of object target points. This result is achieved via the whole-image scan. The lower image window in Fig. 2 shows a similar situation, which is distinguished by the fact that the targets are labelled. Although this labelling is most often achieved via resection driveback, a viable alter-native — in situations where there is no preliminary object space coordinate information, but there is an EO device or known EO — is to achieve a point matching and labelling via a solution to the image point correspondence problem. Any of a number of methods can be employed for homologous image
point determination, most of which employ epipolar
Ž
line or plane geometry e.g., Maas, 1992; Ariyawansa
.
and Clarke 1997; Furnee et al., 1997 . A most practical solution is to integrate the two approaches: a minimal set of images is employed to effect a solution to the image point correspondence problem for all object feature points, and then resection drive-back is employed to measure image coordinates for the remaining images forming the network. For com-plex networks, this process may need to be itera-tively carried out, though it can be a fully automatic
Ž .
procedure e.g., Ganci and Handley, 1998 for more straightforward network configurations. The concept of coded targets can also be beneficial at this stage. Referring back to the example of Australis,
whole-image scanning can be effected for a single image or for all images. Images are automatically ‘enabled’ and ‘disabled’ depending on the success of the image point measurement process, and in the case of resection driveback, image coordinate
residu-Ž .
als can be displayed see right image in Fig. 3 , as a means to support quality assessment.
A further feature supporting automation in image measurement in Australis is the ability to handle multi-epoch data sets, where the imagery has typi-cally been acquired by multi-camera network config-urations with nominally stable EO. In this instance, it is very common for an image at a given epoch to be very similar to that recorded with the same camera at the previous epoch, even though small deformations
Žobject point movements may have occurred. Here,.
information from the previous image can be em-ployed to ‘drive’ the measurement of each succes-sive image. In this operation, it may also be useful to automatically assign new point labels for any object points subject to deformation. This process is exem-plified by a recently conducted deformation survey of a steel beam as it cooled from close to 10008C to room temperature. Close to 80 epochs of data were collected over several hours in a network of three 2r3 in. CCD cameras, where the object array
con-Ž
sisted of 10 points on the beam subject to
move-. Ž
ment and 20 points away from the beam assumed
.
to be stable . The ‘repeat measurement’ feature in
Australis allowed all images to be automatically
( ) C.S. Fraser, K.L. EdmundsonrISPRS Journal of Photogrammetry & Remote Sensing 55 2000 94–104
100
so images had been measured, it was a simple mat-ter, again within Australis, to carry out bundle ad-justments incorporating anywhere from three images
Žsingle epoch. to 30 images Ž10 epochs. or 240
Ž .
images all epochs . With the required point re-label-ling for deformation monitoring points, a sample interim bundle adjustment of 195 images included 660 object points and took 2.5 min per iteration to process.
As a final word on the image view, Australis also supports the measurements of ‘plumb-lines’ for plumb-line calibration of cameras, as well as features such as lines of targets, etc. It also supports the measurement of non-signalised points, albeit only manually and therefore accurate to 0.3–0.5 pixels. The program does not presently support automated feature point extraction through interest operators, since attempts to fully automate the subsequent im-age matching have proven in many cases to be quite problematic for highly convergent networks and those in which there is a considerable range of perspective disparity. Whilst it is acknowledged that scene knowledge can contribute to making this problem more tractable, an enhancement to the level of au-tomation by keeping the problem domain as straight-forward as possible has been preferred in the devel-opment of Australis. This also assists ease-of-use by non-specialists.
2.3. The Graphics View
The third principal stage of the computational process incorporated in Australis comprises essen-tially three elements, which are grouped for ease of description under the term Graphics View. Upon leaving Image View, it is assumed that either all or a sufficient number of the images forming the network have been measured and have had their EO deter-mined, albeit generally to only moderate accuracy. The network is thus ready for subsequent bundle adjustment or, alternatively, straightforward spatial intersection. Following 3D reconstruction, tools for network analysis can be employed. These comprise straightforward OPEN GL graphics displays of the
Ž
network geometry for visual interpretation e.g., Fig.
.
3 , as well as an integrated process for 3D coordinate transformation and routines to compute best-fitting
planes and lines, to name but two of the best-fit options.
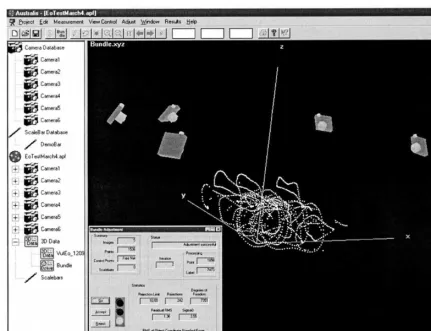
The first stage of the process under the Graphics View is invariably a bundle adjustment, whether for sensor self-calibration, or to perform a precise multi-image triangulation for object point determina-tion. In the interests of automation and ease-of-use, invoking the bundle adjustment should be possible with a minimum of operator intervention. In the case of Australis, one need only click on ‘GO’ in the dialog box indicated in Fig. 4 and a ‘green light’ or ‘red light’ will result.
The ‘one-button’ operation is feasible for two reasons. First, all necessary image-related informa-tion to support a successful bundle adjustment is put in place during the processing associated with Image View, including the preliminary checking of observa-tion data for blunders. Second, the opobserva-tions related to the bundle adjustment, such as observational error detection and the assignment of a datum for the object space coordinate system, default to choices supporting optimal automation and minimal user in-teraction. So, for example, automatic error detection is used, as is free-network adjustment via inner constraints. While the latter is useful in that it yields a minimal mean variance of object point coordinates
Ž
for minimally constrained networks e.g., Mason
.
1994; Fraser, 1996 , it also requires no user-input of
XYZ coordinate ‘control’. The option of using object
space control and of manually setting various prefer-ences is available, and these options assume impor-tance from an educational standpoint. Use of control points, however, does little to enhance user-friendli-ness of digital photogrammetry for non-specialists.
One of the noteworthy features of the Australis bundle adjustment is that it supports both forward and reverse fold-in within the normal equation reduc-tion process. The forward fold-in describes the tradi-tional process by which parameters relating to object point coordinates are eliminated from the normal equations, thus leaving a reduced system comprising
Ž
only EO and camera calibration parameters e.g.,
.
Fig. 4. Illustration of network for multi-camera, image-sequence-based EO via a wand, as well as bundle adjustment dialog box.
both faster and arguably more straightforward to employ a reverse fold-in, whereby the camera station parameters are eliminated and the object point coor-dinate correction terms and self-calibration parame-ters are retained.
An analysis of the computational implications of forward and reverse fold-in is provided in
Edmund-Ž .
son and Fraser 1998 . Here, it is sufficient to give indicative figures for the performance of Australis. One iteration of a 50-image, 50-point self-calibrating bundle adjustment takes 58 s on a Pentium PC with a 120-MHz processor using forward fold-in of the normal equations, whereas reverse fold-in for one iteration of the same network takes only 32 s. A further benefit of reverse fold-in is that it offers a normal equation structure, which is much more
con-ducive to the imposition of geometric constraints between object points. These usually come in the form of redundant point-to-point distance informa-tion. Such constraints can provide the basis for multi-camera image-sequence based sensor calibra-tion and EO as is the case of building an object point-field through the use of a targeted wand
ŽCerveri et al., 1998; Maas, 1998 . Fig. 4 illustrates.
( ) C.S. Fraser, K.L. EdmundsonrISPRS Journal of Photogrammetry & Remote Sensing 55 2000 94–104
102
mensuration process is automatic, there is little cost associated with including additional data. In this case, the wand was moved in a continuous motion for 30 s.
Such features as described above are best hidden from the non-specialist user, who needs only a few indications that the bundle adjustment has been suc-cessful. Rather than needing to peruse the output files which detail adjustment results, it is invariably sufficient to refer only to a few one-number indica-tors of adjustment quality. The dialog box in Fig. 4 provides such indicators, specifically the Root Mean
Ž .
Square RMS value of image coordinate residuals, the number of rejected observations, the RMS value of coordinate standard errors and a status message stating that the adjustment was successful. In a self-calibration, the ‘ view camera data’ option can be
Ž .
selected to examine the derived updated camera calibration parameters, and the strength of the cali-bration can be gauged through a comparison of the variances arising from a Limiting Error Propagation
Ž
vs. those from the Total Error Propagation e.g.,
.
Fraser, 1996 .
Ž
Once the bundle adjustment or spatial
intersec-.
tion has been successfully processed, the network can be graphically displayed, which is a valuable visual aid. The integration of the graphics display with the bundle adjustment is also useful from an educational point of view. Since the images forming the network can be selectively enabled or disabled, it is a simple matter to examine the impact on network precision and self-calibration of interactively chang-ing the number of camera stations and therefore the network geometry.
If there is a drawback to the automatic adoption of free-network adjustment, it is that there is a certain arbitrariness about the final origin and
orien-Ž .
tation and possibly scale of the XYZ object point reference coordinate system. It is therefore often necessary, though not for sensor self-calibration, to transform the object point coordinates resulting from a bundle adjustment into a given datum, generally via 3D similarity transformation. This option is also integrated into Australis, with a closed-form solu-tion being employed to obtain preliminary values for the transformation parameters, thus again avoiding
the need for an operator to enter such ‘starting’ values.
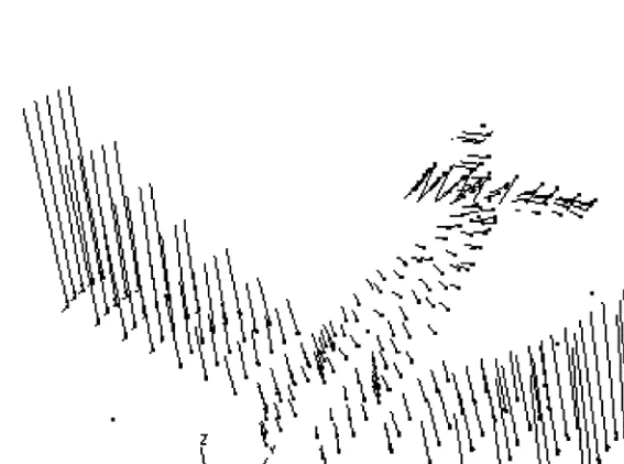
Whereas in a self-calibration adjustment, sensor calibration parameters might be viewed as a final outcome, albeit for the particular project at hand, triangulated XYZ object point coordinates invariably represent an intermediate result. Functions of these coordinates are typically of greater interest, for ex-ample parameters of shape, size, orientation, or change in shape or position in a multi-epoch survey. Thus, in a final processing step associated with photogrammetric data reduction, analysis tools are required to extract the spatial information of interest from the object space coordinates. Within Australis, such tools have been limited to a representative sample, mainly for educational purposes. Functions such as a best-fitting circle or plane can be applied to sub-sets of points highlighted in the Graphics View, as illustrated in Fig. 3. A further common post-processing tool is the use of the 3D similarity trans-formation for detrans-formation analysis, as illustrated in Fig. 5 which shows the object point displacements resulting from the imposition of static loads on a trainer aircraft. These results were obtained in multi-epoch photogrammetric surveys involving over 100 images and 400 targets.
3. Practical considerations
A photogrammetric survey such as that of the trainer aircraft remains a relatively complex opera-tion, requiring about 2 h per epoch to record the 100-image network and perform the image mensura-tion and bundle adjustment. The operamensura-tion, although arguably user-friendly and highly automated, never-theless requires a good deal of photogrammetric insight and experience. On the other hand, a straight-forward single-sensor survey with the prime purpose of providing a camera self-calibration needs no such experience and, so long as a few simple guidelines are adhered to, hardly constitutes an art.
To illustrate this, we give the example of the self-calibration of a Kodak DC 210 ‘amateur’ digital camera, using Australis, where the process proceeds as follows.
Ž .1 A series of, say, 50 targets is placed on a wall
covering the field of view of the camera, an area of
about 2=2 m being suitable in the case of the DC210. This array need only remain stable for as long as it takes to record the images and no prelimi-nary XYZ positional data is required.
Ž .2 An EO device is placed within the target field
such that it is imaged from all camera station posi-tions.
Ž .3 A convergent network of 6–10 images
incor-porating orthogonal roll angle diversity is then
Ž
recorded from a set-back distance of 3–4 m effec-tively infinity focus on the DC 210, which is zoomed to either its shortest or to its longest principal
dis-.
tance setting .
Ž .4 The images are imported into Australis, and the initial camera data comprising approximate focal length, array dimensions and pixel size are entered.
ŽRecall that it is not imperative that the pixel size be
.
exactly known.
Ž .5 All images are then measured as outlined
above, in what is a highly automated procedure consuming about 2 min. No inputting of additional information or starting values by the operator is required.
Ž .6 Finally, the self-calibrating bundle adjustment
is run for the default camera parameter set. Depend-ing on the anticipated use of this calibration
informa-Ž .
tion e.g., medium or low accuracy , the operator may choose to run the self-calibration with re-duced sets of additional parameters and evaluate the impact on final precision and accuracy.
This whole process takes only about 5–10 min from image recording to final results, and constitutes a user-friendly operation well suited to non-specialist application. A further practical example is given by the network indicated in Fig. 3, where 200 points on a car door are measured via Australis with a DCS 420 camera, the complete process again consuming about 10 min. Such automated operations are by no means unique to Australis and it is noteworthy that high-end, off-line vision metrology systems
employ-Ž
ing intelligent cameras, such as V-STARS Ganci
.
and Handley, 1998 exhibit performance, which well exceeds that just indicated.
One purpose of this paper has been to illustrate
Ž
that rather than always constituting an ‘art’ e.g.,
.
( ) C.S. Fraser, K.L. EdmundsonrISPRS Journal of Photogrammetry & Remote Sensing 55 2000 94–104
104
problem domain is well bounded. There is of course a quantum leap between what is achievable by non-specialist users of Australis and what is sought after in the realm of generating complete 3D object de-scriptions from general geometric and semantic knowledge about the scene. The computation process described in this paper, which is that embedded in
Australis, offers a complete solution in the former
case, whereas in the latter case it provides only a necessary interim step to achieving the desired out-come.
4. Concluding remarks
In describing the Australis software system for off-line digital close-range photogrammetry, the au-thors have aimed to demonstrate that with appropri-ate computational models and processes, and with
Ž
some modest operational requirements e.g., EO
de-.
vices , automated operations such as single- or multi-sensor, multi-station orientationrtriangulation, calibration and point-based 3D object measurement are not only feasible, but entirely achievable in a practical manner by non-specialist users of close-range photogrammetry. Moreover, a PC-based inter-active processing system exemplified by Australis, which has been developed primarily for use as an interactive educational tool, can greatly assist in the worthwhile endeavour of demystifying photogram-metric orientation and calibration processes, thus rendering them more suitable for broader applica-tions in associated fields such as computer vision.
References
Ariyawansa, D.D.A.P., Clarke, T.A., 1997. High speed correspon-dence for object recognition and tracking. In: Videometrics V, San Diego, USA, 30–31 July. Proc. SPIE 3174pp. 70–79. Beyer, H.A., 1995. Quality control in industry with digital
pho-Ž .
togrammetry. In: Gruen, A., Kahmen, H. Eds. , Optical 3-D Measurement Techniques III. Wichmann Verlag, Heidelberg, pp. 29–38.
Brown, D.C., 1976. The bundle adjustment — progress and prospects. Invited Paper, Commission III, Proc. of 13th ISP
Ž .
Congress, Helsinki, Finland. Int. Arch. Photogramm. 21, 3 33 pp.
Brown, J.D., Dold, J., 1995. V-STARS — a system for digital
Ž .
industrial photogrammetry. In: Gruen, A., Kahmen, H. Eds. , Optical 3-D Measurement Techniques III. Wichmann Verlag, Heidelberg, pp. 12–21.
Cerveri, P., Borghese, N.A., Pedotti, A., 1998. Complete calibra-tion of a stereo photogrammetric system through control points
Ž .
of unknown coordinates. J. Biomech. 31 10 , 935–940. Edmundson, K.L., Fraser, C.S., 1998. A practical evaluation of
sequential estimation for vision metrology. ISPRS J.
Pho-Ž .
togramm. Remote Sens. 53 5 , 272–285.
Eos Systems, 2000. PhotoModeler: photogrammetry measurement and 3D modeling software. http:rrwww.photomodeler.com, accessed March 12, 2000.
Foerstner, W., Guelch, E., 1999. Automatic orientation and recog-nition in highly structured scenes. ISPRS J. Photogramm.
Ž .
Remote Sens. 54 1 , 23–34.
Ž .
Fraser, C.S., 1996. Network design. In: Atkinson, K.B. Ed. , Close Range Photogrammetry and Machine Vision. Whittles, Scotland, pp. 256–282.
Fraser, C.S., 1997. Digital camera self-calibration. ISPRS J.
Pho-Ž .
togramm. Remote Sens. 52 4 , 149–159.
Fraser, C.S., 1998. Some thoughts on the emergence of digital
Ž .
close-range photogrammetry. Photogramm. Rec. 16 91 , 37– 50.
Fraser, C.S., Shao, J., 1997. An image mensuration strategy for
Ž .
automated vision metrology. In: Gruen, A., Kahmen, H. Eds. , Optical 3D Measurement Techniques IV. Wichmann Verlag, Heidelberg, pp. 187–197.
Furnee, E.H., Jobbagy, A., Sabel, J.C., van Veenendaal, H., Martin, F., Andriessen, D., 1997. Marker-referred movement measurement with grey-scale coordinate extraction for high-resolution real-time 3D at 100 Hz. Proc. SPIE 3173, 357–369. Ganci, G., Handley, H.B., 1998. Automation in videogrammetry.
Ž .
Int. Arch. Photogramm. Remote Sens. 32 5 , 53–58. Maas, H.-G., 1992. Complexity analysis for determination of
image correspondences in dense spatial target fields. Int. Arch.
Ž .
Photogramm. Remote Sens. 29 B5 , 102–107.
Maas, H.-G., 1998. Image sequence based automatic multi-camera system calibration techniques. Int. Arch. Photogramm. Remote
Ž .
Sens. 32 5 , 763–768.
Mason, S., 1994. Expert system based design of photogrammetric networks. PhD dissertation Institute of Geodesy and Pho-togrammetry. ETH Zurich, Mitteilungen No. 53, 187 pp. ShapeQuest Inc., 2000. ShapeCapture Version 2.1 - The most