An Alternative to Optimize
the Indonesian’s Airport Network Design:
An Application of Minimum Spanning Tree (MST) Technique*
Luluk Lusiantoro
Faculty of Economics and Business, Universitas Gadjah Mada, Yogyakarta, Indonesia
Wakhid Slamet Ciptono
Faculty of Economics and Business, Universitas Gadjah Mada, Yogyakarta, Indonesia
Gadjah Mada International Journal of Business
Vol. 14, No. 3 (September - December 2012): 267 - 302
Corresponding authors. E-mail: [email protected]; and [email protected]
Abstract: Using minimum spanning tree technique (MST), this exploratory research was done to
opti-mize the interrelation and hierarchical network design of Indonesian’s airports. This research also identi-fies the position of the Indonesian’s airports regionally based on the ASEAN Open Sky Policy 2015. The secondary data containing distance between airports (both in Indonesia and in ASEAN), flight frequency, and correlation of Gross Domestic Regional Product (GDRP) for each region in Indonesia are used as inputs to form MST networks. The result analysis is done by comparing the MST networks with the existing network in Indonesia. This research found that the existing airport network in Indonesia does not depict the optimal network connecting all airports with the shortest distance and maximizing the correla-tion of regional economic potential in the country. This research then suggests the optimal networks and identifies the airports and regions as hubs and spokes formed by the networks. Lastly, this research indicates that the Indonesian airports have no strategic position in the ASEAN Open Sky network, but they have an opportunity to get strategic positions if 33 airports in 33 regions in Indonesia are included in the network.
Abstrak: Dengan menggunakan teknik minimum spanning tree (MST), penelitian eksploratori ini dilakukan
dengan tujuan mengoptimalkan rancangan jaringan interrelasi dan hierarki bandar udara di Indonesia. Penelitian ini juga mengidentifikasi posisi bandar udara-bandar udara di Indonesia dalam kancah regional berdasarkan kebijakan ASEAN Open Sky 2015. Data sekunder berupa jarak antar bandar udara (baik di Indonesia maupun di ASEAN), frekuensi penerbangan, dan korelasi PDRB setiap provinsi di Indonesia digunakan sebagai masukan untuk membentuk jaringan MST. Analisis hasil dilakukan dengan membandingkan bentuk jaringan MST dengan jaringan bandar udara yang selama ini digunakan di Indo-nesia. Hasil penelitian ini menunjukkan bahwa jaringan bandar udara yang selama ini digunakan di
sia belum menggambarkan jaringan yang optimal yang mampu menghubungkan semua bandar udara dengan total jarak terpendek serta memaksimalkan keterkaitan potensi ekonomi setiap provinsi di Indo-nesia. Penelitian ini kemudian mengusulkan rancangan jaringan yang optimal serta mengidentifikasi bandar udara-bandar udara dan provinsi-provinsi yang menjadi hubs dan spokes dalam jaringan tersebut. Terakhir, hasil penelitian ini menunjukkan bahwa bandar udara-bandar udara di Indonesia kurang mempunyai posisi yang strategis dalam jaringan ASEAN Open Sky, namun berpeluang untuk mendapatkan tempat yang strategis jika 33 bandar udara di 33 provinsi di Indonesia dimasukkan ke dalam jaringan tersebut.
Introduction
An airport, as stated in the Decree of Minister of Communications Number KM.11 of 2010 on Order of National Airport Af-fairs, plays a very critical role as a hub for the network of air transportation. It also becomes a gate for any economic activities, a tranship-ment point, a support for industries, trading and/or tourism activities, a gateway to open up isolated areas, borderland development, disaster management, and infrastructure for strengthening the archipelago as well as the state sovereignty.
In order to achieve the optimal role, the airports should be connected to each other and form an interrelation network with the hierarchical role, whether as hubs or spokes. This interrelation will be able, not only to accomodate growing demand for flights, but also to maximize the correlation of economic potential of each region in Indonesia. More-over, the strong interrelation among regions will become a competitive advantage when facing a connectivity issue at regional and international level. This is true because the issue of connectivity1 development has
be-come an agreement at various upper-level summits such as ASEAN, ASEAN Plus, or East Asia Summit (President of Indonesia Republic 2012). Thus, consolidation and de-velopment of the airports in Indonesia must be well prepared as a part of the long-term competitive strategy that will need major in-vestment.
Responding to the more competitive market of the airline industry in Indonesia, the airline companies should be able to
opti-mize their operations activities without sac-rificing the criteria of the interrelation and hierarchy among the airports in the country. This can be achieved by optimizing the net-work design of Indonesian’s airports, where the optimal network should not only be seen from the aspect of flight demand, but should also be seen from the total distance to con-nect all the airports and the correlation of economic potential of each region in Indo-nesia.
Furthermore, the network design opti-mization is very important to be considered in facing the flight liberalization under the policy of ASEAN Open Sky 2015. This policy will allow four cities in Indonesia – Jakarta (JKT), Surabaya (SUB), Denpasar (DPS), and Medan (MED) to be involved in it.2 Hence, certain strategies related to the
network design optimization must be consid-ered carefully by the airline industry in Indo-nesia to compete with other airline industries from the other ASEAN countries.
In the near future, Indonesia is also fac-ing the challenge of ASEAN Economic Com-munity 2015 which makes the economy in the ASEAN area more integrated. Accord-ingly, the competitive level of a country or a region will significantly determine the level of the economic benefit to be obtained. This then indicates that the higher the competi-tive level of a country, the more the economic benefit will be obtained. Therefore, optimi-zation of the interrelation and hierarchical network design in Indonesia’s airports comes to be a way to improve the competitive level both in domestic areas and ASEAN areas.
1 Connectivity means an interrelation both among regions and among states in a region. This could be in the
form of transportation (land, sea, and air), telecommunication, trade, tourism, and mutual investment.
Considering all the matters mentioned above, it might be interesting to investigate whether or not the existing airport network in Indonesia has shown an optimal network connecting all airports in the country with the shortest total length and with the maximum correlation of economic potentials of each province in Indonesia. Moreover, it is impor-tant to identify the impact of the ASEAN Open Sky policy and the position of Indone-sia in the network.
Research Objective
Using the minimum spanning tree (MST) technique, this research is performed purposively to (1) design and (2) analyze the interrelation and hierarchical network that optimally connect all the airports in Indone-sia based on flight demands, distance be-tween airports, and the correlation of the lo-cal economic potential represented by the correlation of GDRP in each region in Indo-nesia. In this research, the MST technique is also used to (3) identify the impact of the ASEAN Open Sky policy on the interrela-tion and hierarchical network based on the distance between the airports in ASEAN and the position of Indonesia in this network.
Literature Review
Optimization (the best achievement) refers to a criterion in selecting an alterna-tive in an economy that consists of minimi-zation and maximiminimi-zation (Chiang and Wainright 2005). Minimization could be re-ferred to as efficiency – a number of inputs used to gain a number of certain outputs (Hill and Jones 2010). Maximization, on the other hand, is called effectiveness – a number of outputs produced by using a number of cer-tain inputs. The concept of transport eco-nomics dictates that economic efficiency
could be achieved when the producers are able to use the available resources using the best method (Boyer 1998). Furthermore, Cooley (1946) stated that transportation com-panies without any efficient management might survive only for certain periods due to their position, financial resources, govern-ment support, or right protection. However, the lack of efficiency, sooner or later, will lead to companies being eliminated. Hence, opti-mization is becoming necessary – one way is by using the transportation network which has been proposed by Russel and Taylor (2006), Render et al. (2006), and Chopra and Meindl (2010).
In the world of aviation, the network, in accordance with the Article 1 sentence 21 of Regulation of Indonesia Republic Num-ber 1 Year 2009 about aviation, refers to sev-eral routes of flight that are integrated to be an air transport service. This network will form an interrelation of airports, each of which will have a role in a hierarchy as stated in the Regulation of Minister of Communi-cation Number: KM 11 Year 2010 about the Order of National Airport Affairs. That regu-lation also stated about the importance of the use of economic potential in consideration of efficiency and effectiveness in the national airport planning system.
regions will be. This is in line with the re-search of Miskiewicz and Ausloos (2006) in a global scope correlating the Gross Domes-tic Product in Top 19 countries in the period of 1953-2003 in which they used the Mini-mum Length Path (MLP) technique to mea-sure the strongest connectivity between a country and all Top 19 countries in the net-work.
Not much different, both Minimum Spanning Tree (MST) technique and Minimum Length Path (MLP) technique attempt to optimize the weight to connect all nodes in a network. However, MST sees optimization by assessing the total weight in connecting all nodes in a network. Theoretically, this tech-nique is explained by Render et al. (2012), Jayawant and Glavin (2009), Wiliams (2003), Sedgewick and Wayne (2007), and Sedgewick and Wayne (2011).
Meanwhile, the connectivity issue is critical to be considered both locally and re-gionally. The local connectivity should be built properly before connecting Indonesia region-ally with the countries in Southeast Asia, East Asia, or event Asia Pacific (President of In-donesia Republic 2012). This local connec-tivity will alleviate the economic transactions and resources movement from one region to another in a more effective and efficient way. Besides that, regionally, this connectivity will support the realisation of the ASEAN com-munity and economic integration in the near future. This connectivity is expected to re-duce business transaction cost, time and travel cost, and to connect the “core” and “periphery” in ASEAN (ASEAN Studies Centre 2011).
Furthermore, the connectivity through air is the most developed in the ASEAN coun-tries (ASEAN Studies Centre 2011). Under
ASEAN Open Sky Policy 2015, Forsyth et al. (2004) explain that the airline companies should enhance their productivity by reduc-ing costs to gain more profits when compet-ing with other airline companies in ASEAN. This can be done by optimizing the airport’s network design in ASEAN. Accordingly, us-ing MST, this research will make significant impacts not only by connecting Indonesian’s airports, but also by connecting ASEAN’s airports effectively and efficiently.
Research Methods
This research used an exploratory re-search design supported by a secondary data analysis. It was conducted when the research-ers did not know much about the situation or information related to the issue that has been previously addressed in a similar piece of re-search (Sekaran and Bougie 2010). It is ex-pected from this exploratory research that there will be further research, possibly pro-viding conclusive evidence (Zikmund 2003). One of the techniques that can be applied in an exploratory research according to Cooper and Schindler (2011) is the secondary data analysis. Through this technique, the re-searchers are allowed to manage and analyze the secondary data from various relevant sources related to the topic of the research.
Procedure in Collecting Data
airlines providing a service for the scheduled domestic routes in Indonesia.3 The
research-ers, at this point, have assumed those seven airlines as the representatives for the domes-tic flight in Indonesia both in terms of flight frequency and flight scope. To simplify the data collecting process, the researchers used the web site tiketdomestik.com that has provided the flight schedules of 4 out of 7 airlines.4
The second data in this research were the values of the latitude and longitude of 33 airports in Indonesia as well as the radius earth obtained from the application of google map. Those three data were used to deter-mine the distance between an airport and the others in a network. The researchers has lim-ited the number of the airports to 33, each of which represented one province in Indo-nesia. The selection of those 33 airports was based on the hierarchy of the airports in which the 33 selected airports were the hubs either in primary, secondary, or tertiary level. Those airports include Sultan Iskandar Muda (BTJ), Polonia (MES), Minangkabau (PDG), Sultan Syarif Kasim II (PKU), Sultan Thaha (DJB), S.M. Badaruddin II (PLM), Fatmawati Soekarno (BKS), Radin Inten II (TKG), Depati Amir (PGK), Hang Nadim (BTH), Halim Perdanakusuma (HLP), Husein Sastranegara (BDO), Adi Sumarmo (SOC), Adi Sutjipto (JOG), Juanda (SUB), Soekarno Hatta (CGK), Ngurah Rai (DPS), Supadio (PNK), Tjilik Riwut (PKY), Syamsuddin Noor (BDJ), Sepinggan (BPN), Sam Ratulangi (MDC), Mutiara (PLW), Sultan
Hasanuddin (UPG), Wolter Monginsidi (KDI), Djalaluddin (GTO), Tampa Padang (MJU), Lombok Baru (LOP), Eltari (KOE), Pattimura (AMQ), Sultan Babullah (TTE), Rendani (MKW), and Sentani (DJJ).
In addition, the data of latitude and lon-gitude of 24 airports in 24 cities in ASEAN were needed to determine the distance be-tween one airport and the others as the main points in ASEAN which is mentioned in the research of Forsyth et al. (2004). To measure the distance between the airports, either in Indonesia or in ASEAN, the researchers have applied the great circle distance, which car-tographically and mathematically refers to the shortest path that can be flown through be-tween two points in the earth surface assumed to be a totally round in shape (Pearson 2012).5
The third data, in turn, were the values of GDRP in each province in Indonesia. Those were the annual data from 2004 to 2010 obtained from the Central Bureau of Statistics (BPS) in Indonesia. The data were used to identify the values of correlation co-efficient of GDRP in each province that, af-terward, were turned into pseudo distance using the MST technique.
Data Processing
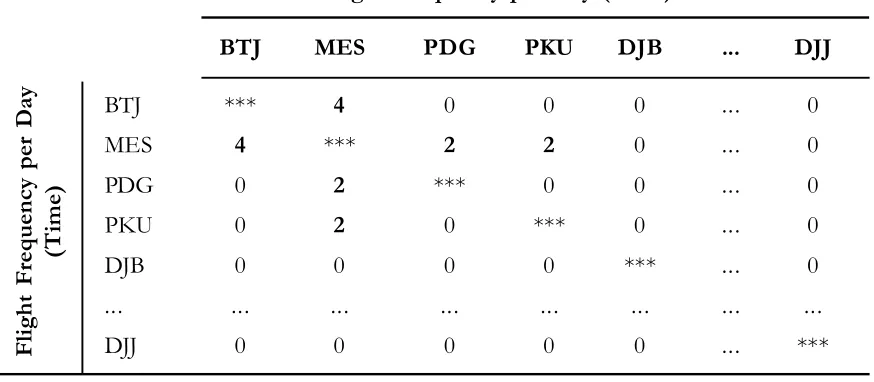
The first data processing was done by in-putting the collected data in a 33 x 33 matrix showing the daily flight frequency from one airport to the other airports in 33 provinces in Indonesia (see Table 1). To illustrate, it was
3 The seven airlines along with the flight code include Garuda Indonesia (GA), Lion Air (JT), Sriwijaya Air (SJ),
Batavia Air (Y6), Air Asia (QZ), Merpati Nusantara (MZ), and Citilink (G1).
4 Information system in the website has been integrated with the information system of airlines: GA, JT, SJ, and
Y6.
5 The measurement of distance among airports using this technique was also used in http://
recorded that there were four flights from Sultan Iskandar Muda Airport (BTJ) with the destination of Polonia Airport (MES) or vice versa in one day. The process of inputting the data into the matrix was then repeated for the other airports until Sentani Airport (DJJ). The flight frequency data that have been inputted into the matrix were then used as the input to form the interrelation and hi-erarchical network used by the airlines as well as the MST network based on the flight fre-quency in Indonesia.
The second data processing was performed by inputting the data of latitude, longitude, and radius earth6 into Microsoft Excel
for-mula to obtain the great circle distance be-tween one airport and the other airports in Indonesia. The formula of great circle dis-tance referred to the following one provided by Pearson (2012):
dxy = E*((2*ASIN(SQRT((SIN((RADIANS (Lax)RADIANS(Lay))/2)^2) +
COS(RADIANS(Lax))* COS(RADIANS (Lay))* (SIN((RADIANS(Lox) – RADIANS(Loy))/2)^2)))))
where,
dxy = distance between airport x and airport y
RE = radius earth
Lax = latitude value of airport x Lay = latitude value of airport y Lox = longitude value of airport x Loy = longitude value of airport y
Table 1. Matrix of Flight Frequency
Flight Frequency per Day (Time)
BTJ MES PDG PKU DJB ... DJJ
BTJ *** 4 0 0 0 ... 0
MES 4 *** 2 2 0 ... 0
PDG 0 2 *** 0 0 ... 0
PKU 0 2 0 *** 0 ... 0
DJB 0 0 0 0 *** ... 0
... ... ... ... ... ... ... ...
DJJ 0 0 0 0 0 ... ***
Fl
ig
ht
F
re
qu
en
cy
p
er
D
ay
(T
im
e)
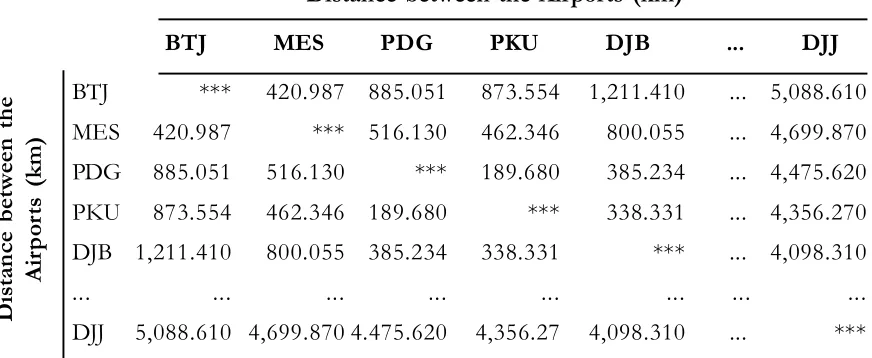
The distances obtained through the for-mula were then used as the input in order to form a distance matrix covering the airports in 33 provinces in Indonesia as presented in Table 2. The matrix shows a symmetric dis-tance between one airport and the other air-ports in which, for instance, the distance be-tween Sultan Iskandar Muda Airport (BTJ) and Polonia Airport (MES) and vice versa was 420.987 km. Meanwhile, the distance be-tween Polonia Airport (MES) and Minangkabau Airport (PDG) and vice versa was 516.130 km. The process of inputting the distance into the matrix was repeated for the other airports until Bandar Udara Sentani Airport (DJJ). The data were then to be the input in forming the MST network based on the distance between the Indonesian’s air-ports. In doing this, the researcher used Op-eration Research Models and Methods
(ORMM), software developed by Jensen (2004). ORMM comprises add-in combinato-ric.xla and optimize.xla that are used to run algorithm in Microsoft Excel. The software alleviated the process of forming MST net-work by providing the most efficient way to connect all airports in the network.
A similar method was also applied to the matrix of the distance for the airports in ASEAN as presented in Table 3. The matrix also shows the symmetric distance between one airport and the other airports in 24 cities in ASEAN.7 To illustrate, the distance
be-tween Kinabalu City Airport (BKI) and Suvarna Bhumi Airport (BKK) and vice versa was 1,883.900 km. Meanwhile, the distance between Suvarna Bhumi Airport (BKK) and Brunei Airport (BWN) and vice versa was 1,832.850 km. The process of inputting the distance into the matrix was repeated for the
7 24 cities along with the flight codes: Kinabalu (BKI), Bangkok (BKK), Bandar Seri Begawan (BWN), Cebu
(CEB), Chiang Mai (CNX), Davao (DAV), Denpasar (DPS), Hanoi (HAN), Phuket (HKT), Jakarta (JKT), Kuching (KCH), Kuala Lumpur (KUL), Luang Prabang (LPQ), Mandalay (MDL), Medan (MED), Manila (MNL), Penang (PEN), Phnom Penh (PNH), Siem Reap (REP), Yangon (RGN), Ho Chi Min City (SGN), Singapore (SIN), Surabaya (SUB), and Vientiane (VTE).
Table 2. Matrix Distance between the Airports in Indonesia
Distance between the Airports (km)
BTJ MES PDG PKU DJB ... DJJ
BTJ *** 420.987 885.051 873.554 1,211.410 ... 5,088.610 MES 420.987 *** 516.130 462.346 800.055 ... 4,699.870 PDG 885.051 516.130 *** 189.680 385.234 ... 4,475.620 PKU 873.554 462.346 189.680 *** 338.331 ... 4,356.270 DJB 1,211.410 800.055 385.234 338.331 *** ... 4,098.310
... ... ... ... ... ... ... ...
DJJ 5,088.610 4,699.870 4.475.620 4,356.27 4,098.310 ... ***
other airports until Wattay Airport (VTE). The data were then used as an input to form the network of MST based on the distance between the airports in ASEAN.
The third data processing was con-ducted by inputting the data of correlation
coefficient of GDRP between one province and the other provinces into the 33x33 cor-relation matrix. The corcor-relation among GDRPs was measured using the correlation coefficient formula of Pearson’s r as follows:8
8 See Lind (2008). Furthermore, to simplify the measurement of correlation between GDRP, the researchers used
the formula of correlation (Correl) in Microsoft Excel.
9 Each province in Indonesia was represented by the airport code embedded inside. For instance, BTJ represents
the Province of Nangroe Aceh Darussalam, MES representing North Sumatra Province, and so on until DJJ represent-ing Papua Province.
Table 3. Matrix of the Distance between the Airports in ASEAN Distance between the Airports (km)
BKI BKK BWN CEB CNX ... VTE
BKI *** 1,883.900 166.320 992.609 2,337.290 ... 1,984.130 BKK 1,883.900 *** 1,832.850 2,544.840 595.523 ... 514.971 BWN 166.320 1,832.850 *** 1,156.100 2,315.460 ... 1,976.400 CEB 992.609 2,544.840 1,156.100 *** 2,839.890 ... 2,450.630 CNX 2,337.290 595.523 2,315.460 2,839.890 *** ... 390.077
... ... ... ... ... ... ... ...
VTE 1,984.130 514.971 1,976.400 2,450.630 390.077 ... ***
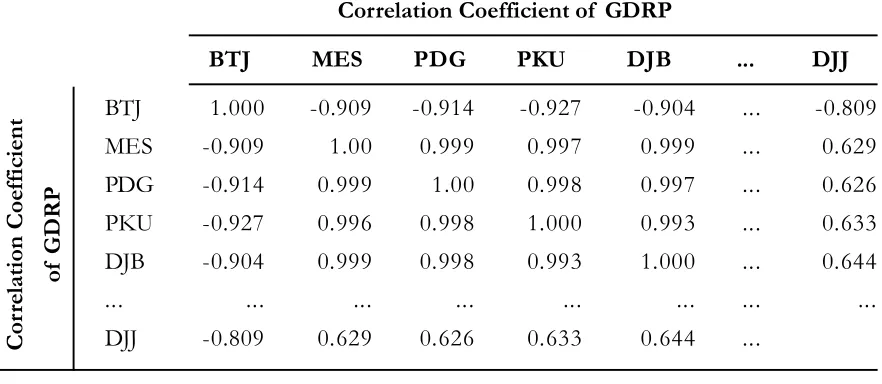
Table 4. Matrix of Correlation of GDRP among Provinces in Indonesia9
Correlation Coefficient of GDRP
BTJ MES PDG PKU DJB ... DJJ
BTJ 1.000 -0.909 -0.914 -0.927 -0.904 ... -0.809
MES -0.909 1.00 0.999 0.997 0.999 ... 0.629
PDG -0.914 0.999 1.00 0.998 0.997 ... 0.626
PKU -0.927 0.996 0.998 1.000 0.993 ... 0.633
DJB -0.904 0.999 0.998 0.993 1.000 ... 0.644
... ... ... ... ... ... ... ...
DJJ -0.809 0.629 0.626 0.633 0.644 ...
The correlation coefficient indicates the relationship strength and direction of the GDRP of one province and the other prov-inces. It also indicates the correlation in eco-nomic potentials of those provinces. If xy, thus -1 < rxy < 1, while, if x = y, thus rxy = 1. Table 4 depicts the example of correlation matrix of GDRP among provinces in Indo-nesia.
As seen in the Table 4, the correlation coefficient of GDRP of Nangroe Aceh Darussalam Province and GDRP of North Sumatra Province (-0.9092) showed a strong relationship in an opposite direction (nega-tive) between those two provinces. Mean-while, the correlation coefficient of GDRP of North Sumatra Province and that of West Sumatra Province (0.9997) indicated a strong relationship in the same direction (positive) between them. However, it is found that the relationship between GDRP of Nangroe Aceh Darussalam Province and GDRP of North Sumatra Province was weaker than the relationship between GDRP of North Sumatra and West Sumatra. In turn, this ma-trix was subsequently read equally until Papua Province.
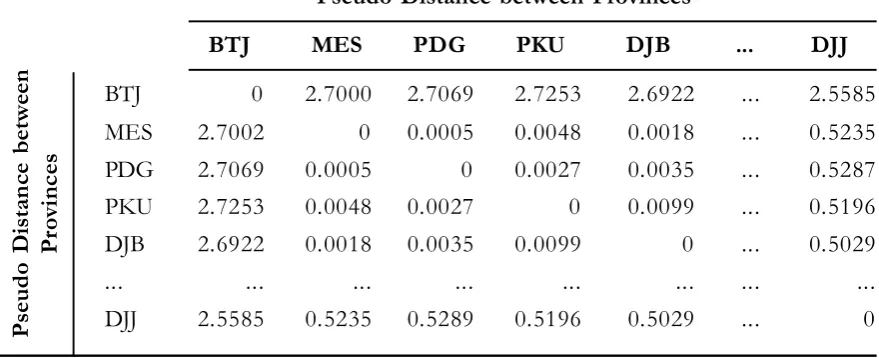
Once the correlation matrix was formed, the data processing was conducted by changing the correlation coefficient of GDRP among provinces into the following pseudo distance10 or ultrametricity distance:
where,
dt,xy= pseudo distance between GDRP of Provinsi x and GDRP of Province y
rxy = correlation coefficient of GDRP of Province x and GDRP of Province y
Pseudo distance is a distance represent-ing the value of GDRP correlation used to form MST network. Using the formula of the pseudo distance, if x = y, thus dt,xy = 0. Mean-while, if xy, thus dt,xy > 0. In that formula,
dt,xy = dt,yxwas valid. Thus, the stronger and more positive the correlation of GDRP of those two provinces, the closer their pseudo distance and the more they have to be con-nected direcly in the MST network. Accord-ingly, to be optimal, the network should con-nect all the provinces while minimizing the total pseudo distance between them. The calculated pseudo distance between prov-inces subsequently was used to be the input to make a matrix as presented in the follow-ing Table 5.
The Table 5 shows that the pseudo dis-tance between Nangroe Aceh Darussalam Province (BTJ) and North Sumatra Province (MES) was 2.7000 given the correlation coeeficient of -0.9092. Meanwhile, the pseudo distance between North Sumatra Province (MES) and North Sumatra Province (PDG) was 0.00046 given the correlation co-efficient of 0.99967. This was equally con-tinued until the value of the pseudo distance between one province and the others in In-donesia was found.
rxy = (x - x)(y - y) (n - 1)sxsy
dt,xy = 2(rxy - 1)2
Minimum Spanning Tree (MST)
Technique
Figure 1 illustrates the application of MST as provided by Sedgewick and Wayne (2007). In this figure, 8 vertices/nodes were given with a variety of cost weights in each arch or edge connecting them. MST, in turn, connected all of those nodes with the lowest total cost. The result of MST is represented in the bold black lines. The most efficient
to-tal cost (50) was obtained by summing the cost weights of the MST line.
MST technique is categorized into the symmetric graph theory or commonly called undirected graph in which a weight from the original node to the destination node is equal to a weight from the destination node to the original one. As an illustration, if there are two nodes (i and j) separated by the distance
d, the distance from node i to node j (dij) is Table 4. Matrix Correlation of GDRP among Provinces in Indonesia9
Pseudo Distance between Provinces
BTJ MES PDG PKU DJB ... DJJ
BTJ 0 2.7000 2.7069 2.7253 2.6922 ... 2.5585
MES 2.7002 0 0.0005 0.0048 0.0018 ... 0.5235
PDG 2.7069 0.0005 0 0.0027 0.0035 ... 0.5287
PKU 2.7253 0.0048 0.0027 0 0.0099 ... 0.5196
DJB 2.6922 0.0018 0.0035 0.0099 0 ... 0.5029
... ... ... ... ... ... ... ...
DJJ 2.5585 0.5235 0.5289 0.5196 0.5029 ... 0
Ps
eu
do
D
is
tan
ce
b
et
w
ee
n
Pr
ov
in
ce
s
24 4
6 16
8
10 5
23
18 11
14
21
7 9
Source: Sedgewick dan Wayne (2007)
equal to the distance from node j to the node
i (dji). In the terminology of minimum span-ning tree,11 an undirected graph (G) comprises
a group of vertices that is notated with V(G), and a group of vertices connected by edges is notated with E(G). Each node connected
to other nodes in G is called connected graph12. A graph with the real number
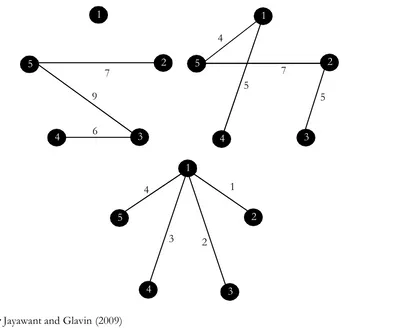
(com-monly positive) as a weight in each edge, meanwhile, is called the weighted graph. The sample of a connected graph with certain weights is presented in the Figure 2.
Source: Jayawant and Glavin (2009)
Figure 2. A connected, Weighted Graph
1
2
3 4
5
1
2 3
4
5 6
7
8 9 10
In the graph the vertices are represented by five nodes connected by the edges that, in this case, are presented by the lines connect-ing each node. The numbers in the lines show the weight of each line connecting two nodes. The weight can be in the form of distance, cost, or others. Also, the graph illustrates the great number of cycles of the lines that con-nect the nodes inside them as an order of the lines (1,3), (3,4), (4,5), and (5,1) that form one cycle.
Jayawant and Glavin (2009), addition-ally, illustrate the definition of minimum spanning tree in the graph theory into three: tree, spanning tree, and minimum spanning tree as shown in the Figure 3.
In graph G, a tree refers to a connected graph and does not form a cycle. However, the tree does not connect all vertices in this graph either. It is different from the spanning tree in which all verticesin graph G are con-nected by edgeswith the total weight of 19.
Finally, minimum spanning tree(notated with T) connects all vertices in graph G with a minimum total weight of 10.
In general, there are two algorithms used to form the MST network, namely Prim algorithm and Kruskal algorithm. Those two algorithms, subsequently, will result in an equal network of MST. In this research, Prim algorithm (greedy algorithm) was used through the following phases (Sedgewick and Wayne 2011):
Figure 3. In a clockwise manner from the left above, a tree in G, a Spanning Tree in G, a Minimum Spanning Tree G
Source: Jayawant and Glavin (2009)
1 1
2
3 4
5
5 2
3 4
1
2
3 4
5
1
2 3 4
5 5
7 4
7
9
1. Selecting the nodes in the network ran-domly.
2. Adding the lines connecting the nodes to other lines that have the lowest weight. 3. Repeating the second phase in order to
connect the nodes that have been nected to other nodes that are not con-nected yet in the network by prioritizing the lower weights.
4. Repeating those phases until all nodes in the network are connected.
In addition, in order to alleviate the pro-cess of measuring and forming the network, the researchers used certain software includ-ing Microsoft Excel, Operation Research Models and Methods (ORMM),13 and PAJEK.14
Microsoft Excel and ORMM were used to de-termine the airports supposed to be con-nected in order to form the shortest network. PAJEK, meanwhile, was used to describe the network visually. The use of the software referred to the research of Setiawan (2011), that has used MST technique to examine the presence of stock market integration and has used the software to find the least total path distance that connects all the nodes repre-senting stock markets indexes.
Results and Discussion
Principally, the airports in Indonesia have been connected to each other as seen in Figure 4. The network of those airports was
obtained based on the presence of the com-mercial flight from one airport to the others and showed the network of the airports re-cently used by the airlines in Indonesia.
In that network all airports have been connected to each other – except HLP in which there was no commercial flight from and/or to that airport. In addition, there were three airports functioning as the main and the busiest hubs in the network, namely CGK with 29 spokes, SUB with 17 spokes, and UPG with 16 spokes.15 The total distance to
connect all airports using the network was 84,108.58km.
The MST Network Based on the
Flight Frequency
Based on the number of the flight fre-quencies per day, five airports with the big-gest flight services included CGK with 389 flights, SUB with 133 flights, UPG with 78 flights, DPS with 57 flights, and MES with 50 flights.16 If all airports were connected by
maximizing the flight frequencies from one airport to the other airports, the interrelation and hierarchical network would become a form as illustrated in Figure 5. There were two hubs in this network, namely CGK with 26 spokes and UPG with 3 spokes. The total distance to connect all airports with this net-work was 38,546.830 km, which was 54 per-cent shorter than the total distance to con-nect all airports in the network now used in Indonesia.
13 ORMM is a software developed by Jensen (2004). ORMM comprises add-in combinatoric.xla and optimize.xla
that are used to run greedy algorithm in Microsoft Excel.
14 PAJEK is software developed by Batajelj and Mrvar (2011) in describing certain network.
15 Basically, all airports not functioning as the hub refer to spoke. However, in this research, the number of spokes
was measured based on the absence or present of a direct flight from hub to other airports and vise versa provided by 7 major airlines. The number of the spokes in this research was used as one of indicators to find out the flight concentration directly connected to the hub.
16 The number of provided flights was measured based on the flight frequencies per day from 7 main airlines as
jah M
ada
Inte
rnat
iona
l Jou
rnal
of B
usin
ess
- Sep
tem
ber-D
ecem
ber, V
ol. 14
, N
o. 3, 2
012
BTJ
MES
PKU
BTH
DJB PDG
BKS PLM
TKG
CGK
HLP
BDG
PNK
JOG
SOC
SBY
DPS
LOP
KOE UPG BDJ
PKY KDI
AMD MJU
PLW BPN
GTO MDC TTE
MKW
Lus
ianto
ro
and
Cip
tono
Figure 5. The MST Network of All Airports in Indonesia by Maximizing the Flight Frequencies from One Airport to the Others
BTJ
MES
PKU
BTH
DJB PDG
BKS PLM
TKG
CGK
HLP
BDG
PNK
JOG
SOC
SBY
DPS
LOP
KOE UPG BDJ
PKY KDI
AMD MJU
PLW BPN
GTO MDC TTE
MKW
Figure 5 clearly shows that the domes-tic flights in Indonesia are now concentrated in one airport, namely CGK. With the big-gest number of flight frequencies, this airport could function as a distribution center (DC) for the other airports in Indonesia. The net-work with DC enables the airlines to consoli-date the passengers in CGK. Nevertheless, the network with only one DC will increase not only the complexity in coordination but also handling cost. Moreover, the most fre-quent occurrence in CGK in the air traffic density is the delay for take-off and landing. As a result, it becomes a great loss to the air-lines for providing more fuel and brings a detrimental effect on passengers regarding the time they have to spend in the plane. In addi-tion, as a DC, CGK must consider the pas-sengers and the planes capacity under its ser-vice that will require a great investment for building and expanding the airport.
The MST Network Based on the
Distance between Airports
Figure 6 shows the form of interrela-tion and hierarchical network of the airports in Indonesia based on the distance between airports. This figure depicts the shortest net-work of the airports as a result of MST
Lus
ianto
ro
and
Cip
tono
Figure 6. MST Network by Minimizing the Total Distance to Connect all Airports in Indonesia
BTJ
MES
PKU
BTH
DJB PDG
BKS PLM
TKG
CGK HLP
BDG
PNK
JOG
SOC
SBY
DPS
LOP
KOE UPG BDJ
PKY KDI
AMD MJU
PLW BPN
GTO MDC TTE
MKW PGK
jah M
ada
Inte
rnat
iona
l Jou
rnal
of B
usin
ess
- Sep
tem
ber-D
ecem
ber, V
ol. 14
, N
o. 3, 2
012
Figure 7. The MST Network of Airports in Indonesia by Minimizing the Total Distance and by Maximizing the Flight Frequency
BTJ
MES
PKU
BTH
DJB PDG
BKS PLM
TKG
CGK HLP
BDG
PNK
JOG
SOC
SBY
DPS LOP
UPG BDJ
PKY
KDI AMD
MJU PLW BPN
GTO MDC TTE
MKW PGK
The MST Network by Weighting
the Distance and Flight
Frequency
Figure 7 presents the interrelation and hierarchical network of airports in Indonesia with an equal weight in distance and flight frequency from one airport to the others (50%: 50%). Five airports that became the hub in that figure included CGK with 11 spokes, UPG with 9 spokes, SUB with 5 spokes, DPS with 3 spokes, and JOG with 3 spokes. Us-ing this network, the flight from JOG to DJJ, as an illustration, must first pass through CGK as the hub. On the other hand, the flight from SUB to DJJ must first pass through UPG as the hub. However, the flight from UPG to SUB must be made directly since there was no hub between these two airports. This was not only to minimize the total distance for connecting all airports but also to maximize the flight frequency from one airport to the other airports. The total distance to connect all airports using this network was 20,097.390 km. As a result, this airport network could result in 76 percent shorter than the total dis-tance to connect all airports using the exist-ing network in Indonesia.
In consideration of the flight frequency from one airport to the others, the form of this airport network was not equal to that of the airport as depicted in Figure 4. However, the main hub formed in this network has been suitable with the main hub in the existing network in Indonesia. In this network, CGK again came to be the hub with the highest number of spokes - followed by UPG and SUB, but the number of spokes to be served
were not as many as the spokes served by the airports in the network as in Figure 4.
The MST Network Based on the
Correlation of GDRP of each
Province in Indonesia
The interrelation and hierarchy of the airports as depicted in Figure 8 below refers to a network of the airports describing a maxi-mal correlation of the economic potential in each province in Indonesia. The form of the network in the figure was simply based on the GDRP correlation of each province with-out any consideration abwith-out the distance be-tween the airports and the flight frequency from one airport to the others. Two airports directly correlated by edge in this network showed that two provinces where those two airports exist had a strong and positive GDRP correlation. In other words, the stronger and more positive the correlation of GDRP be-tween two provinces, the airport located in those two provinces must be directly corre-lated.
jah M
ada
Inte
rnat
iona
l Jou
rnal
of B
usin
ess
- Sep
tem
ber-D
ecem
ber, V
ol. 14
, N
o. 3, 2
012
Figure 8.The MST Network of Airports by Maximizing the Economic Potential Based on the Total Correlation of GDRP in Each Province in Indonesia
PDG
PDG BDO
PLH PDG
HLP KDE
MES SUB
PKY SOC DPS BKS
BDJ PNK
PLW
KDI
AMD
GTO
JOG TKG
DJB
PGK
TTE MDC
UPG LOP
DJJ
MJU
MKW BPN
For another illustration, SOC that rep-resented Central Java Province was directly correlated to DPS representing Bali Province and PKY representing Central Kalimantan Province. This was due to the correlation of GDRP among Central Java Province and Bali Province (0.99995) and Central Kalimantan Province (0.99998) was stronger and more positive compared to the correlation between GDRP of Central Java Province and other provinces in Indonesia.
In addition, there were 8 airports in the network that functioned as the hub, namely DJB with 4 spokes, BDO with 3 spokes, HLP with 3 spokes, PKY with 3 spokes, PLW with 3 spokes, GTO with 3 spokes, DPS with 3 spokes, and MJU with 3 spokes. As an illus-tration of using this network, the flight from SUB to SOC must first pass through PKY as the hub. Meanwhile, the flight from PGK to TTE must be made directly considering that there was no any hub between those two air-ports. This was done to maximize the con-nectivity of economic develoment (GDRP correlation) as a base of the conectivity of all airports in this network. It is found that the total distance to connect all airports based on the economic potential of each province in this network was 36,098.440 km. It means that this network of the airports resulted in the total distance of 57 percent shorter that the total distance to connect all airports in the existing network in Indonesia.
In fact, by simply considering the total correlation of GDRP, it is found that the form of the network was different from the net-work now used in Indonesia. This netnet-work has a more widespread hub and if compared to the network as presented in Figure 4, it is
found that only DPS that still acted as one of the main hubs in this network. In addi-tion, CGK was no longer the hub with the most number of spokes but DJB that, in turn, led DJB to be the busiest hub in this network.
The MST Network with the
Weighting of the Distance, Flight
Frequency, and Pseudo Distance
jah M
ada
Inte
rnat
iona
l Jou
rnal
of B
usin
ess
- Sep
tem
ber-D
ecem
ber, V
ol. 14
, N
o. 3, 2
012
Figure 9. The MST Network of Indonesian’s Airports with the Weighting of the Distance (33,33%), Flight Frequency (33,33%), and Pseudo Distance (33,33%)
BTJ
MES
PKU
BTH
DJB PDG
BKS PLM
TKG
CGK HLP
BDG
PNK
JOG
SOC
SBY
DPS LOP
UPG BDJ
PKY
KDI AMD
MJU PLW BPN
GTO MDC TTE
PGK MKW
Lus
ianto
ro
and
Cip
tono
Figure 10. The MST Network of Indonesian’s Airports with the Weighting of the Distance (25%), Flight Frequency (25%), and Pseudo Distance (50%)
BTJ
MES
PKU
BTH
DJB PDG
BKS PLM
TKG
CGK HLP
BDG
PNK
JOG
SOC
SBY
DPS LOP
KOE UPG BDJ
PKY
KDI AMD
MJU PLW BPN
GTO MDC TTE
PGK MKW
Meanwhile, Figure 1 presents the net-work of the airport in Indonesia by provid-ing the weight to the distance between the airports (50%) greater than the weight for the flight frequency (25%) and pseudo distance (25%). In common, the form of this network is not far different from another form of the network as depicted in Figure 9. However, there were 6 airports in this network that function as the hub: CGK with 9 spokes, UPG with 7 spokes, SUB with 4 spokes, BTH with 4 spokes, JOG with 3 spokes, and DPS with 3 spokes.
To exemplify this, the flight from PKU to CGK, using this network, could not be made directly but must first pass through BTH as the hub. Meanwhile, the flight from BTH to PLM must be made directly without pass-ing through CGK that previously acts as the hub for those two airports (see Figure 9). The total distance to connect all the airports in the network was 15,541.700 km. This airport network resulted in the total distance of 82 percent - shorter than the total distance to connect all airports in the network now used in Indonesia.
Moreover, this network had the hub more widespread compared to the network as depicted in Figure 9. This form of the net-work was also different from the form of the existing network used in Indonesia. However, similar to the network as depicted in Figure 4, CGK in this network came to be the hub with the most number of spokes, followed by UPG and SUB. Nevertheless, the number of the spokes provided by CGK, UPG and SUB in this network was not as many as the
spokes provided in the network as in Figure 4 and Figure 9.
Furthermore, Figure 12 presents a net-work of Indonesia’s airports in which the flight frequency from one airport to other air-ports was provided with the larger weight (50%) compared to the weight for the dis-tance between the airports (25%) and pseudo distance (25%). In this network, there were three airports functioning as the hub, namely CGK with 15 spokes, UPG with 9 spokes, and SUB with 6 spokes. Through this net-work, the flight from CGK to SUB, for in-stance, must be made directly without pass-ing through JOG that previously acted as the hub for both two airports. While, the flight from JOG to SUB could not be made directly but must first pass through CGK as the hub. It, as a result, made the total distance to con-nect all airports in the network was 22,098.100 km. This airport network, in turn, resulted in a total distance of 74 percent shorter than the total distance to connect all airports in the network used in Indonesia re-cently.
Lus
ianto
ro
and
Cip
tono
Figure 11. The MST Network of Indonesian’s Airports with the Weighting of the Distance (50%), Flight Frequency (25%), and Pseudo Distance (25%)
BTJ
MES
PKU
BTH
DJB PDG
BKS PLM
TKG
CGK HLP
BDG
PNK
JOG
SOC
SBY
DPS LOP
KOE UPG BDJ
PKY
KDI
AMD MJU
PLW BPN
GTO MDC TTE
PGK
MKW
jah M
ada
Inte
rnat
iona
l Jou
rnal
of B
usin
ess
- Sep
tem
ber-D
ecem
ber, V
ol. 14
, N
o. 3, 2
012
Figure 12. The MST Network of Indonesia’s Airports by Providing Weight for Distance (25%), Flight Frequency (50%), and Pseudo Distance (25%)
BTJ
MES
PKU
BTH
DJB PDG
BKS PLM
TKG
CGK
HLP
BDG
PNK
SOC
SBY
DPS
UPG BDJ
PKY
KDI
AMD MJU
PLW BPN
GTO MDC TTE
MKW
The MST Network of Airports in
ASEAN
Given the policy of ASEAN Open Sky, four airports in four cities in Indonesia, namely Soekarno-Hatta Airport representing Jakarta (JKT), Juanda Airport representing Surabaya (SUB), Ngurah Rai Airport representing Denpasar (DPS), and Polonia Airport repre-senting Medan (MED) have been used as the main airports that provide a service for flights with a number of destinations in ASEAN countries. For this, the flights from Indonesia with city destinations in ASEAN and vice versa must pass through one of those four airports. In other words, those four airports have been the hubs for the airports in Indo-nesia that must be passed through as the gates for the destinations in ASEAN.
Figure 13 presents the interrelation and hierarchical network of the airports in ASEAN based on the distance between one airport and other airports. This network re-ferred to the network with the shortest total distance in connecting all airports in ASEAN (10,405.400 km). In this network, six airports acted as the hub; those are CNX with 3 spokes, LPQ with 3 spokes, BKK with 3 spokes, PEN with 3 spokes, SIN with 3 spokes, and CEB with 3 spokes.
In this network, four cities in Indone-sia, JKT, SUB, DPS, and MED, did not have any role as the hubs in ASEAN regions. In fact, those four airports were connected by SIN. It means that the flight from MED to
JKT, SUB and DPS, for instance, must first pass through SIN as the hub. Therefore, SIN became a strategic place to consolidate the passengers in those routes. Sub regionally, the airports in Indonesia, additionally, are closer to Singapore, Malaysia, Thailand, and Brunei Darussalam (SMTB + Indonesia). For this reason, by considering the shortest distance to connect all airports in ASEAN Open Sky, the sub regional classification by Forsyth et al. (2004), including Vietnam-Indonesia-Phil-ippine and Brunei (VIP+B) is not suitable with the result of this research.
Figure 13. The MST Network of Airports in the Policy of ASEAN Open Sky by Mini-mizing the Total Distance to Connect All Airports in ASEAN.
MDL
CNX
AGN
LFO
VTE HAN
BKK
REP
HKT
PEN
PNH
SGN
ME D KUL
SIN KCH
JKT SUB
DPS BWN
BKI
MNL
CEB
Lus
ianto
ro
and
Cip
tono
Figure 14. The MST Network of Airports in the Policy of ASEAN Open Sky by Minimizing the Total Distance to Connect All Airports in ASEAN
MDL
RGN
CNX HAN
LFO
VTE
BKK REP
PNH SGN
HKT
PEN
MED BTJ
KUL
RGN
RGN
SIN BTH
DJBPLM BKS
TKG PGK
PNK KCH
BWN BKI
JKT
HLP BDO
JOG
SOC
SUB
DPS
RGN
RGN PKY
BPN MJU
PLW UPG
KDI KOE GTO
MDC TTE
AMD MKW
DJJ
Conclusion and Managerial
Implications
By comparing the optimal network based on the MST technique with the net-work now used in Indonesia, the researchers, in turn, come to the conclusions consisting of several points. Firstly, the interrelation and hierarchical network of airports recently used in Indonesia does not completely reflect the airport network with the shortest total tance that could be obtained if only the dis-tance of the airports in Indonesia was con-sidered to form the network in which PLM, PKU, SUB, BDJ, and MJU had acted as the hubs. The network of the airports that has been formed, by considering the aspect of flight frequency from one airport to another and by providing the equal weight to distance, will produce the total distance of 76 percent shorter that the total distance to connect all airports in the existing network used in Indo-nesia. In this case, CGK, UPG, and SUB be-come the main hubs in this network. The equal result will be obtained if the aspect of GDRP correlation in each province in Indonesia is considered with the equal weight in the dis-tance and in flight frequency in which the network refers to the optimal network in this research.
Another point is that the interrelation and hierarchical network of the airports re-cently used in Indonesia has not maximally reflected the correlation of economic poten-tial of each province in Indonesia. If mixed with the aspect of the distance between ports and the flight frequency from one air-port to the others with an equal weight, the correlation of economic potential measured with the correlation of GDRP of each prov-ince in this research does not have a signifi-cant impact on the total distance and the form of the optimal airport network in Indonesia.
This might have happened because of the very small differences between GDRP corre-lations of provinces in Indonesia.
The third one, given the policy of ASEAN Open Sky, based on the distance between the airports, Indonesia still lacks a strategic role in the airport network in ASEAN. In the network involving 24 airports in ASEAN with the minimization of the to-tal distance to connect all airports, there is no airport in Indonesia acting as the hub. In fact, the airports in Indonesia are connected by airports of other countries in ASEAN. The efficient position of Indonesia in the network based on the distance is merely as the spoke. This leads to the limited scope of service of those four Indonesian’s airports in ASEAN. Moreover, the position of Indonesia is closer to Singapore, Malaysia, Thailand, and Brunei Darussalam instead of Vietnam and Philip-pine. Conversely, if 33 airports in 33 prov-inces in Indonesia are becoming part of the ASEAN Open Sky network, Indonesia will have a strategic role as having hubs that con-nect Indonesia to Singapore, Malaysia, Thai-land, Brunei Darussalam, and Philippine.
should be focused on CGK and UPG since those two airports are the hubs with the wid-est service scope. It is important to antici-pate the growing demand in the airline industry in the future.
Secondly, to connect all provinces in In-donesia and to maximize the correlation of economic potential of each province, the government should consider the aspect of distance between the airports and flight fre-quency in 33 provinces in Indonesia. Thirdly, in facing the ASEAN Open Sky policy, the airport managers should consider the four air-ports that are supposed to join the ASEAN Open Sky network (i.e. JKT, SUB, DPS, and MED). In addition, the managers should pre-pare the development of Sam Ratulangi Air-port (MDC) and S.M. Badaruddin II AirAir-port (PLM) to be the hubs if there is an opportu-nity for 33 airports in 33 provinces in Indo-nesia to join the ASEAN Open Sky network. Furthermore, to be efficient, the airlines in Indonesia should consider Changi Airport (SIN) and Penang Airport (PEN) as the hubs in consolidating the passengers from and to the countries in ASEAN regions. In turn, if 33 airports in 33 provinces in Indonesia have an opportunity to join the ASEAN Open Sky network in the future, the airlines in Indone-sia should consider Sam Ratulangi Airport (MDC) and S.M. Badaruddin II Airport (PLM) to be the hubs to consolidate the passengers.
Thirdly, the optimization of the airport network will be very important in the future. This research can be an alternative for air-lines to make decisions related to cost reduc-tion, route design, passenger consolidareduc-tion, and the like. Moreover, the optimal network will enhance economic transactions among connected regions so that this research can also be an alternative for the Indonesian Gov-ernment to make decisions related to what regions should be connected direcly and
in-directly according to their GDRP correlation and some regulations to be made in facing flight liberalization both locally and region-ally.
Furthermore, in the field of airport eco-nomics, airport systems and neworks can achieve economies of scale if they are man-aged carefully (ACI Policy and Recommended Practices Handbook 2009). The optimal net-work will enhance the value transfering pro-cess from one airport or region to the other airports or regions. Consequently, it will form a value network in which economic and other benefits are exchanged. The economic con-tribution and connectivity issue can lead this research to the issue of networked economy, which also includes information, communi-cation, and technology issues. This may be an interresting subject to be examined by fu-ture researchers concerning the network study, particularly using the MST as an Op-erations Research tool.
po-tential of each province in Indonesia. An-other limitation is that this research does not consider the goverment and airport operators
view points. Thus, further research regarding those things needs to be done to confirm the results of this research.
References
ACI Policy and Recommended Practices Handbook. 2009. Airport Economics. Downloaded from http:// w ww.a ci .a ero/a ci /a ci/ fi le/ACI% 20 Poli cy% 20 HB/2 00 9 /ACI_Pol i ci es _a nd _ Recommended_Practices_seventh_edition_1.pdf, November 29th, 2012.
Air Asia. 2012. www.airasia.com/id/id/home.page, downloaded on June 28th, 2012, at 18.00.
ASEAN Studies Centre. 2011. Enhancing ASEAN Connectivity, retrieved from http://asc.iseas.edu.sg/ about-us/home/item/4-enhancing-asean-connectivity, November 29th, 2012.
Central Bureau of Statistics (BPS). 2009. Produk Domestik Regional Bruto Provinsi-Provinsi di Indonesia Menurut Lapangan Usaha 2005-2009. Jakarta, Indonesia.
Batajelj, V., and A. Mrvar. 2011. Pajek 2.04, downloaded from http://pajek.imfm.si/, May 2012. Boyer, K. D. 1998. Principles of Transportation Economics. New York: Addison Wesley Longman, Inc. Chiang, A. C., and K. Wainwright. 2005. Fundamental Methods of Mathematical Economics (4th ed.). New York:
McGraw-Hill/Irwin.
Citilink. 2012. Rute dan Jadwal Penerbangan. In http://www.citilink.co.id/uploads/files/Time-table-20120622-2.jpg, downloaded on June 28th, 2012, at 19.39.
Cooley, H. B. 1946. Transportation Management. New York: Cornell Maritime Press.
Cooper, D. R., and P. S. Schindler. 2011. Business Research Methods (11th ed.). New York: McGraw-Hill/ Irwin.
Copra and Meindl. 2010. Supply Chain Management: Strategy, Planning and Operations (4rd ed.). New Jersey: Prentice Hall.
Forsyth, P., J. King, C. L. Rodolfo, and K. Trace. 2004. Preparing ASEAN for open sky. AADCP Regional Economic Policy Support Facility Research Project 02/008. Monash: Monash International Pty. Ltd. Gavish, B., and K. Altinkemer. 1988. Heuristics with constant error guarantees for the design of tree
networks. Management Science 34 (3) (March): 332.
Hill, C. W. L., and G. R. Jones. 2010. Theory of Strategic Management: With Cases (9th ed.). South-Western: Cengage Learning.
Jayawant, P. and K. Glavin. 2009. Minimum spanning tree. Involve: A Journal of Mathematics 2 (4).
Jensen, P. A. 2004. Operation research models and methods. In http://www.me.utexas.edu/~jensen/ORMM/ models/unit/combinatorics/tree.html.
Lind, D. A., W. G. Marchal, and S. A. Wathen. 2008. Statistical Techniques in Business and Economics withGlobal Data Sets (13th ed.). New York: McGraw-Hill/Irwin.
Minister of Communication of Indonesia Republic. 2010. Regulation of Minister of Communication Number: KM 11 Year 2010 on the Order of National Airport Affairs. Jakarta, Indonesia.
Merpati. 2012. Tiket promo, jadwal and tarif-Merpati Airlines, in http://www.merpati.co.id/, downloade on June 28th, 2012, at 18.00.
Miskiewicz, J., and M. Ausloos. 2006. An attempt to observe economy globalization: the cross correlation distance evolution of the top 19 GDP’s. International Journal of Modern Physics C 17 (3): 317-331. Pearson, C. 2012. Latitude, Longtitude, and Great Circles. Pearson Software Consulting, LLC, in http://
www.cpearson.com/excel/LatLong.aspx, accessed in June 22, 2012 at 10.24.
President of Indonesia Republic. 2012. Transkrip sambutan Presiden Republik Indonesia PeresmianPengembangan Bandara Soekarno-Hatta Cengkareng, Banten 2nd August 2012. In http://www.presidenri.go.id/ index.php/pidato/2012/08/02/1919.html, accessed in October 20, 2012.
President of Indonesia Republic. 2009. Undang-undang Republik Indonesia Nomor 1 Tahun 2009 tentang Penerbangan. Jakarta, Indonesia.
Render, B., R. M. Stair Jr., and M. E. Hanna. 2006. Quantitative Analysis for Management (9th ed.). New Jersey: Prentice Hall.
Russel, R. S., and B. W. Taylor III. 2006. Operation Management: Quality andCompetitiveness in a Alobal Environ-ment (5thed.). New Jersey: John Wiley and Sons, Inc.
SAIC. 2012. Flight Distance Calculator to Calculate Aviation Distance at Aeroplanner.com. In http:// www.aeroplanner.com/calculators/avcalcdist.cfm, May 2012.
Sedgewick, R., and K. Wayne. 2011. Algorithms (4th ed). in http://algs4.cs.princeton.edu/43mst/, May 2012.
Sedgewick, R., and K. Wayne. 2007. Minimum Spanning Tree. In http://www.cs.princeton.edu/courses/ archive/fall06/cos226/lectures/mst.pdf
Sekaran, U., and R. Bougie. 2010. Research Methods for Business: A Skill Building Approach (5th ed.). West Sussex: John Wiley & Sons Ltd.
Setiawan, K. 2011. On the dynamic of stock market integration: A minimum spanning tree analysis. The International Journal of Economic Policy Studies 6 (3).
Tiketdomestik.com. 2012. Portal Cari Harga dan Pesan Tiket Online Pesawat: GA JT SJ Y6. In http:// tiketdomestik.com/, May 2012.
Wiliams, J., C. 2003. Optimal direct and indiret covering trees. Annals of Operations Research (123): 265-284. Zikmund, W. G. 2003. Business Research Methods (7th ed.). Ohio: South-Western, Thomson Learning. http://asc.iseas.edu.sg/about-us/home/item/4-enhancing-asean-connectivity
h t t p : / / w w w . a c i . a e r o / a c i / a c i / f i l e / A C I % 2 0 P o l i c y % 2 0 H B / 2 0 0 9 / ACI_Policies_and_Recommended_Practices_seventh_edition_1.pdf
APPENDIXES
Appendix 1. List and Value of Latitude and Longtitude of Airports in Indonesia
Province Airport Code Latitude Longtitude
Aceh Sultan Iskandar Muda BTJ 5.518616 95.421729
North Sumatra Polonia MES 3.567766 98.676764
West Sumatra Minangkabau PDG -0.786064 100.286529
Riau Sultan Syarif Kasim II PKU 0.464749 101.446407
Jambi Sultan Thaha DJB -1.638542 103.645234
South Sumatra S.M. Badaruddin II PLM -2.900133 104.698629
Bengkulu Fatmawati Soekarno BKS -3.862199 102.337124
Lampung Radin Inten II (Branti) TKG -5.242333 105.177863 Bangka Belitung Islands Depati Amir PGK -2.162511 106.138058
Riau Islands Hang Nadim BTH 1.125704 104.111742
Special Capital District Jakarta Halim Perdanakusuma HLP -6.265518 106.892381
West Java Husein Sastranegara BDO -6.899757 107.577181
Central Java Adi Sumarmo SOC -7.515922 110.756929
Special District Yogyakarta Adi Sutjipto JOG -7.788150 110.431834
East Java Juanda SUB -7.380683 112.787704
Banten Soekamo-Hatta CGK -6.126218 106.657333
Bali Ngurah Rai DPS -8.656299 115.222104
West Kalimantan Supadio PNK -0.147784 109.403878
Central Kalimantan Tjilik Riwut PKY -2.226746 113.943965 South Kalimantan Syamsuddin Noor BDJ -3.442334 114.761188
East Kalimantan Sepinggan BPN -1.267444 116.893759
North Sulawesi Sam Ratulangi MDC 1.549248 124.926277
Central Sulawesi Mutiara PLW -0.918778 119.909456
South Sulawesi Sultan Hasanuddin UPG -5.061684 119.553952 South-East Sulawesi Wolter Monginsidi KDI -4.078166 122.416853
Gorontalo Djalaluddin GTO 0.638996 122.850718
West Sulawesi Tampa Padang MJU -2.683373 118.899693
West Nusa Tenggara Lombok Baru LOP -8.560652 116.086428
East Nusa Tenggara Eltari KOE -10.171407 123.670757
Maluku Pattimura AMQ -3.705043 128.088892
North Maluku Sultan Babullah TTE 0.833644 127.386975
West Papua Rendani MKW -0.892346 134.048810
Appendix 2. List and Values of Latitude and Longtitude of the Airports in ASEAN Coun-tries
Countries Cities Airports Latitude Longtitude
Malaysia Kota Kinabalu Kota Kinabalu 5.937625 116.051495 Thailand Bangkok Suvarna Bhumi Int Airport 13.693858 100.751295 Brunei Bandar Seri Begawan Brunei 4.947644 114.925175 Philippine Cebu Mactan Int Airport 10.326921 123.905546
Thailand Chiang Mai Chiang Mai 18.76693 98.962862
Philippine Davao Fransisco Bangoy Int Airport 7.125379 125.645392
Indonesia Denpassar Bali -8.656299 115.222104
Vietnam Hanoi San Bay Quoc 21.219821 105.803998
Thailand Phuket Phuket 8.11285 98.313897
Indonesia Jakarta Soekarno Hatta -6.126218 106.657333
Malaysia Kuching Kuching 1.484812 110.34642
Malaysia Kuala Lumpur Kuala Lumpur 2.756419 101.701541 Laos Luang Prabang Luang Prabang 19.898471 102.16228 Myanmar Mandalay Mandalay Chanmyathazi 21.941453 96.089673
Indonesia Medan Polonia 3.567766 98.676764
Philippine Manila Ninoy Aquino 14.509394 121.018767
Malaysia Penang Penang 5.297545 100.275292
Kamboja Phnom Penh Phnom Penh 11.546635 104.847836
Cambodia Siem Reap Siem Reap 13.410994 103.812532
Myanmar Yangon Yangon 16.909355 96.134992
Vietnam Ho Chi Min City Tan Son Nhat 10.827911 106.649237
Singapore Singapore Changi 1.358272 103.910576
Indonesia Surabaya Juanda -7.380683 112.787704