Summary Branches of nine-year-old loblolly pine trees grown in a 2 × 2 factorial combination of fertilization and irrigation were exposed for 11 months to ambient, ambient + 175, or ambient + 350 µmol mol−1 CO
2. Rates of light-saturated net photosynthesis (Amax), maximum stomatal conductance to water vapor (gmax), and foliar nitrogen concentration (% dry mass) were assessed monthly from April 1993 until September 1993 on 1992 foliage (one-year-old) and from July 1993 to March 1994 on 1993 foliage (current-year).
Rates of Amax of foliage in the ambient + 175 CO2 treatment and ambient + 350 were 32--47 and 83--91% greater, respec-tively, than that of foliage in the ambient CO2 treatment. There was a statistically significant interaction between CO2 treat-ment and fertilization or irrigation treattreat-ment on Amax on only one measurement date for each age class of foliage. Light-satu-rated stomatal conductance to water vapor (gmax) was signifi-cantly affected by CO2 treatment on only four measurement dates. Light-saturated gmax in winter was only 42% of summer
gmax even though soil water during winter was near field capacity and evaporative demand was low. Fertilization in-creased foliar N concentration by 30% over the study period when averaged across CO2 treatments. During the study pe-riod, the ambient + 350 CO2 treatment decreased average foliar N concentration of one-year-old foliage in the control, irri-gated, fertilized and irrigated + fertized plots by 5, 6.4, 9.6 and 11%, respectively, compared with one-year-old foliage in the corresponding ambient CO2 treatments. The percent increase in Amax due to CO2 enrichment was similar in all irrigation and fertilization treatments and the effect persisted throughout the 11-month study period for both one-year-old and current-year foliage.
Keywords: elevated CO2, foliar N concentration, loblolly pine,
net assimilation, Pinus taeda, stomatal conductance .
Introduction
Mean global concentration of atmospheric CO2 is expected to
reach 700 µmol−1 by the middle of the next century (Conway et al. 1988). The extent that terrestrial ecosystems act as carbon sinks to buffer the increase in atmospheric CO2 concentration is uncertain (Tans et al. 1990). Forests, which cover over one-third of the Earth’s land area (Kramer 1981), are currently estimated to account for approximately 70% of the annual terrestrial atmospheric carbon exchange (Waring and Schlesin-ger 1985). Thus, a detailed knowledge of the relationship between net photosynthesis and increasing atmospheric CO2 concentration is required to estimate the potential of forests for reducing rising atmospheric CO2 concentrations.
Studies on the effects of elevated CO2 on net photosynthesis have produced conflicting results. Short-term studies of the effects of elevated CO2 on crop species, horticultural plants, and tree seedlings have shown that the rate of photosynthetic assimilation increases by 20--200% when atmospheric CO2 concentration is doubled (Higginbotham et al. 1985, Cure and Acock 1986, Eamus and Jarvis 1989, Drake and Leadley 1991, Idso and Kimball 1991, Stewart and Hoddinott 1993, Lee et al. 1993, Gunderson et al. 1993, El Kohen and Mousseau 1994). In contrast, long-term studies have shown that there is a de-crease (DeLucia et al. 1985, Peet et al. 1986) or no inde-crease in rates of net photosynthesis with increasing duration of expo-sure to elevated CO2 concentration (Gaudillere and Mousseau 1989, Grulke et al. 1993). In some species, the magnitude of the photosynthetic response to elevated CO2 increases with increasing nutrient availability (Conroy et al. 1986a, 1986b,
Tissue et al. 1993), however, a positive photosynthetic re-sponse to elevated CO2 has also been observed in nitrogen-de-ficient trees of some species (Norby et al. 1986, Norby and O’Neill 1989, Gunderson et al. 1993). In an attempt to explain these conflicting reports, we have undertaken a long-term study to assess the photosynthetic potential of mature forest trees to increasing availability of CO2, nutrients and water.
Long-term studies to evaluate the response of mature trees to elevated CO2 have been limited by difficulty in accessibility and the high cost of exposing large trees to CO2 treatments. The use of branch chambers (Teskey et al. 1991, Barton et al.
Effects of carbon dioxide, fertilization, and irrigation on
photosynthetic capacity of loblolly pine trees
RAMESH MURTHY,
1PHILLIP M. DOUGHERTY,
2,4STANLEY J. ZARNOCH
3and
H. LEE ALLEN
11
Department of Forestry, North Carolina State University, Raleigh, North Carolina 27695, USA 2
Westvaco, P.O. Box 1950, Summerville, South Carolina 29484, USA 3
USDA Forest Service, P.O. Box 2680, Ashville, North Carolina 28802, USA 4
Author to whom correspondence should be addressed
Received April 27, 1995
tude and duration of Amax,gmax, and foliar N response of two age classes of foliage of nine-year-old loblolly pine trees to CO2, water, and nutrient availability. Down-regulation of pho-tosynthesis was not evaluated.
Materials and methods
Study site characteristics
The study site is located on the Carolina Sandhills, Scotland County, NC, USA (34°55′ N, 79°30′ W). Annual temperature averages 17 °C, and air temperatures in the summer (June--September) and winter (December--March) average 26 and 9 °C, respectively. Average annual rainfall is 121 cm and periods of drought often occur in late summer and early autumn.
The soil is a deep sand belonging to the Wakulla series, sandy, siliceous, thermic psammentic hapludult (USDA Soil Classification System). The soil is well drained and available water-holding capacity in the upper 2 m of the soil profile is 18--20 cm. Pretreatment foliage N concentration in the dor-mant season (December--February) was 0.98% dry mass, which is less than the critical concentration of 1.15% dry mass established for loblolly pine (Allen 1987). The critical N con-centration is based on the N concon-centration below which there is a large enough growth response to fertilization to make it economically viable to fertilize a stand.
The site was planted in March 1985 at a spacing of 2.4 × 2.4 m with a 10 family, half-sib mix of North Carolina pied-mont seedlings. In 1992, the stand was thinned to 1260 trees per hectare. Average height and bole diameter at 1.3 m height after thinning were 3.4 m and 4.6 cm, respectively. Associated understory vegetation (hardwoods and grasses) was controlled with glyphosate applied at a rate of 1.5% by volume.
Study design
The study was a split-plot design with a 2 × 2 factorial combi-nation of fertilization and irrigation. The four whole-plot treat-ment combinations (control (C); irrigation only (I); fertilization only (F); and fertilization + irrigation (FI)) were randomly assigned to one of four treatment plots in each of four blocks. Treatment plots were 50 × 50 m with interior measurement plots of 30 × 30 m. Fertilization treatment con-sisted of an initial application of nitrogen (200 kg ha−1), phosphorus (50 kg ha−1), and potassium (100 kg ha−1) in March 1992. This was followed by an application of calcium (120 kg ha−1), magnesium (50 kg ha−1) and boron (1.5 kg ha−1) in the April--June period of 1992. Nitrogen, P, K and Mg (23, 20, 19 and 0.16 kg ha−1, respectively) were applied in April
located below the canopy. Soil water of the irrigated plots was measured by time domain reflectrometry (TDR) every two days during the growing season to determine the need for irrigation. In addition, soil water content at depths of 10, 25, and 50 cm was measured every two weeks in all plots.
Subplot treatments were ambient, ambient + 175 and ambi-ent + 350 µmol mol−1 CO2. The CO2 treatments were randomly assigned to a single tree in each plot (16 trees in total) using the branch chamber technology developed by Teskey et al. (1991). Three branches were selected from the mid crown (1989 or 1990 whorl) of each tree and exposed to ambient, ambient + 175, or ambient + 350 µmol mol−1 CO2. Exposures started in March 1993 and continued throughout the study period for 24 h daily. A computer-based control system was used to measure and control CO2 concentrations in each of the 48 branch chambers. The computer was linked to a data logger process controller (Keithley 500A, Keithley Inc., Data Sys-tems, OH) that regulated the opening and closing of solenoids to switch sample air coming from the chambers to an infrared gas analyzer (LI 6262, Li-Cor, Inc., Lincoln, NE) that sequen-tially measured the CO2 and water vapor concentrations of the sample air stream in each of the exposure chambers. All 48 chambers were cycled through within 30 min. Carbon dioxide was dispensed at a fixed addition rate to ambient CO2 irrespec-tive of the ambient CO2 concentration. Blowers, regulated to achieve a minimum of six exchanges of chamber air per min-ute, were used to mix CO2 with ambient air and deliver the mixture through each exposure chamber. Temperature within the chamber was not controlled. A photosynthetic photon flux density (PPFD) sensor (G1118, Hamamatsu Corp., Bridgewa-ter, NJ) and a copper-constantan thermocouple located within each chamber were used to measure PPFD and chamber air temperature, respectively. Output from all PPFD and tempera-ture sensors was measured every 6 s, averaged over each hour and recorded by four data loggers (CR-7, Campbell Scientific Inc., Logan, UT). Ambient weather conditions were monitored from an on-site weather station.
Plant measurements
Light-saturated net photosynthesis (Amax) and maximum sto-matal conductance to water vapor (gmax) were measured once per month on current-year (1993) and one-year-old foliage (1992) on all 48 branches exposed to CO2 treatments. A port-able infrared gas analyzer (ADC-LCA3, Analytical Develop-ment Corporation, Hoddesdson, U.K.) equipped with a Parkinson leaf chamber (PLC-3) was used for all Amax and
of CO2 in air. Monthly checks of ADC humidity sensors were also made. All Amax and gmax measurements were made at the CO2 concentration to which the branches were exposed in the branch chambers. Measurements of Amax and gmax were taken in the early morning (0300--0900 h) to minimize water stress and to maintain cuvette temperatures between 25 and 30 °C in summer and between 15 and 20 °C in winter and early spring (cf. Strain et al. 1976). Three fascicles (nine needles) from the first flush of two age classes of foliage (1992 and 1993) were enclosed in the cuvette for each gas exchange measurement. All Amax and gmax measurements were made under light-satu-rating conditions (> 1600 µmol m−2 s−1) at a relative humidity of approximately 40%. Humidity was regulated by columns of ‘‘Drierite’’ and FeSO4.7H2O attached to the ADC unit. Vapor pressure deficit at a relative humidity of 40% ranged from 1.02 to 1.404 kPa at 15--20 °C and from 1.902 to 2.544 kPa at 25--30 °C. To ensure that the foliage was equilibrated to a high PPFD when gas exchange measurements were made, branches were first exposed for 45--60 min to artifical light provided by tungsten-halogen lamps (Osram Corp., NY, USA) mounted within each exposure chamber. A similar lamp was mounted permanently on the ADC leaf cuvette and used for all gas exchange measurements. After measurements of Amax and
gmax were completed, the needles were destructively sampled for leaf area and foliar N concentrations. Leaf area was calcu-lated from average needle radius and needle length (Fites and Teskey 1988). Each set of nine needles was then oven dried at 65 °C and analyzed for nitrogen (N) by the combustion method with an N auto analyzer (Carlo-Erba NA 1500, Carlo-Erba Strumentatzione, Milan, Italy). Foliar N concentrations were expressed as percentages of dry mass.
Gas exchange measurements on one-year-old foliage (formed in 1992) were taken from April to September 1993.
Needles began senescing in September and by October had either senesced or were too fragile for additional gas exchange measurements. Gas exchange measurements on current-year foliage were begun in July, after the needles had achieved about 70% of their full growth and continued until March 1994. Measurements on current-year foliage were not made in November 1993 because of instrument malfunction.
Statistical analysis
Gas exchange and foliar N concentration data were analyzed according to standard split-plot methodology on a monthly basis (Steel and Torrie 1980). The Statistical Analysis System (SAS Institute, Cary, NC) software was used for all statistical analyses. All analyses were conducted at the 0.05 probability level.
Results
Environmental characteristics
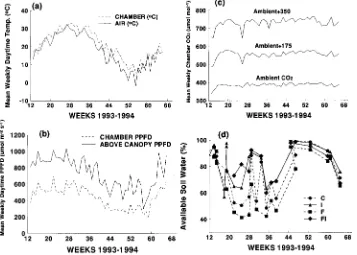
Average daytime temperature within the branch chambers ranged from 5.47 to 34.67 °C during the study (Figure 1a). Chamber temperatures were 1, 2, 3, 4, and 5 °C above ambient temperature for 44, 33, 13, 3.8 and 0.5% of all measurements taken. Chamber temperatures were 1 °C below ambient for only 0.5% of the total readings. During the daytime, daily average PPFD within the branch chambers was 505 µmol m−2 s−1. Branch chambers located at mid crown received an aver-age of 50% of the PPFD measured above the canopy (Figure 1b). During the daytime, average daily CO2 concentrations for the three CO2 treatments were 385, 555, and 731 µmol mol−1 with standard deviations of 14.2, 27.2, and 41.3, respectively (Figure 1c).
Stomatal conductance
One-year-old foliage Average light-saturated stomatal con-ductance (gmax) of one-year-old foliage was 0.07 mol m−2 s−1 in April and increased to 0.14 mol m−2 s−1 by May (Figure 2). Depressions in gmax occurred in June, coinciding with low available soil water. Mean gmax values over the study period were 0.12, 0.13, and 0.12 mol m−2 s−1 for the ambient, ambient + 175 and ambient + 350 CO2 treatments, respectively, and 0.13, 0.13, 0.09, and 0.12 mol m−2 s−1 for the C, I, F, and FI treatments, respectively.
The CO2 treatments significantly affected gmax only in July and August, whereas there was a significant fertilizer effect and a significant F × I interaction in September. Irrigation did not significantly affect gmax on any measurement date. None of the other two- or three-way interactions were significant (Ta-ble 1).
Current-year foliage Light-saturated stomatal conductance (gmax) of current-year foliage increased with foliage age, reach-ing an average maximum of 0.22 mol m−2 s−1 in October 1993 when foliage was fully developed (Figure 3). Light-saturated gmax decreased with the onset of winter to a minimum of 0.04 mol m−2 s−1 in February 1994 (Figure 3). Neither maximum nor minimum gmax observed for current-year foliage appeared to coincide with soil water status. Fertilization and irrigation significantly affected gmax in July and CO2 significantly af-Figure 2. Trends in mean gmax for one-year-old foliage for control
(circles), irrigated (triangles), fertilized (squares) and fertilized + irri-gated (diamonds) plots. Each point is an average of four block meas-urements.
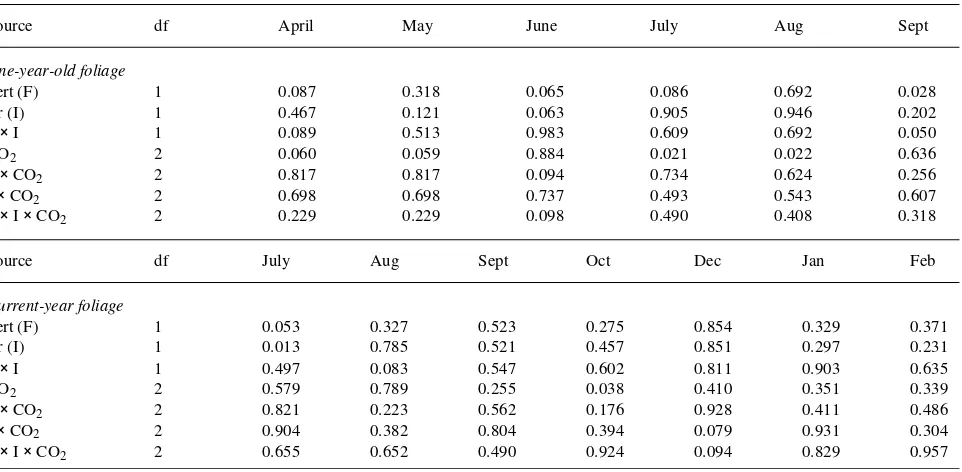
Table 1. Monthly split-plot analysis (P-values) for stomatal conductance (gmax) measurements of one-year-old and current-year foliage.
Source df April May June July Aug Sept
One-year-old foliage
Fert (F) 1 0.087 0.318 0.065 0.086 0.692 0.028
Irr (I) 1 0.467 0.121 0.063 0.905 0.946 0.202
F × I 1 0.089 0.513 0.983 0.609 0.692 0.050
CO2 2 0.060 0.059 0.884 0.021 0.022 0.636
F × CO2 2 0.817 0.817 0.094 0.734 0.624 0.256
I × CO2 2 0.698 0.698 0.737 0.493 0.543 0.607
F × I × CO2 2 0.229 0.229 0.098 0.490 0.408 0.318
Source df July Aug Sept Oct Dec Jan Feb
Current-year foliage
Fert (F) 1 0.053 0.327 0.523 0.275 0.854 0.329 0.371
Irr (I) 1 0.013 0.785 0.521 0.457 0.851 0.297 0.231
F × I 1 0.497 0.083 0.547 0.602 0.811 0.903 0.635
CO2 2 0.579 0.789 0.255 0.038 0.410 0.351 0.339
F × CO2 2 0.821 0.223 0.562 0.176 0.928 0.411 0.486
I × CO2 2 0.904 0.382 0.804 0.394 0.079 0.931 0.304
fected gmax in October. None of the two- or three-way interac-tions were significant (Table 1).
Light-saturated net photosynthesis
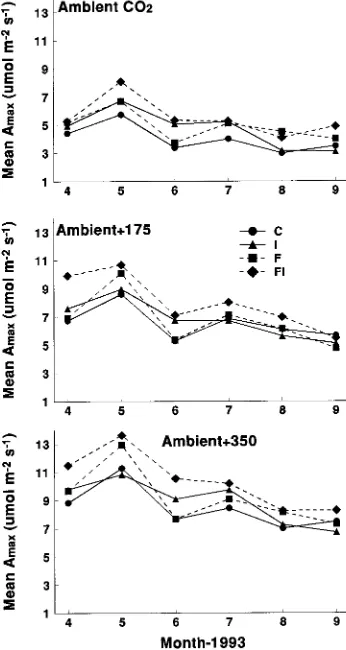
One-year-old foliage In all treatment combinations, Amax of one-year-old foliage increased to a seasonal maximum in May and then declined more than 40% by September just before senescence (Figure 4).
Fertilization significantly increased Amax in one-year-old foliage in April, May, June, and August. Over the four months, Amax averaged 7.6 µmol m−2 s−1 for the fertilized plots and 6.8
µmol m−2 s−1 for the unfertilized plots. Irrigation significantly increased mean Amax in April, May, and June. Over the three months, Amax averaged 8.5 µmol m−2 s−1 for the irrigated plots and 7.25 µmol m−2 s−1 for the unirrigated plots. Mean A
max was significantly different for each of the CO2 treatments for all months. Irrespective of the fertilizer and irrigation treatments, Amax in the + 350 CO2 treatment was 83 to 91% greater than in the ambient CO2 treatment. Average Amax values for the study period were 9.2, 7.1 and 4.8 µmol m−2 s−1 for the + 350 CO2, + 175 CO2, and ambient CO2 treatments, respectively. No
significant two- or three-way interactions were detected for fertilizer, irrigation, or CO2 except for an I × CO2 interaction in April (Table 2).
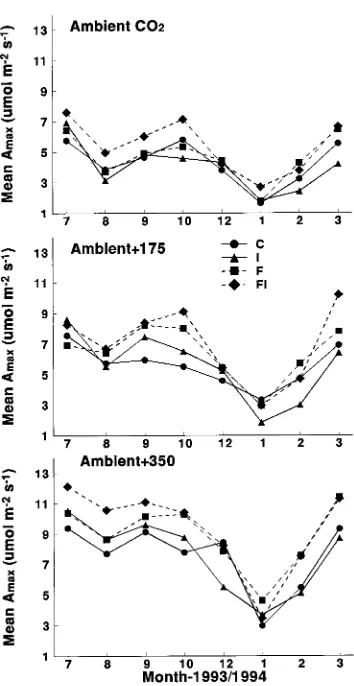
Current-year foliage In current-year developing foliage, Amax peaked in July, when foliage was 70% of its final length (Figure 5). Light-saturated net photosynthesis remained high throughout the summer, declined during the winter, and in-creased again in the late winter--early spring period following a trend similar to that exhibited by gmax for current-year foliage (Figure 3).
Fertilization significantly increased mean Amax in August, September, February, and March (Table 2). Over these four months, Amax averaged 6.6 µmol m−2 s−1 for the fertilized plots and 5.5 µmol m−2 s−1 for the unfertilized plots, respectively. Irrigation significantly increased Amax in July, August and September, a period when soil water was low. Over these three months, Amax averaged 7.84 µmol m−2 s−1 for the irrigated plots and 6.93 µmol m−2 s−1 for the unirrigated plots. The elevated CO2 treatments had a significant effect on Amax throughout the study period. Averaged across the fertilizer and irrigation treat-Figure 3. Trends in mean gmax for current-year foliage for control
(circles), irrigated (triangles), fertilized (squares) and fertilized + irri-gated (diamonds) plots. Each point is an average of four block meas-urements.
ments, Amax values were 10.6, 7.7, and 6.6 µmol m−2 s−1, for foliage exposed to + 350, + 175 and ambient concentrations of CO2, respectively. The effect of elevated CO2 on Amax persisted even when mean Amax reached a minimum in January 1994. Averaged over the irrigation and fertilizer treatments in Janu-ary, Amax values were 3.72, 2.75 and 1.51 µmol m−2 s−1 in the + 350 CO2, + 175 CO2, and ambient CO2 treatments, respec-tively. There were no significant interactions between CO2 and fertilizer or irrigation, except for an I × CO2 interaction in August (Table 2).
Foliar N concentration
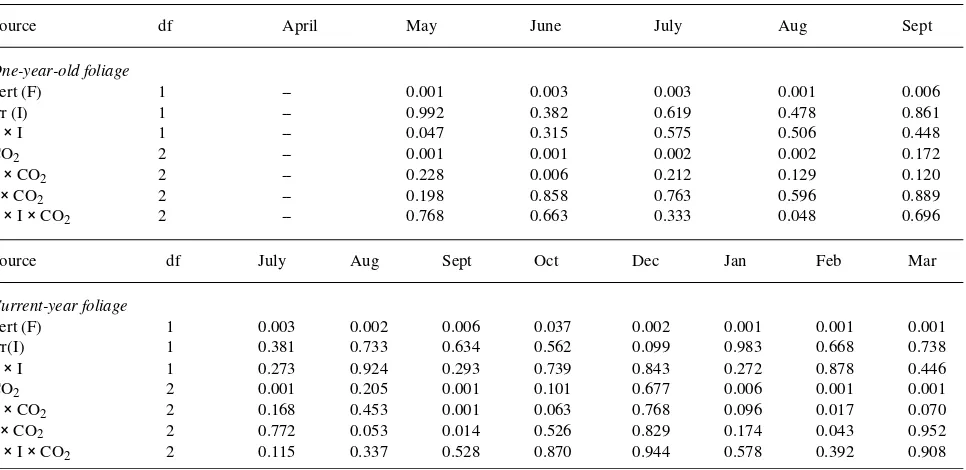
One-year-old foliage Over the study period, fertilizer in-creased foliar N concentrations of one-year-old foliage by 25--34% in all three CO2 treatments (Figure 6). Foliar N concentrations steadily decreased from May to September 1993, coinciding with a decrease in Amax (Figure 4).
Fertilization significantly increased foliar N concentration for all months, whereas there was no significant effect of irrigation on foliar N (Table 3). Foliar N concentration aver-aged over the study period and CO2 treatments was 1.03% for the fertilized plot and 0.77% for the unfertilized plots. Foliar N concentration of foliage growing in the + 350 CO2 treatment was significantly lower than that of foliage growing in the ambient CO2 treatment for all months except September, im-mediately before abscission. Foliar N concentrations averaged over the study period and across the C, I, F and FI treatments, were 0.85 and 0.93% for the + 350 CO2 and ambient CO2 treatments, respectively. There were no significant two- or three-way interactions, except for an F × I interaction in May, an F × CO2 interaction in June, and an F × I × CO2 interaction
I × CO2 2 0.045 0.302 0.289 0.617 0.873 0.817
F × I × CO2 2 0.093 0.669 0.283 0.349 0.442 0.898
Source df July Aug Sept Oct Dec Jan Feb Mar
Current-year foliage
Fert (F) 1 0.243 0.002 0.002 0.235 0.274 0.435 0.003 0.002
Irr (I) 1 0.005 0.024 0.039 0.566 0.431 0.497 0.188 0.879
F × I 1 0.792 0.282 0.986 0.497 0.609 0.625 0.154 0.258
CO2 2 0.001 0.001 0.001 0.002 0.001 0.001 0.001 0.001
F × CO2 2 0.094 0.290 0.653 0.822 0.498 0.475 0.114 0.454
I × CO2 2 0.887 0.031 0.933 0.857 0.223 0.351 0.068 0.081
F × I × CO2 2 0.808 0.147 0.307 0.273 0.064 0.604 0.833 0.546
Figure 6. Trends in mean foliar N concentration (% dry mass basis) for one-year-old foliage for control (circles), irrigated (triangles), fertil-ized (squares) and fertilfertil-ized + irrigated (diamonds) plots. Each point is an average of four block measurements.
Table 3. Monthly split-plot analysis (P-values) for foliar N concentrations of one-year-old and current-year foliage.
Source df April May June July Aug Sept
One-year-old foliage
Fert (F) 1 -- 0.001 0.003 0.003 0.001 0.006
Irr (I) 1 -- 0.992 0.382 0.619 0.478 0.861
F × I 1 -- 0.047 0.315 0.575 0.506 0.448
CO2 2 -- 0.001 0.001 0.002 0.002 0.172
F × CO2 2 -- 0.228 0.006 0.212 0.129 0.120
I × CO2 2 -- 0.198 0.858 0.763 0.596 0.889
F × I × CO2 2 -- 0.768 0.663 0.333 0.048 0.696
Source df July Aug Sept Oct Dec Jan Feb Mar
Current-year foliage
Fert (F) 1 0.003 0.002 0.006 0.037 0.002 0.001 0.001 0.001
Irr(I) 1 0.381 0.733 0.634 0.562 0.099 0.983 0.668 0.738
F × I 1 0.273 0.924 0.293 0.739 0.843 0.272 0.878 0.446
CO2 2 0.001 0.205 0.001 0.101 0.677 0.006 0.001 0.001
F × CO2 2 0.168 0.453 0.001 0.063 0.768 0.096 0.017 0.070
I × CO2 2 0.772 0.053 0.014 0.526 0.829 0.174 0.043 0.952
F × I × CO2 2 0.115 0.337 0.528 0.870 0.944 0.578 0.392 0.908
followed by foliage in the + 175 (1.05%) and + 350 CO2 (1.03%) treatments, respectively. There were significant F × CO2 interactions in September and February, and significant I
× CO2 interactions in August, September and February. No significant three-way interaction was observed (Table 3).
Discussion
When expressed as a percentage of Amax of foliage grown in ambient CO2, Amax of foliage grown in the + 175 or + 350 CO2 treatment showed similar increases irrespective of whether the trees were grown in a fertilized (F), irrigated (I), fertilized + irrigated (FI) or control (C) plot. Thus, an increase in CO2 concentration from ambient to + 350 µmol mol−1 resulted in an average increase in Amax of 93, 85, 91 and 83%, respectively for trees in the C, I, F and FI plots, respectively. Positive responses of Amax to elevated CO2 have been reported in nitro-gen-deficient trees (Norby and O’Neill 1989, Gunderson et al. 1993, Teskey 1995) and in water-stressed trees (Huber et al. 1984, Johnsen 1993). In addition, many other studies in which nutrients or water were not enhanced report increases in net photosynthesis in response to elevated CO2 (e.g., Norby et al. 1986 in hardwood seedlings, Fetcher et al. 1988, Stewart and Hoddinott 1993, Lee et al. 1993 in various conifers, Idso and Kimball 1992 in sour orange trees and Downton et al. 1987 in Valencia orange). However, in other studies it has been shown that the increase in Amax in response to elevated CO2 is depend-ent on nutridepend-ent availability (Conroy et al. 1986a, Cure et al. 1988, Tissue et al. 1993, Thomas et al. 1994), or water avail-ability (Miao et al. 1992).
Fertilization alone was responsible for a 20 and 24% in-crease in Amax of foliage grown in the + 350 CO2 and ambient CO2 treatments, respectively. This increase is comparable to reports of a 15--20% increase in photosynthetic capacity of
Pinus sylvestris foliage in response to irrigation and fertiliza-tion (Linder and Axelsson 1982, Zhang 1993).
In addition to increasing Amax, fertilization also increases stand leaf area. In the same study that our Amax measurements were made in, Allen et al. (1996) determined that fertilization increased leaf area index (LAI) by 78% over that of the control plots. The combined effects of fertilizer on LAI and Amax determine the total effect of fertilization on stand carbon gain. Zhang (1993) reported that the increases in LAI and photosyn-thetic rate accounted for 70 and 30%, respectively, of the increase in carbon gain due to fertilization. Because the effects of fertilization and elevated CO2 on Amax are additive, the elevated-CO2-induced increase in whole-tree or stand carbon gain potential should be greatly enhanced in a high nitrogen
magnitude of the Amax response and the consistency of the response. Twice ambient CO2 produced a significant Amax response every month, whereas fertilizer and irrigation did so only in certain months. Furthermore, even though Amax and foliar N concentration of one-year-old foliage gradually de-clined over the study period for all treatment combinations, the enhancing effect of elevated CO2 on Amax of loblolly pine was maintained over the entire lifespan of the foliage. Similar results were obtained for yellow-poplar and white oak seed-lings (Gunderson et al. (1993).
We did not observe a consistent decrease in gmax in the elevated CO2 treatments or in the F, I and FI treatments. Similar findings have been reported by Gunderson et al. (1993), Sa-muelson and Seiler (1994), and Teskey (1995), but contrasting findings have been reported by DeLucia et al. (1985), Surano et al. (1986) and Fetcher et al. (1988). We obtained preliminary evidence that the value of gmax in winter may be important in determining the potential response to elevated CO2. Maximum
gmax in winter was only 42% of gmax observed in the summer months, even though the winter measurements were made under light-saturated conditions at a chamber temperature of 15 to 20 °C and soil was near field capacity and evaporative demand was low. DeLucia (1986) has shown that stomatal conductance in Engelmann spruce seedlings declines with decreasing soil temperature. Results reported by Brissette and Chambers (1992) for shortleaf pine also indicate decreases in root growth, xylem pressure potential and gmax as water tem-perature is reduced from 20 to 15 °C. During the winter period when gmax was low, Amax was at a minimum; however, the relative increase in Amax of current-year foliage in the elevated CO2 treatment over that in the ambient CO2 treatment was maintained despite the 58% decrease in gmax from summer (July) to winter (March). These results suggest that elevated CO2 has the potential to increase winter season carbon gain of loblolly pine. In addition, if low soil temperatures are respon-sible for the observed low values of gmax in winter, an increase in winter temperatures may enhance winter gas exchange capacity of loblolly pine. The extent to which winter carbon gain in conifers is increased will be an important factor in determining the success of conifers in competing with hard-woods, which have inherently higher Amax but shorter leaf area duration.
and water availabilities, and (c) even when gmax is low in winter. (3) In both age classes of foliage, the addition of fertilizer increases Amax and the effects of elevated CO2 and fertilization on Amax are additive. (4) In both current-year and one-year-old foliage, enhanced CO2 does not consistently re-duce gmax. (5) Winter gmax is low even when measurement conditions are optimum.
Our findings have several ecophysiological implications. First, the large positive response of Amax to increased CO2 concentration over a wide range of site resource treatments suggests that significant enhancement in carbon gain may occur over most of the current range of loblolly pine under elevated CO2 conditions. Second, increased winter tempera-tures and CO2 concentrations would both favor a northward extension in the range of loblolly pine. Kramer and Kozlowski (1979) concluded that low temperature effects on stomatal conductance and gas exchange presented a major limitation to the northward distribution of loblolly pine. Our results suggest that increased CO2 enhances Amax even when low winter tem-peratures cause a more than 50% reduction in gmax. Third, because carbohydrate production potential will increase in response to elevated CO2, and nitrogen is currently a major factor limiting productivity across much of the range of lob-lolly pine, it can be expected that the potential gains from fertilization will be increased. Fourth, because elevated CO2 concentration increases winter carbon gain, the coniferous habit of loblolly pine may give the species an advantage over its deciduous hardwood competitors.
Acknowledgment
This project was funded by the USDA Forest Service Southern Global Change Program.
References
Allen, H.L. 1987. Forest fertilizers. J. For. 85:37--46.
Allen, H.L., T.J. Albaugh and P.M. Dougherty. 1996. Influence of nutrient and water availability on leaf area and productivity: A case study with loblolly pine (Pinus taeda L.) in the southeast U.S. In
Proc. 25th Congr. Brazilian Soil Science Soc., Fed. Univ. Viçosa. In press.
Barton, C.V.M., H.S.J. Lee and P.G. Jarvis. 1993. A branch bag and CO2 control system for long-term CO2 enrichment of mature Sitka spruce [Picea sitchensis (Bong.) Carr.]. Plant Cell Environ. 16:1139--1148.
Brissette, J.C. and J.L. Chambers. 1992. Leaf water status and root system water flux of shortleaf pine (Pinus echinata Mill.) seedlings in relation to new root growth after transplanting. Tree Physiol. 11:289--303.
Conroy, J., E.W.R. Barlow and D.I. Bevege. 1986a. Response of Pinus radiata seedlings to carbon dioxide enrichment at different levels of water and phosphorus: growth, morphology and anatomy. Ann. Bot. 57:165--177.
Conroy, J.P., R.M. Smillie, M. Kuppers, D.I. Bevege and E.W. Barlow. 1986b. Chlorophyll a fluorescence and photosynthetic and growth responses of Pinus radiata to phosphorus deficiency, drought stress and high CO2. Plant Physiol. 81:423--429.
Conroy, J.P. 1992. Influence of elevated atmospheric CO2 concentra-tions on plant nutrition. Aust. J. Bot. 40:445--456.
Conroy, J.P. and P. Hocking. 1993. Nitrogen nutrition of C3 plants at elevated atmospheric CO2 concentrations. Physiol. Plant. 89:570--576.
Conway, T.J., P. Tans, L.S. Waterman, K.W. Thoning, K.A. Masarie and R.M Gammon. 1988. Atmospheric carbon dioxide measure-ments in the remote global troposphere, 1981--1984. Tellus 40B: 81--115.
Cure, J.D. and B. Acock. 1986. Crop responses to carbon dioxide doubling: a literature survey. Agric. For. Meteorol. 38:127--145. Cure, J.D., D.W. Israel, T.W. Rufty, Jr. 1988. Nitrogen stress effects on
growth and seed yield of non nodulated soybean exposed to elevated carbon dioxide. Crop Sci. 28:671--677.
DeLucia, E.H., T.W. Sasek and B.R. Strain. 1985. Photosynthetic inhibition after longterm exposure to elevated levels of atmospheric CO2. Photosynth. Res. 7:175--184.
DeLucia, E.H. 1986. Effect of low root temperature on net photosyn-thesis, stomatal conductance and carbohydrate concentration in Engelmann spruce (Picea engelmannii Parry ex Engelm.) seed-lings. Tree Physiol. 2:143--154.
Downton, W.J.S., W.J.R. Grant and B.R. Loveys. 1987. Carbon diox-ide enrichment increases yield of valencia orange. Aust. J. Plant Physiol. 14:493--501.
Drake, B.G. and P.W. Leadley. 1991. Canopy photosynthesis of crops and native plant communities exposed to longterm elevated CO2. Plant Cell Environ. 14:853--860.
Eamus, D. and P.G. Jarvis. 1989. The direct effects of increase in the global atmospheric CO2 concentration on natural and commercial temperate trees and forests. Adv. Ecol. Res. 19:1--55.
El Kohen, A. and M. Mousseau. 1994. Interactive effects of elevated CO2 and mineral nutrition on growth and CO2 exchange of sweet chestnut seedlings (Castanea sativa). Tree Physiol. 14:679--690. Fetcher, N., C.H. Jaeger, B.R. Strain and N. Sionit. 1988. Long-term
elevation of atmospheric CO2 concentration and the carbon ex-change of saplings of Pinus taeda L. and Liquidambar styraciflua
L. Tree Physiol. 4:255--262.
Fites, J.A. and R.O. Teskey. 1988. CO2 and water vapor exchange in Pinus taeda in relation to stomatal behavior: a test of an optimiza-tion hypothesis. Can. J. For. Res. 18:150--157.
Gaudillere, J.P. and M. Mousseau. 1989. Short-term effect of CO2 enrichment on leaf development and gas exchange of young poplars (Populus euramericana cv. 1214). Oecol. Plant. 10:95--105 Grulke, N.E., J.L. Hom and S.W. Roberts. 1993. Physiological
adjust-ment of two full-sib families of ponderosa pine to elevated CO2. Tree Physiol. 12:391--401.
Gunderson, C.A., R.J. Norby and S.D. Wullschleger. 1993. Foliar gas exchange of two deciduous hardwoods during 3 years of growth in elevated CO2 : no loss of photosynthetic enhancement. Plant Cell Environ. 16:797--807.
Higginbotham, K.O., J.M. Mayo, S.L. Hirondelle and D.K. Krystofiak. 1985. Physiological ecology of lodgepole pine (Pinus contorta) in an enriched CO2 environment. Can. J. For. Res. 15:417--421.
Kramer, J. 1981. Carbon dioxide concentration, photosynthesis, and dry matter production. Bioscience 31: 29--33.
Lee, H., C. Barton and P.G. Jarvis. 1993. Effects of elevated CO2 on mature sitka spruce. Vegetatio 104/105:456--457.
Linder, S and B. Axelsson. 1982. Changes in carbon uptake and allocation as a result of irrigation and fertilization in a young Pinus sylvestris stand. In Carbon Uptake and Allocation in Subalpine Ecosystems as a Key to Management. Ed. R.H. Waring. For. Res. Lab., Oregon State Univ., pp 38--44.
Liu, S. and R.O. Teskey. 1995. Responses of foliar gas exchange to long-term elevated CO2 concentrations in mature loblolly pine trees. Tree Physiol. 15:351--359.
Miao, S.L., P.M. Wayne and F.A. Bazzaz. 1992. Elevated CO2 differ-entially alters the responses of co-occurring birch and maple seed-lings to a moisture gradient. Oecologia 90:300--304.
Norby, R.J. and E.G. O’Neill. 1989. Growth dynamics and water use of seedlings of Quercus alba L. in CO2-enriched atmospheres. New Phytol. 111:491--500.
Norby, R.J., E.G. O’Neill and R.J. Luxmoore. 1986. Effects of atmos-pheric CO2 enrichment on the growth and mineral nutrition of Quercus alba seedlings in nutrient-poor soil. Plant Physiol. 82:83--89.
Peet, M.M., S.C. Huber and D.T. Patterson. 1986. Acclimation to high CO2 in monoecious cucumbers. Plant Physiol. 80:63--67. Samuelson, L.J. and J.R. Seiler. 1994. Red spruce seedling gas
ex-change in response to elevated CO2, water stress and soil fertility treatments. Can. J. For. Res. 24:954--959.
Palassou and M.P. Costella. 1986. Growth and physiological re-sponses of Pinus ponderosa Dougl. ex P. Laws to long-term ele-vated CO2 concentrations. Tree Physiol. 2:243--259.
Tans, P.P., I.Y. Ting and T. Takakhashi. 1990. Observational con-straints on the global atmospheric CO2 budget. Science 247:1431--1438.
Teskey, R.O., P.M. Dougherty and A.E. Wiselogel. 1991. Design and performance of branch chambers suitable for longterm ozone fumi-gation of foliage in large trees. J. Environ. Qual. 20:591--595. Teskey, R.O. 1995. A field study of the effects of elevated CO2 on
carbon assimilation, stomatal conductance and leaf and branch growth of Pinus taeda trees. Plant Cell Environ. 18:1--9.
Thomas, R.B., J.D. Lewis and B.R. Strain. 1994. Effects of leaf nutrient status on photosynthetic capacity in loblolly pine (Pinus taeda L.) seedlings grown in elevated atmospheric CO2. Tree Physiol. 14:947--960.
Tissue, D.T., R.B. Thomas and B.R. Strain. 1993. Long-term effects of elevated CO2 and nutrients on photosynthesis and rubisco in loblolly pine seedlings. Plant Cell Environ. 16:859--865.
Waring, R.H. and W.H. Schlesinger. 1985. Forest ecosystems: con-cepts and management. Academic Press Inc., Orlando, FL, 396 p. Wong, S.C. 1979. Elevated atmospheric partial pressure of CO2 and
plant growth. Oecologia 44:68--74.